
Abstract
Hydrogen has emerged as a key energy carrier in the global transition toward low-carbon and sustainable energy systems. This comparative review evaluates three main hydrogen production pathways — steam methane reforming (SMR), electrolysis using renewable energy, and biomass gasification — to identify optimal balances between cost-effectiveness and environmental sustainability. A systematic literature review was conducted across peer-reviewed journals and authoritative energy reports from 2015–2023, with data compiled on production costs, system efficiencies, carbon dioxide (CO2) emissions, energy consumption, and regional renewable energy availability. Current data show that while SMR remains the most cost-effective method at $1.00–$2.00/kg H2 under favourable natural gas pricing conditions, it carries significant environmental burdens with emissions of 9–10 kg CO2/kg H2. Renewable electrolysis shows rapidly declining costs with near-zero lifecycle emissions, while biomass gasification offers carbon-neutral production at $2.00–$3.00/kg H2. Regional analysis reveals that countries with abundant renewable capacity — Australia, Chile, and Saudi Arabia — achieve the lowest production energy requirements for green hydrogen at 50–60 kWh/kg H2. When environmental costs are internalised through carbon pricing of $50–$100/ton CO2, renewable electrolysis and biomass gasification emerge as economically competitive alternatives to fossil-based hydrogen. Future developments in electrolyser efficiency and global hydrogen trade infrastructure will be critical determinants of pathway competitiveness and environmental sustainability.
Introduction
Hydrogen has emerged as a key energy carrier in the global transition towards low-carbon and sustainable energy systems. As nations strive to reduce greenhouse gas emissions, hydrogen offers a versatile solution: it can be used for electricity generation, industrial processes, and transportation, and it can store energy over long periods.1 Historically, renewable energy technologies such as solar, wind, and hydroelectric power have evolved to provide cleaner alternatives to fossil fuels, yet challenges remain in storing and distributing energy efficiently.2 Hydrogen production technologies bridge this gap, enabling energy generated from renewable sources to be converted into a storable and transportable form.3
The field of hydrogen energy encompasses multiple production pathways, each with unique advantages, costs, and environmental impacts.4 Hydrogen is commonly classified by its carbon intensity: grey hydrogen is produced from fossil fuels without carbon capture and storage (CCS); blue hydrogen is produced from fossil fuels with CCS; and green hydrogen is produced via electrolysis powered entirely by renewable energy.5 SMR, the most widely used method, produces grey hydrogen in its conventional form or blue hydrogen when integrated with CCS.6 While SMR is cost-effective, it is associated with high carbon emissions unless CCS is applied.7 Electrolysis uses electricity — ideally from renewable sources — to split water into hydrogen and oxygen, producing green hydrogen with near-zero lifecycle emissions.8 Although historically more expensive, declining renewable energy costs and improvements in electrolyser efficiency are making electrolysis increasingly competitive.9 Biomass gasification converts organic matter into hydrogen-rich syngas5 and is classified as carbon-neutral when sustainably sourced, or potentially carbon-negative when combined with CCS.7 Each pathway varies not only in cost and efficiency but also in the geographic conditions required for optimal implementation.10
Despite growing recognition of hydrogen’s potential role in decarbonisation, significant gaps remain in understanding which production pathways offer the best combination of economic viability and environmental performance under different regional conditions. Existing literature often examines these pathways in isolation or focuses on single dimensions such as cost or emissions without comprehensive integration. Furthermore, rapid technological advancement in electrolysis and evolving policy landscapes require updated comparative assessments that reflect current data and future projections.
This review addresses these gaps by providing a comprehensive, integrated comparison of hydrogen production pathways across technical, economic, and environmental dimensions. By incorporating environmental externalities into economic assessments and examining geographic variations in renewable resource availability, this review offers practical insights for policymakers, energy planners, and industry stakeholders.11,12
Objectives
This study seeks to investigate and identify the most efficient combination of cost-effectiveness and environmental sustainability for major hydrogen production methods. To address this goal, the review evaluates:
• The technical principles and operational mechanisms of key hydrogen production pathways, including their classification as grey, blue, or green hydrogen
• The cost-efficiency relationships of these pathways, including capital expenditure (CAPEX), operational expenditure (OPEX), and levelised cost of hydrogen (LCOH), with environmental externalities incorporated
• The energy usage patterns across renewable sources and geographic regions
Scope and Limitations
This review focuses on three major production pathways: SMR, electrolysis using renewable energy, and biomass gasification. The scope encompasses published data from 2015–2023 covering cost, efficiency, emissions, and regional characteristics. Emerging alternatives such as photoelectrochemical (PEC) water splitting and biological hydrogen production are not systematically reviewed due to their low technological readiness levels and limited peer-reviewed quantitative data at commercial scale; they are briefly discussed in the context of future directions. Hydrogen storage, distribution, end-use applications, and policy and regulatory frameworks are beyond this review’s scope and would each require extensive dedicated analysis.
Methodology
Search Strategy
A systematic literature search was conducted using Web of Science, Scopus, and Google Scholar databases covering publications from 2015 to 2023. Additional sources included reports from the International Energy Agency (IEA), International Renewable Energy Agency (IRENA), and Bloomberg New Energy Finance (BNEF). Search terms included combinations of: “hydrogen production,” “steam methane reforming,” “electrolysis,” “biomass gasification,” “levelised cost of hydrogen,” “green hydrogen,” “carbon emissions,” and “renewable energy.”
Inclusion Criteria
Studies were included if they met all of the following criteria:
• Peer-reviewed journal articles or authoritative institutional reports published between 2015–2023
• Quantitative data on production costs, system efficiencies, CO2 emissions, or energy consumption
• Studies focused on SMR, electrolysis (alkaline electrolysis (AEL), proton exchange membrane (PEM), or solid oxide electrolysis (SOE)), or biomass gasification
• English language publications
Exclusion criteria included: conference abstracts without full data, studies focused solely on hydrogen storage or end-use applications, and publications without quantitative technical or economic data. The initial search yielded 247 results. After applying inclusion/exclusion criteria and removing duplicates, 29 studies were retained for detailed data extraction.
Data Extraction
From each included study, the following data were extracted: production pathway type, LCOH ($/kg H2), system efficiency (%), CO2 emissions (kg CO2/kg H2), energy consumption (kWh/kg H2), geographic region, renewable energy source (for electrolysis), and feedstock type and cost (for biomass). Data were
recorded in a standardised spreadsheet with source citation, year of publication, and data collection period noted for each value. Where studies reported ranges, both minimum and maximum values were recorded. A complete summary of all 29 references is provided in Supplementary Table S1.
Data Synthesis Method
Data synthesis employed comparative tabular analysis and narrative synthesis organised by pathway and evaluation criteria. No original experimental data were collected, and no statistical regression analyses were performed; all quantitative values represent synthesis of published literature.
Cost comparisons across pathways draw on studies conducted over different timeframes (2015–2023) and in different regional contexts, which may reduce the fairness and accuracy of direct comparisons. Readers should interpret cross-pathway cost comparisons with caution, as additional analysis controlling for time period, plant scale, and geographic context would be required to increase the accuracy of these comparisons.
Quality Assessment
Study quality was assessed based on: data transparency, peer review status (journal articles ranked higher than institutional reports), recentness (2020–2023 publications weighted more heavily for cost and efficiency data), and consistency with other sources. Studies with incomplete methodology descriptions or unverifiable data sources were excluded during the screening phase.
Results and Discussion
Technical Characteristics of Production Pathways
The three hydrogen production pathways differ fundamentally in their technical mechanisms, efficiency ranges, and environmental profiles, and are classified differently within the grey, blue, and green hydrogen framework. Understanding these technical foundations is essential not only for describing each pathway, but
for explaining why certain cost, efficiency, and environmental outcomes arise — and why specific regional conditions favour one pathway over another.
Steam Methane Reforming (Grey and Blue Hydrogen)
SMR currently accounts for over 50% of global hydrogen production, making it the most established method.13 Without CCS, SMR produces grey hydrogen; when integrated with CCS that captures up to 90% of CO2 emissions, it produces blue hydrogen.7 The process involves reacting methane with high-temperature steam (700–1,100°C) in the presence of nickel-based catalysts.14 The reaction proceeds in two stages: reforming (CH4 + H2O → CO + 3H2) and water-gas shift (CO + H2O → CO2 + H2), yielding four moles of hydrogen per mole of methane.15 Modern SMR plants achieve thermal efficiencies of 65–75% through heat recovery systems.16
The primary environmental challenge of SMR is its carbon intensity: approximately 9–10 kg CO2 per kilogram of H2 produced.1 CCS integration increases production costs by 20–30% and depends on the availability of suitable geological storage sites.7 SMR’s infrastructure requirements favour industrialised regions with established natural gas pipeline networks.15
Electrolysis Using Renewable Energy (Green Hydrogen)
Electrolysis produces green hydrogen by splitting water using electricity from renewable sources. When powered by renewables, lifecycle emissions are below 0.5 kg CO2/kg H2 — over 95% lower than conventional grey SMR.17 Three electrolyser types are in commercial or near-commercial use. AEL systems achieve 60–70% efficiency at current densities of 200–400 mA/cm².1813 PEM electrolysers achieve 70–85% efficiency at higher current densities up to 2,000 mA/cm², with rapid response capabilities suited to intermittent renewable integration.1719 SOE systems operate at 700–1,000°C with theoretical efficiencies exceeding 90%, but remain at the research stage due to material degradation challenges.20
The modular nature of electrolysis enables distributed production co-located with renewable generation sites, reducing transportation energy losses.10 Primary technical challenges include water purity requirements below 1 ∝S/cm conductivity21 and water availability, with approximately nine litres of purified water required per kilogram of H2 produced.21,22
Biomass Gasification (Carbon-Neutral Hydrogen)
Biomass gasification converts organic matter — agricultural residues, forestry waste, or municipal biomass — into hydrogen-rich syngas through thermochemical reactions at 700–1,200°C.5 The process involves four stages: drying (100–200°C), pyrolysis (200–700°C), oxidation (700–1,500°C), and reduction (800–1,000°C).23 System efficiencies range from 45–60%, with performance strongly influenced by feedstock moisture content, lignin composition, and ash characteristics.24
Biomass gasification achieves carbon-neutral production when sustainably sourced, because the CO2 released during conversion was originally absorbed during plant photosynthesis.5 Integration with CCS enables net-negative emissions.7 The main economic challenge lies in feedstock logistics: collection, drying, and transport can account for up to 40% of total production cost.21
| Process (H2 classification) | Efficiency (%) | CO2 emissions (kg/kg H2) | Maturity | Key technical limitations |
| SMR — Grey H21,25 | 65–7516 | 9–101 | Commercial25 | Catalyst degradation; CO2 emissions; high-temperature operation1,25 |
| SMR + CCS — Blue H27 | 60–707 | 0.9–1.0 after CCS7 | Commercial (with CCS)7 | Geological storage dependency; +20–30% cost7 |
| Electrolysis — Green H217 | 60–8517,25 | <0.517 | Rapidly scaling9 | High electricity demand; water purity requirements17,21 |
| Biomass gasification — Carbon-neutral H25 | 45–6024 | ~0 (sustainably sourced)5 | Pilot–commercial5 | Tar formation; feedstock variability; gas cleanup26,24 |
Table 1 | Summary of key technical parameters across the three production pathways. Data compiled from references Ishaq et al. 2022; Bhaskar et al. 2023; Carmo et al. 2013; Li et al. 2025; Xu & Froment 1989; Ptasinski et al. 2007; Hauch et al. 2020; Sánchez et al. 2020.
Economic Analysis and Cost-Efficiency Comparisons
Production costs vary significantly across pathways and are sensitive to feedstock prices, CAPEX, OPEX, and regional conditions. The LCOH — defined as the total lifetime cost of the production system divided by total hydrogen output over that lifetime27 — is the standard metric for cross-pathway comparison. These comparisons should be interpreted with care given different timeframes and regional assumptions across studies.
Cost Components and Current Economics
For SMR, feedstock (natural gas) accounts for approximately 45–75% of total LCOH.2 As of 2023, SMR LCOH ranges from $1.00–$2.00/kg H2 in regions with favourable natural gas pricing.2 It is important to note that these figures reflect best-case regional conditions; in many present-day contexts including U.S. conditions assessed by the Department of Energy, PEM electrolysis LCOH is typically reported at $5–$7/kg H2. The lower electrolysis cost figures cited here reflect best-case estimates from regions with $20–$30/MWh electricity at large-scale plant operation.9
For electrolysis, electricity costs represent 50–80% of total LCOH.9 Electrolyser CAPEX has fallen from $1,200–$1,500/kW in 2015 to $700/kW in 2023, with projections of $300–$400/kW by 2030.9 Projected 2030 LCOH for renewable electrolysis approaches $1.50/kg H2 under favourable conditions.9
Biomass gasification LCOH typically ranges from $2.00–$3.00/kg H2, with feedstock costs ($30–$100/ton) as the dominant factor.2,21 Hauling biomass beyond 50–100 km substantially increases feedstock costs due to low energy density.21
Illustrative Worked Cost Calculations
To clarify the cost structure of each pathway, simplified worked calculations for representative large-scale facilities are provided below. These are illustrative only, based on best-case literature values.
SMR — Grey hydrogen
Assumptions: 1,000 kg H2/day; 90% capacity factor; natural gas at s4/GJ (lower heating value (LHV) basis); thermal efficiency = 65%.16
Natural gas consumption = (120 MJ/kg H ) / 0.65
  185 MJ/kg H
Feedstock cost = 185 MJ/kg H  $4/GJ
$4/GJ  1,000 MJ/GJ = $0.74/kg H
CAPEX annualisation $0.20/kg H (at $500/kW, 20-yr life, 8% discount rate)
OPEX $0.15/kg H
Total LCOH $0.74 + $0.20 + $0.15 = $1.09/kg H
This aligns with the published range of $1.00–$2.00/kg H for gas-rich regions2
Electrolysis — Green hydrogen (PEM)
Assumptions: 10 MW plant; 45% capacity factor; renewable electricity at $25/MWh; PEM energy consumption = 55 kWh/kg H2.17,9
Electricity cost = 55 kWh/kg H $0.025/kWh = $1.38/kg H
CAPEX annualisation $0.80/kg H (at $700/kW, 20-yr life, 8% discount rate, 45% CF)
OPEX $0.20/kg H
Total LCOH $1.38 + $0.80 + $0.20 = $2.38/kg H
This represents a best-case estimate; under average conditions LCOH would be substantially higher, consistent with  7/kg H2 in many present-day assessments.9
Biomass gasification
Assumptions: 50 t/day dry biomass; feedstock cost = $50/t; H2 yield = 60 kg H2/t biomass (at 50% efficiency); transport within 50 km radius.2,24,21
Feedstock cost = $50/t 60 kg H/t = $0.83/kg H
Transport and preprocessing $0.50/kg H (within 50 km)
CAPEX annualisation $0.60/kg H
OPEX $0.25/kg H
Total LCOH $0.83 + $0.50 + $0.60 + $0.25 = $2.18/kg H
This falls within the published range of $2.00–$3.00/kg H .2,21

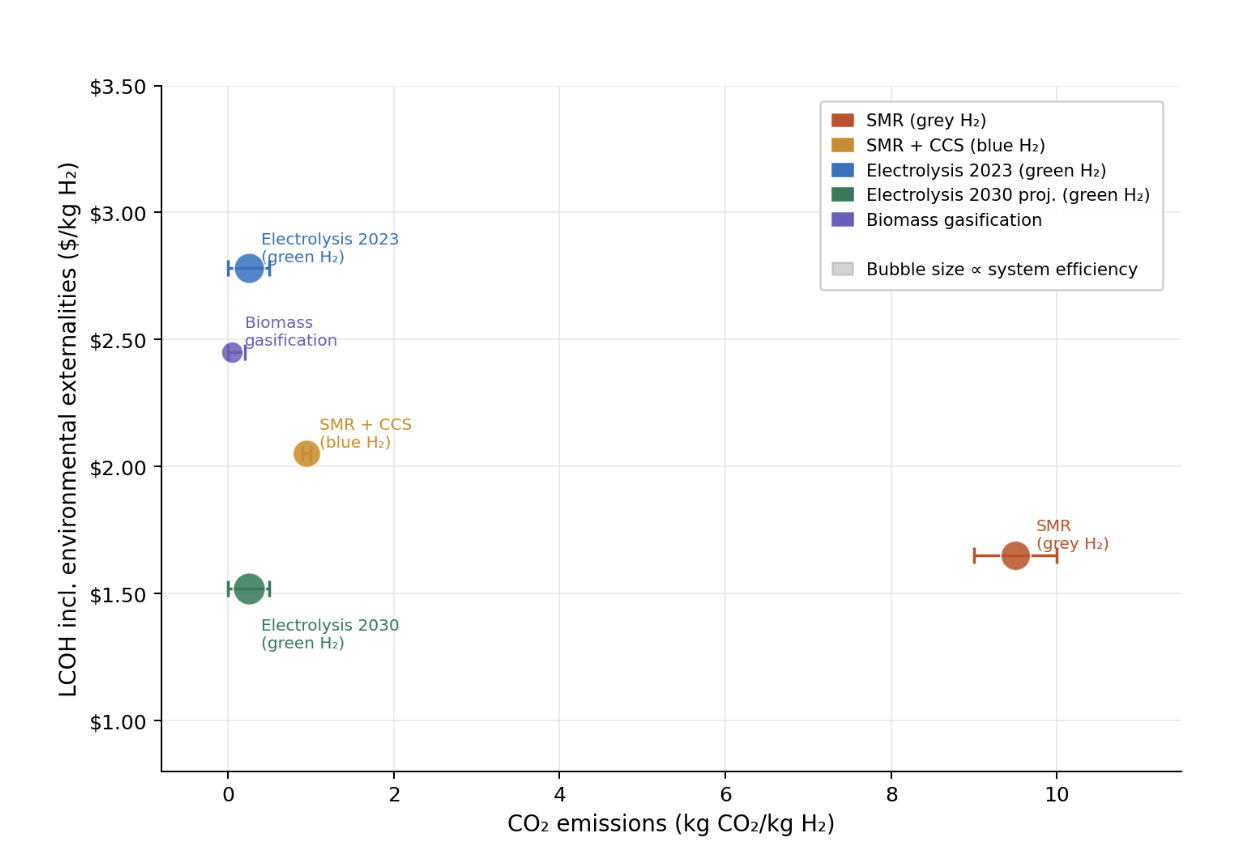
Environmental Cost Internalisation
When carbon pricing of $50–$100/ton CO2 is applied, the effective costs shift substantially.12,27 For conventional grey SMR emitting 9–10 kg CO2/kg H2, carbon costs add  0.85/kg H2, raising total LCOH to
  2.85/kg H2.1 For blue SMR with CCS capturing 90% of emissions, the environmental premium falls to
  0.10/kg H2.7 Renewable electrolysis incurs negligible carbon costs (<$0.05/kg H2).12 Biomass gasification may receive carbon credits, yielding a negative environmental cost premium of up to −$0.20/kg H2.12
| Process | LCOH ($/kg H2) | Efficiency (%) | Env. cost premium ($/kg H2) | Total cost with externalities ($/kg H2) |
| SMR — Grey H21,2 | $1.00–$2.002 | 65–7516 | +$0.45–$0.851 | $1.45–$2.851 |
| SMR + CCS — Blue H27 | $1.50–$2.507 | 60–707 | +$0.05–$0.107 | $1.55–$2.607 |
| Electrolysis 2023 — Green H29 | $2.50–$3.009 | 60–8529,13 | <$0.0512 | $2.50–$3.0512 |
| Electrolysis 2030 proj. — Green H29 | ~$1.509 | 70–8517 | <$0.0512 | $1.50–$1.5512 |
| Biomass gasification2,21 | $2.00–$3.002,21 | 45–6024 | −$0.20 to +$0.1012 | $1.80–$3.1012 |
*Lower-bound estimate applicable to optimal renewable conditions ($20–$30/MWh electricity); many present-day PEM systems achieve $5–$7/kg H2.30
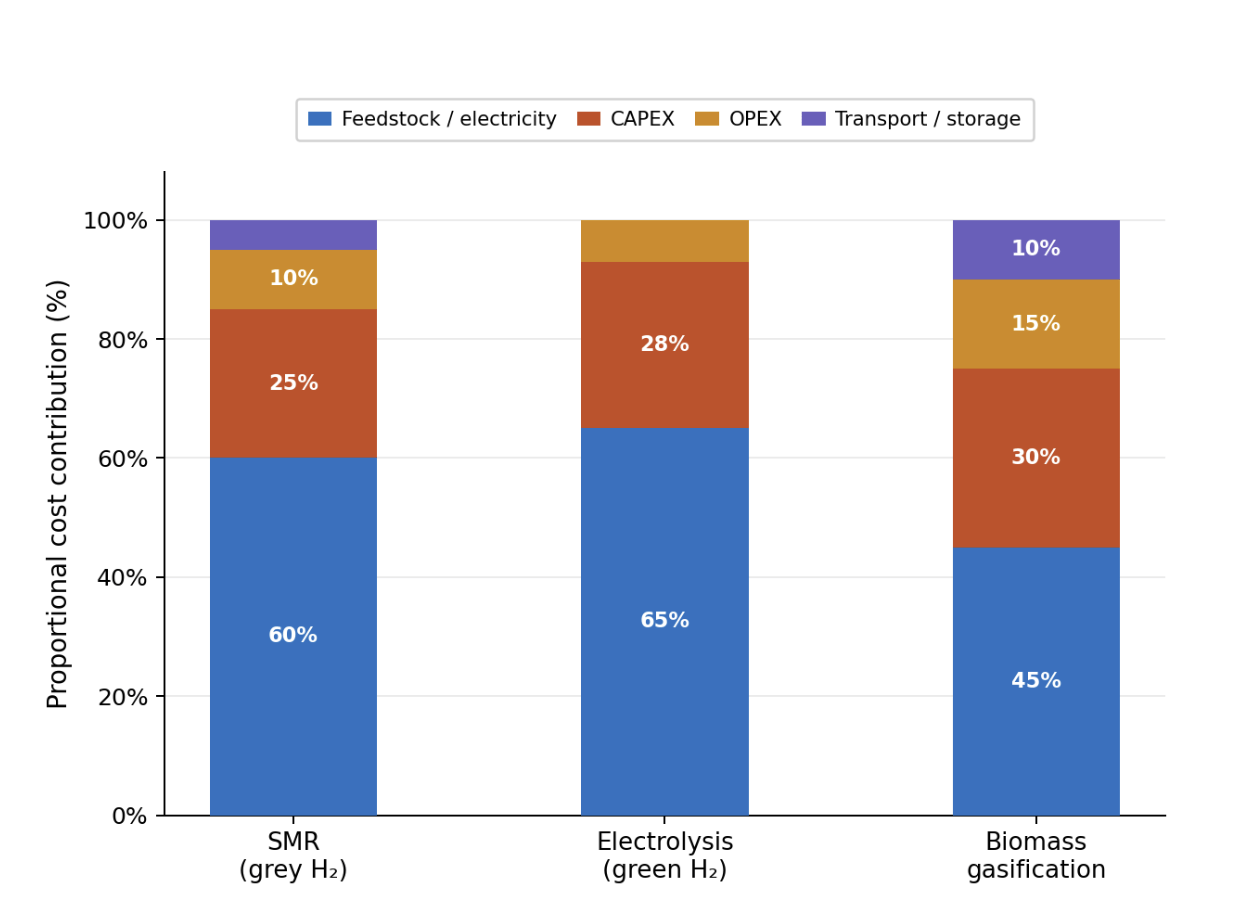
For SMR, feedstock represents the largest share at approximately 60%, while for electrolysis, electricity costs dominate at 65%. Biomass gasification shows a more balanced distribution with significant feedstock and transport components. These data demonstrate that when environmental costs are internalised, renewable electrolysis and biomass gasification become economically competitive with fossil-based hydrogen under projected 2030 conditions.12 Other factors — labour costs, maintenance, financing terms, and local market conditions — also influence total LCOH but vary substantially by project and location, making them difficult to generalise across pathways in this comparative review.
Lifecycle Assessment Considerations
A comprehensive comparison requires consideration of lifecycle environmental impacts beyond direct operational CO2 emissions. Lifecycle assessment (LCA) accounts for emissions and resource consumption across the full supply chain, including raw material extraction, equipment manufacturing, plant operation, and decommissioning.11
For grey SMR, upstream methane leakage from natural gas extraction and pipeline distribution — estimated at 1–3% of throughput — can substantially increase lifecycle carbon intensity beyond the direct value of 9–10 kg CO2/kg H2.1 For green electrolysis, when powered entirely by renewables, lifecycle emissions remain well below 0.5 kg CO2/kg H2 as embedded manufacturing emissions from renewable equipment are spread over multi-decade operational lifetimes.17 For biomass gasification, the lifecycle assessment is particularly sensitive to land use change, feedstock transport emissions, and CCS integration.5 A systematic LCA framework across all three pathways under consistent boundary conditions is an important area for future research.
Technical Factors Affecting Cost-Efficiency
Catalyst composition and operating conditions are critical determinants of SMR performance.31 Nickel-based catalysts achieve optimal performance at steam-to-carbon ratios of 2.5–3.0, with 72% thermal efficiency at 850°C.16 Sulfur contamination above 0.1 ppm reduces catalyst activity by 40% within 100 hours through chemisorption on nickel active sites.31
For PEM electrolysis, overpotential losses increase quadratically above 1.5 A/cm², reducing efficiency from 82% to 68% due to mass transport limitations.32 Reducing Nafion membrane thickness from 180 ∝m to 50 ∝m decreases ohmic resistance by 65%, improving efficiency by 8 percentage points.17 Membranes below 25 ∝m experience pinhole formation after 2,000 hours, establishing a practical minimum thickness.17 High-temperature PEM systems at 120–180°C achieve 90% efficiency with improved carbon monoxide tolerance, though material stability beyond 5,000 hours remains a challenge.33
In biomass gasification, feedstock lignin content strongly influences hydrogen yield: materials with lignin below 20% achieve 45–50 vol% H2 in syngas, compared to 30–35 vol% for high-lignin wood residues.26 Feedstock moisture above 30% reduces cold gas efficiency from 68% to 42%, with approximately 2.5 MJ/kg additional energy per 10% moisture increase.24 Controlled steam injection at steam-to-biomass ratios of 0.6–1.0 improves hydrogen yield by 15–20% compared to air gasification.26
Regional Energy Consumption Patterns
Energy consumption for hydrogen production varies substantially by renewable energy source and geographic region. The analytical driver of these differences is straightforward: regions with the highest renewable capacity factors, lowest electricity prices, and most direct access to water enable the lowest LCOH for green hydrogen, while regions with cheap natural gas retain a cost advantage for grey hydrogen.
Energy Consumption by Renewable Source
Hydroelectric-powered electrolysis achieves the lowest energy consumption because hydroelectric facilities operate at capacity factors of 40–70%, enabling near-continuous electrolyser operation at rated efficiency.3 Solar photovoltaic systems achieve capacity factors of only 15–35%, creating efficiency penalties from electrolyser ramping losses, resulting in energy consumption of 55–65 kWh/kg H2.34 Wind-powered systems achieve intermediate performance with capacity factors of 25–50% (offshore up to 60%), averaging 52–58 kWh/kg H2.2 Hybrid systems combining solar, wind, and grid connections achieve capacity factors of 60–80%, reducing energy consumption toward 50–56 kWh/kg H2.14
| Region | Primary renewable source | Energy consumption (kWh/kg H2) | Capacity factor (%) | Infrastructure energy penalty (kWh/kg H2) |
| Norway/Iceland3 | Hydroelectric3 | 48–523 | 50–703 | 2–410 |
| Chile (Atacama)3 | Solar + Wind3 | 50–553 | 35–453 | 4–610 |
| Australia (NW)3 | Solar3 | 52–583 | 25–3534 | 5–810,22 |
| Saudi Arabia3 | Solar3 | 54–603 | 28–3834 | 3–522 |
| Europe (North Sea)3 | Offshore Wind3 | 52–583 | 45–5514 | 3–510 |
| Europe (Germany)3 | Wind + Solar + Grid3 | 55–703 | 25–4014 | 4–810 |
| Canada (Quebec)3 | Hydroelectric3 | 48–523 | 50–653 | 6–1010 |
| Japan/S. Korea*3 | Import-dependent3 | 65–80*3 | N/A | 10–2010,11 |
*Includes import chain energy consumption. Infrastructure penalties include water treatment, compression, and distribution.

Norway and Iceland achieve the lowest energy consumption (48–52 kWh/kg H2) because high-capacity-factor hydroelectric resources enable near-continuous electrolyser operation, minimising start-stop efficiency losses.3 Chile’s Atacama Desert achieves near-equivalent performance (50–55 kWh/kg H2) through the combination of the world’s highest solar irradiance and strong coastal winds, with electricity costs that have fallen to  25/MWh for solar.3,12 Germany and central Europe show higher energy consumption (55–70 kWh/kg H2) because lower renewable capacity factors and grid-mix dependence increase average electrolyser ramping losses.3 Japan and South Korea face the highest domestic production costs (65–80 kWh/kg H2) because limited land constrains both renewable deployment and electrolysis scale, making hydrogen import from renewable-rich regions more favourable.3,11 For SMR-based grey hydrogen, regional favourability is determined by natural gas infrastructure rather than renewable resources.10
Emerging Technologies: Photoelectrochemical Water Splitting and Biological Hydrogen Production
PEC water splitting uses semiconductor photoelectrodes to split water directly using solar energy. Current laboratory-scale solar-to-hydrogen efficiencies are below 10%, and no commercial systems exist.11 Key barriers include rapid photoelectrode degradation in aqueous environments, high semiconductor material costs, and the difficulty of scaling from laboratory cells to industrial systems. The IEA classifies PEC at technological readiness level (TRL) 3–4, making systematic cost and efficiency comparison with commercial pathways premature.11
Biological hydrogen production — including biophotolysis using microalgae or cyanobacteria, and fermentation-based methods — currently achieves solar-to-hydrogen conversion efficiencies well below 1%, and no commercial applications exist.11 While both PEC and biological methods hold long-term promise, the scale of development required before they can compete with established pathways means they are appropriately excluded from this comparative analysis. Future reviews should revisit these pathways as TRL advances.
Limitations
This review has several limitations. Policy and regulatory aspects are not addressed, despite being central to hydrogen deployment feasibility; policy analysis would require extensive dedicated treatment and is considered out of scope for this technical review.
The review relies on published data that may not fully reflect real-world operational variability. Cost and efficiency figures are drawn from studies with different timeframes, plant scales, and regional contexts; as noted in the Methodology, additional controlled analysis would be required for fair direct cross-pathway comparison. Cost figures should be understood as lower-bound estimates applicable to optimal conditions.
Technological maturity levels differ substantially across pathways — from commercial-scale SMR to rapidly scaling electrolysis and pilot-stage biomass gasification — introducing significant uncertainty in performance comparisons. Solid oxide electrolyser data are largely from small-scale research systems. Future scalability challenges include material degradation and manufacturing scale-up for SOE systems, and feedstock supply chain logistics for biomass gasification at regional scale.
Conclusions and Future Work
This comparative review evaluated three primary hydrogen production pathways across technical, economic, environmental, and geographic dimensions. The synthesis of peer-reviewed literature data from 2015–2023 reveals distinct trade-offs between cost-effectiveness, environmental sustainability, and regional applicability.
Grey SMR remains the most technologically mature pathway, achieving thermal efficiencies of 65–75% and LCOH of  2.00/kg H2 in natural gas-rich regions.1,2 Its carbon intensity of 9–10 kg CO2/kg H2 presents a fundamental barrier to decarbonisation goals, but blue SMR with CCS mitigates 90% of these emissions at a 20–30% cost premium.7 This pathway is most viable as a near-to-medium-term transitional technology in industrialised regions with established natural gas infrastructure and access to geological CCS storage — North America, the Middle East, and parts of Europe. Green hydrogen from renewable electrolysis is the cleanest long-term pathway, with lifecycle emissions below 0.5 kg CO2/kg H2.17 Current best-case LCOH of $2.50–$3.00/kg H2 is declining rapidly toward ~$1.50/kg H2 by 2030 in optimal regions.9 This pathway is most viable in regions with exceptional renewable resources: hydroelectric capacity in Norway, Iceland, and Canada (48–52 kWh/kg H2), and solar or wind resources in Chile, Australia, and Saudi Arabia (50–60 kWh/kg H2).3 For resource-constrained regions such as Japan and South Korea, domestic green hydrogen carries an energy penalty of 65–80 kWh/kg H2,3 making hydrogen import strategies more economically viable.
Carbon-neutral hydrogen from biomass gasification occupies a geographically specific niche, with LCOH of  3.00/kg H2 and efficiencies of 45–60%.2,24 It is most viable in regions with abundant agricultural or forestry waste streams and carbon credit frameworks, particularly where feedstock transport distances remain below 50–100 km.21
The most significant cross-cutting finding is the economic convergence of all pathways when environmental costs are internalised through carbon pricing. The three pathways are complementary rather than competing: grey and blue SMR serve as the near-term bridge, green electrolysis emerges as the dominant long-term pathway in renewable-rich regions, and biomass gasification provides a sustainable regional complement.
Key recommendations for policymakers and industry stakeholders include:
• Implement carbon pricing ( 100/ton CO2) to accelerate economic parity between green and grey hydrogen
• Prioritise renewable electrolysis investment in regions with exceptional solar, wind, or hydroelectric resources
• Maintain SMR with CCS as transitional capacity in natural gas-rich, CCS-suitable regions
• Support biomass gasification in agricultural regions with waste stream availability and carbon credit frameworks
• Invest in international hydrogen trade infrastructure to enable production concentration in optimal locations
• Fund SOE commercialisation research given theoretical efficiencies exceeding 90%
• Develop standardised LCA frameworks to enable rigorous cross-pathway lifecycle comparisons
Supplementary Information
References
- Ishaq, H.; Dincer, I.; Crawford, C. A Review on Hydrogen Production and Utilization: Challenges and Opportunities. Int. J. Hydrogen Energy 2022, 47 (62), 26238–26264. https://doi.org/10.1016/j.ijhydene.2021.11.149 [↩] [↩] [↩] [↩] [↩] [↩] [↩] [↩] [↩] [↩] [↩]
- Nikolaidis, P.; Poullikkas, A. A Comparative Overview of Hydrogen Production Processes. Renew. Sustain. Energy Rev. 2017, 67, 597–611. https://doi.org/10.1016/j.rser.2016.09.044 [↩] [↩] [↩] [↩] [↩] [↩] [↩] [↩] [↩] [↩] [↩] [↩] [↩] [↩] [↩] [↩] [↩]
- Younas, M.; Shafique, S.; Hafeez, A.; Javed, F.; Rehman, F. An Overview of Hydrogen Production: Current Status, Potential, and Challenges. Fuel 2022, 316, 123317. https://doi.org/10.1016/j.fuel.2022.123317 [↩] [↩] [↩] [↩] [↩] [↩] [↩] [↩] [↩] [↩] [↩] [↩] [↩] [↩] [↩] [↩] [↩] [↩] [↩] [↩] [↩] [↩] [↩] [↩] [↩] [↩] [↩] [↩] [↩] [↩] [↩] [↩] [↩] [↩] [↩]
- Kayfeci, M.; Keçeba, A.; Bayat, M. Hydrogen Production. In Solar Hydrogen Production: Processes, Systems and Technologies; Calise, F., D’Accadia, M. D., Santarelli, M., Lanzini, A., Ferrero, D., Eds.; Academic Press: London, 2019; pp 45–83. https://doi.org/10.1016/B978-0-12-814853-2.00003-5 [↩]
- Li, Y.; Pang, Y.; Zheng, Y.; Huang, Y.; Lu, H.; Song, Y.; Huhetaoli. Biomass Gasification in Molten Salts for Syngas Production: A Review. J. Energy Inst. 2025, 112, 101476. https://doi.org/10.1016/j.joei.2023.101476 [↩] [↩] [↩] [↩] [↩] [↩] [↩] [↩] [↩] [↩]
- Aasberg-Petersen, K.; Dybkjær, I.; Ovesen, C. V.; Schjødt, N. C.; Sehested, J.; Thomsen, S. G. Natural Gas to Synthesis Gas — Catalysts and Catalytic Processes. J. Nat. Gas Sci. Eng. 2011, 3 (2), 423–459. https://doi.org/10.1016/j.jngse.2011.03.004 [↩]
- Bhaskar, A.; Abhishek, R.; Assadi, M.; Somehesaraei, H. N. Decarbonizing Primary Steel Production: Techno-Economic Assessment of a Hydrogen Based Green Steel Production Plant in Norway. J. Clean. Prod. 2022, 350, 131339. https://doi.org/10.1016/j.jclepro.2022.131339 [↩] [↩] [↩] [↩] [↩] [↩] [↩] [↩] [↩] [↩] [↩] [↩] [↩] [↩] [↩] [↩] [↩] [↩] [↩]
- Carmo, M.; Fritz, D. L.; Mergel, J.; Stolten, D. A Comprehensive Review on PEM Water Electrolysis. Int. J. Hydrogen Energy 2013, 38 (12), 4901–4934. https://doi.org/10.1016/j.ijhydene.2013.01.151 [↩]
- IRENA. Green Hydrogen Cost Reduction: Scaling up Electrolysers to Meet the 1.5°C Climate Goal; International Renewable Energy Agency: Abu Dhabi, 2020. https://www.irena.org/publications/2020/Dec/Green-hydrogen-cost-reduction [↩] [↩] [↩] [↩] [↩] [↩] [↩] [↩] [↩] [↩] [↩] [↩] [↩] [↩] [↩] [↩]
- Dash, S. K.; Chakraborty, S.; Elangovan, D. A Brief Review of Hydrogen Production Methods and Their Challenges. Energies 2023, 16 (3), 1141. https://doi.org/10.3390/en16031141 [↩] [↩] [↩] [↩] [↩] [↩] [↩] [↩] [↩] [↩] [↩]
- IEA. The Future of Hydrogen: Seizing Today’s Opportunities; International Energy Agency: Paris, 2019. https://doi.org/10.1787/1e0514c4-en [↩] [↩] [↩] [↩] [↩] [↩] [↩] [↩]
- IEA. Global Hydrogen Review 2023; International Energy Agency: Paris, 2023. https://doi.org/10.1787/4a253952-en [↩] [↩] [↩] [↩] [↩] [↩] [↩] [↩] [↩] [↩] [↩] [↩]
- Sánchez, M.; Amares, E.; Rodríguez, L.; Clemente-Jul, C. Semi-Empirical Model and Experimental Validation for the Performance Evaluation of a 15 kW Alkaline Water Electrolyzer. Int. J. Hydrogen Energy 2018, 43 (45), 20332–20345. https://doi.org/10.1016/j.ijhydene.2018.09.029 [↩] [↩] [↩]
- Guandalini, G.; Campanari, S.; Romano, M. C. Power-to-Gas Plants and Gas Turbines for Improved Wind Energy Dispatchability: Energy and Economic Assessment. Appl. Energy 2015, 147, 117–130. [↩] [↩] [↩] [↩] [↩]
- Guerra, O. J.; Eichman, J.; Kurtz, J.; Hodge, B.-M. Cost Competitiveness of Electrolytic Hydrogen. Joule 2019, 3 (10), 2425–2443. https://doi.org/10.1016/j.joule.2019.07.006 [↩] [↩] [↩]
- Xu, J.; Froment, G. F. Methane Steam Reforming, Methanation and Water-Gas Shift: I. Intrinsic Kinetics. AIChE J. 1989, 35 (1), 88–96. https://doi.org/10.1002/aic.690350109 [↩] [↩] [↩] [↩] [↩]
- Carmo, M.; Fritz, D. L.; Mergel, J.; Stolten, D. A Comprehensive Review on PEM Water Electrolysis. Int. J. Hydrogen Energy 2013, 38 (12), 4901–4934. https://doi.org/10.1016/j.ijhydene.2013.01.151 [↩] [↩] [↩] [↩] [↩] [↩] [↩] [↩] [↩] [↩] [↩] [↩] [↩]
- Ito, H.; Maeda, T.; Nakano, A.; Hwang, C. M.; Ishida, M.; Kato, A.; Yoshida, T. Experimental Study on Porous Current Collectors of PEM Electrolyzers. Int. J. Hydrogen Energy 2012, 37 (9), 7418–7428. https://doi.org/10.1016/j.ijhydene.2012.01.095 [↩]
- Mohammadi, A.; Mehrpooya, M. A Comprehensive Review on Coupling Different Types of Electrolyzer to Renewable Energy Sources. Energy 2018, 158, 632–655. https://doi.org/10.1016/j.energy.2018.06.073 [↩]
- Hauch, A.; Küngas, R.; Blennow, P.; Hansen, A. B.; Hansen, J. B.; Mathiesen, B. V.; Mogensen, M. B. Recent Advances in Solid Oxide Cell Technology for Electrolysis. Science 2020, 370 (6513), eaba6118. https://doi.org/10.1126/science.aba6118 [↩]
- Voutchkov, N. Energy Use for Membrane Seawater Desalination — Current Status and Trends. Desalination 2018, 431, 2–14. https://doi.org/10.1016/j.desal.2017.10.033 [↩] [↩] [↩] [↩] [↩] [↩] [↩] [↩] [↩] [↩] [↩] [↩]
- Gude, V. G. Desalination and Sustainability — An Appraisal and Current Perspective. Water Res. 2016, 89, 87–106. https://doi.org/10.1016/j.watres.2015.11.012 [↩] [↩] [↩] [↩]
- Basu, P. Biomass Gasification and Pyrolysis: Practical Design and Theory; Academic Press: Burlington, MA, 2010. https://doi.org/10.1016/B978-0-12-374988-8.00009-8 [↩]
- Ptasinski, K. J.; Prins, M. J.; Pierik, A. Exergetic Evaluation of Biomass Gasification. Energy 2007, 32 (4), 568–574. https://doi.org/10.1016/j.energy.2006.06.024 [↩] [↩] [↩] [↩] [↩] [↩] [↩] [↩]
- Sánchez, M.; Amares, E.; Rodríguez, L.; Clemente-Jul, C. Semi-empirical model and experimental validation for the performance evaluation of a 15 kW alkaline water electrolyzer. Int. J. Hydrogen Energy. Vol. 43, pg. 20332–20345, 2018, https://doi.org/10.1016/j.ijhydene.2018.09.029 [↩] [↩] [↩] [↩]
- Rapagnà, S.; Jand, N.; Kiennemann, A.; Foscolo, P. U. Steam-gasification of biomass in a fluidised-bed of olivine particles. Biomass Bioenergy. Vol. 19, pg. 187–197, 2000, https://doi.org/10.1016/S0961-9534(00)00031-3 [↩] [↩] [↩]
- Bloomberg NEF. Hydrogen Economy Outlook: Key Messages; Bloomberg New Energy Finance: New York, 2020. [↩] [↩] [↩] [↩] [↩] [↩] [↩]
- Ishaq, H.; Dincer, I.; Crawford, C. A Review on Hydrogen Production and Utilization: Challenges and Opportunities. Int. J. Hydrogen Energy 2022, 47 (62), 26238–26264. https://doi.org/10.1016/j.ijhydene.2021.11.149 [↩] [↩]
- Carmo, M.; Fritz, D. L.; Mergel, J.; Stolten, D. A comprehensive review on PEM water electrolysis. Int. J. Hydrogen Energy. Vol. 38, pg. 4901–4934, 2013, https://doi.org/10.1016/j.ijhydene.2013.01.151 [↩]
- IRENA. Green Hydrogen Cost Reduction: Scaling up Electrolysers to Meet the 1.5°C Climate Goal; International Renewable Energy Agency: Abu Dhabi, 2020. https://www.irena.org/publications/2020/Dec/Green-hydrogen-cost-reduction [↩]
- Rostrup-Nielsen, J. R.; Sehested, J. Whisker Carbon Revisited. Stud. Surf. Sci. Catal. 2002, 139, 1–12. https://doi.org/10.1016/S0167-2991(02)80232-X [↩] [↩]
- Grigoriev, S. A.; Millet, P.; Fateev, V. N. Evaluation of Carbon-Supported Pt and Pd Nanoparticles for the Hydrogen Evolution Reaction in PEM Water Electrolysers. J. Power Sources 2008, 177 (2), 281–285. https://doi.org/10.1016/j.jpowsour.2007.11.072 [↩]
- Pina, A.; Ferrão, P.; Fournier, J.; Lacarrière, B.; Le Corre, O. High-Temperature Electrolysis: Stacks, Modules, Systems. In Hydrogen Economy: Supply Chain, Life Cycle Analysis and Energy Transition for Sustainability; Scipioni, A., Manzardo, A., Ren, J., Eds.; Academic Press: London, 2017; pp 325–342. https://doi.org/10.1016/B978-0-12-811132-1.00012-7 [↩]
- Tabbi, M.; Nemer, M.; Fraisse, G. Numerical Simulation and Optimization of Photovoltaic Thermal Solar Collectors. Energy Procedia 2016, 95, 504–511. https://doi.org/10.1016/j.egypro.2016.09.075 [↩] [↩] [↩] [↩]
- Younas, M.; Shafique, S.; Hafeez, A.; Javed, F.; Rehman, F. An Overview of
Hydrogen Production: Current Status, Potential, and Challenges. Fuel 2022, 316, 123317. https://doi.org/10.1016/j.fuel.2022.123317 [↩]


