
Abstract
Automated detection of Parkinson’s Disease (PD) from speech presents a low-cost, non-invasive screening tool, but its reliability across languages and recording conditions is uncertain. This study evaluated whether speech-based PD detection could transfer across diverse datasets that differ in language, recording conditions, and tasks under limited exposure to the target dataset. We investigated model performance in-dataset and in cross-dataset zero-shot testing, whether adding a small, speaker-balanced fraction of the target dataset during training improved performance, and if fairness (ΔFNRF-M, difference in the False Negative Rates between female and male speakers) depended on training alone or on threshold selection. Models were developed using public datasets, including NeuroVoz (Castilian Spanish), EWA-DB (Slovak), IPVS (Italian), MDVR-KCL (English-UK), and English-US sustained “Ah” sounds, with varied speech tasks and recording environments. A frozen Wav2Vec2 backbone with two task-specific classification heads (vowel and read/other) was evaluated using AUROC (Area Under the Receiver Operating Characteristic Curve), sex-stratified FNR, and ablation analyses. The results showed that while in-dataset testing yielded reliable performance (e.g., AUROC ≈ 0.73 for D2), zero-shot cross-dataset testing did not. Further, combining different datasets into a multilingual model was inadequate (e.g., AUROC ≈ 0.41 for multilingual model transfer to D2), but including a small portion of target data led to performance improvements (achieving AUROC ≈ 0.67). Overall, these findings suggested that speech-based PD detection may transfer better across datasets using limited, carefully sampled, target data. The results of this study should be interpreted as investigative evidence rather than demonstration of clinical readiness.
Keywords: Parkinson’s Disease, Speech, Multilingual, Cross-dataset transfer, Fairness
Introduction
Parkinson’s Disease (PD) has a quantifiable impact on human speech. This has led to extensive research on speech-based early detection methods. Recent Artificial Intelligence (AI) advances have been applied in the automated detection of PD from speech signals1. Prior studies illustrate measurable changes in articulation, phonation, prosody, and timing, thus reinforcing that speech patterns reflect underlying neurological functions in PD2,3. Research based on classical Machine Learning (ML) used pitch and spectral features, while other studies employed Deep Learning (DL) models with the features learned directly from speech recordings to detect PD1,4,5. Prior work has demonstrated that the choice of speech task is important for PD detection. Studies have used various speech tasks including sustained phonation (vowels) and read speech2,6, as well as spontaneous speech, monologues, and rapid syllable repetition2,7, emphasizing that the signs of PD are not limited to a single speaking condition.
Studies have shown that speech-based models can reliably differentiate PD from healthy speakers when training and testing are performed within the same speech dataset7. However, performance can degrade when models trained on one dataset are tested on a different dataset8. PD speech datasets can vary in language, recording environments, speech tasks, and data collection procedures9. Cross-language PD detection using combined acoustic and linguistic speech features has shown promising results, but its model performance can be affected by speech length and cohort composition10. Multilingual detection using sustained vowel phonations from different languages has shown feasibility, but that evidence remains limited to vowel-based tasks11. Thus, although cross-language testing with sustained-vowel recordings has shown some generalizability, the differences in the recording conditions can still affect performance12. In addition, studies show that model interpretability still remains an important concern for clinical adoption4.
Given these challenges in language variation, task dependence, and model insight, the present study evaluated the cross-dataset transfer performance of speech-based PD models, while also examining demographic fairness and interpretability. The approach of utilizing task-specific classification heads in the present study was inspired in part by prior work that utilized separate heads for diadochokinetic and continuous speech13. However, the present study used a simpler configuration with a frozen Wav2Vec 2.0 (“Wav2Vec2”) backbone and two small task-specific classification heads, rather than introducing a new bilingual dual-head architecture. This study utilized multiple public speech datasets including NeuroVoz (Castilian Spanish)14,15, EWA-DB (Slovak)16,17, IPVS (Italian)18,19, MDVR-KCL (English-UK)20, and English-US sustained “Ah” sounds21,22. These datasets differed in languages, accents, speech tasks, and recording environments. These differences represented a form of distribution shift across the datasets that included variations in language, recording conditions, and speech tasks. This study did not isolate the contributing sources of this shift. Rather, it tested the combined effect of these differences on model performance using the following three testable hypotheses:
- H1: Model performance will be lower with cross-dataset zero-shot testing when compared to in-dataset testing,
- H2: Adding a small speaker-balanced portion of the target dataset to the multilingual model during training will improve its cross-dataset transfer performance, and
- H3: Fairness, evaluated with ΔFNRF-M, will depend on both the training data and the selected threshold.
The main contributions of this study can be divided into three primary focus areas. First, we showed that models trained on one dataset transferred poorly to other target domains, thus highlighting the limitations of cross-dataset transfer. Second, we illustrated a practical strategy in which collecting a small amount of carefully planned speech data from the target domain could meaningfully improve model performance. Finally, by examining fairness via differences in sex-stratified false negative rates, we demonstrated that operational choices made after model training, such as the selection of a decision threshold, can affect who gets overlooked or who may be falsely screened as PD-positive. These contributions encourage careful, ethical future research in the field of speech-based PD screening, but do not claim clinical diagnosis.
Methods
Data Collection and Preprocessing
Datasets
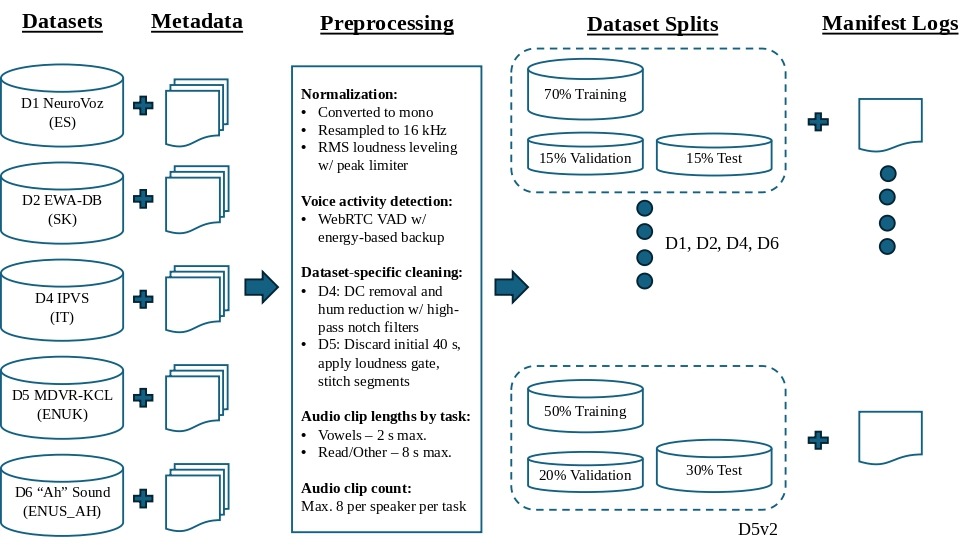
Speech data were obtained from publicly available speech datasets, representing a mixture of different languages and accents. These datasets included recordings of vowels (sustained phonation), read speech, and spontaneous speech, and were collected in varied recording conditions, ranging from a laboratory microphone to telephonic conversations, from Healthy Control (HC) and PD speakers. As seen in Figure 1, preprocessing of all the datasets followed consistent settings: all audio was converted to mono, resampled to 16 kHz sampling rate, and leveled to similar loudness using Root Mean Square (RMS)-based normalization with a set peak limit to prevent audio clipping. The preprocessing module then detected the speech regions with voice activity detection using Google’s WebRTC VAD and a loudness/energy-based backup. An important design choice was to create a maximum of one output audio clip per original source file, while permitting speakers to have multiple clips. This was done in order to ensure consistency across datasets by reducing the overrepresentation of source files with longer or cleaner recordings. The manifest logs were built by performing speaker-based training, validation, and test splits such that the same speaker never appeared in multiple splits. All the datasets, which we identified as D1, D2, D4, D5, and D6 (Table 1), were initially divided into 70% training, 15% validation, and 15% test splits. However, when D5 was utilized as the target dataset for the monolingual and zero-shot test runs, we considered that the speaker count of its test split could potentially be increased to make the testing runs reliable. Then, D5 was re-split into 50% training, 20% validation, and 30% test speakers (viz. “D5v2”). A Turkish language PD dataset23,24, which we originally identified as “D3”, was downloaded from the University of California, Irvine (UCI) Machine Learning Repository but not used as it contained only pre-extracted speech features, not actual audio recordings for our purpose.
| Dataset Identifier | Dataset Name | Language | Acronym Used | Metadata Format | Contents |
|---|---|---|---|---|---|
| D1 | NeuroVoz | Castilian Spanish | ES | CSV | HC/PD clips: vowel + read/other. |
| D2 | EWA-DB | Slovak | SK | TSV | HC/PD/Alzheimer’s Disease (AD)/AD-PD clips: vowel + read/other. Only HC & PD clips were used. |
| D4 | IPVS | Italian | IT | Excel | Young HC/Elderly HC/PD clips: vowel + read/other. |
| D5 | MDVR-KCL | English (UK) | EN, ENUK | N/A | HC/PD clips: read/other only. |
| D6 | “Ah” Sound | (sustained ‘ah’; origin: US) | EN, ENUS_AH | Excel | HC/PD clips: vowel only. |
| D7 | Base Multilingual | Multilingual by construction | D7 Base | None (Derived) | HC/PD clips merged from D1 + D4 + D5v2 + D6. |
Ethical Statement
This study utilized previously collected, publicly available speech datasets released by their respective owners for the purpose of conducting research. No new recordings were made, and no human participants were recruited, so Institutional Review Board (IRB) approval was not required. In all the datasets, personally identifiable information was already removed prior to release for use. Analyses were only conducted on anonymized speech identifiers, diagnosis labels (HC or PD), and normalized demographic attributes (such as sex) for the sole purpose of conducting research. The speech models and analyses are not intended for clinical diagnosis or for medical decision-making. For real-world applications, additional clinical validation and ethical oversight would be necessary that is beyond the scope of this study.
Data Preprocessing
During the preprocessing of every audio clip, vowel (sustained phonation) clips produced a short clip (maximum of 2 s) taken from the center of the best-spoken portion. Reading or spontaneous clips (viz. “read/other”) produced longer clips from the start of the best-spoken portion and maintained the actual duration with no artificial padding (maximum of 8 s). Dataset D1 inferred the task-type from the source audio filename. Dataset D2 filtered the recordings using metadata tables and limited the count to a maximum of 8 clips per speaker per task. Due to its poor audio quality, an additional cleaning step was applied for dataset D4 that included DC removal with a high-pass filter at 70 Hz, and hum reduction with notch filters centered at 50 Hz and its harmonics (up to six), with a quality factor of 35. Dataset D5 comprised telephone recordings that included the initial phone ringing and a softer, interviewer’s voice. So, the first 40 s of audio was discarded in every D5 clip, and then, a loudness gate was applied to maintain the main speaker’s voice before stitching the speech segments to make the clip 8 s long. Dataset D6 only contained “Ah” sounds; hence, voice activity detection, with energy-based backup, was employed as explained earlier. Due to the diversity in the recording environments, data collection procedures, and audio quality, the above preprocessing steps were followed to standardize each speech dataset into a useful downstream pipeline rather than to optimize any single dataset individually. The settings applied across the datasets are summarized below:
- Conversion to mono
- Resampling to 16 kHz
- RMS normalization target: -20 dBFS
- Peak limit: -1 dBFS
- Minimum RMS threshold: -60 dBFS
- Maximum gain: +18 dB
- WebRTC VAD mode 2
- Frame size: 30 ms
- Clip length rules: vowel clips of 2.0 s; read/other clips up to 8.0 s
- Maximum of 8 clips per speaker per task
- Training, validation, and test speaker split percentages: 70/15/15 (50/20/30 for D5v2)
Table 2 summarizes the final preprocessed speaker and clip counts of each dataset. Due to the dataset sizes being imbalanced when compared to one another, with D2 dominating by having more speakers and clips than the other datasets, the study was designed to treat D2 as the primary left-out target dataset, and to interpret the results from smaller datasets cautiously.
| Dataset Identifier | # Total Speakers | # Male Speakers | # Female Speakers | # PD Speakers | # HC Speakers | # Total Audio Clips Used | # Vowel Clips Used | # Read/Other Clips Used |
|---|---|---|---|---|---|---|---|---|
| D1 | 107 | 61 | 46 | 52 | 55 | 1692 | 837 | 855 |
| D2 | 630 | 189 | 441 | 92 | 538 | 5670 | 630 | 5040 |
| D4 | 65 | 44 | 21 | 28 | 37 | 731 | 397 | 334 |
| D5 | 37 | 13 | 24 | 16 | 21 | 73 | 0 | 73 |
| D6 | 81 | 37 | 44 | 40 | 41 | 81 | 81 | 0 |
| D7 | 290 | 155 | 135 | 136 | 154 | 2577 | 1315 | 1262 |
Deep Learning Models
Model Architecture
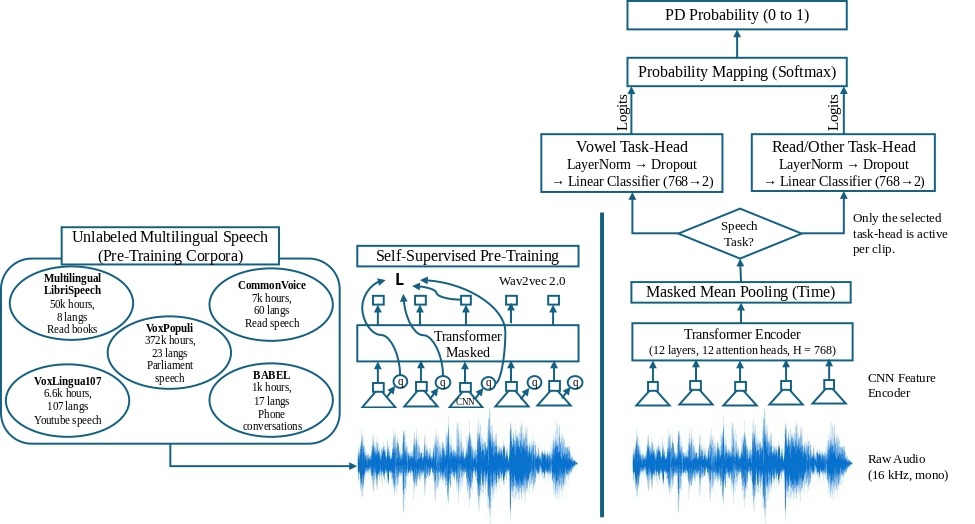
Each model included a pretrained Wav2Vec2 feature extractor. Wav2Vec2 is a speech model trained on many hours of spoken audio, allowing it to learn general patterns of human speech (Figure 3). The present study utilized Wav2Vec2 as the frozen “backbone” (Figure 2), which meant that its internal weights were not changed during the model training. Wav2Vec2 was used only to extract speech features from the audio at 16 kHz (mono). It included a convolutional feature encoder (CNN) and a transformer encoder with 12 layers, 12 attention heads, and a hidden dimension of 768. The frame-level features were combined into a single clip-level representation using masked mean pooling over time. This pooling excluded the padded regions of the clip. On top of this frozen backbone, two small task-specific classification heads were trained: one for vowels and another for read/other speech. Each head included a “LayerNorm plus Dropout” block, which reduced training instability and overreliance on a single feature, followed by a linear classifier that yielded two logits. A softmax operation was then used to convert these logits into PD probabilities. The present study evaluated this single modeling configuration and did not compare it with classical feature-based machine learning baselines, perform full backbone fine-tuning, or evaluate further alternative pooling strategies such as attention-based pooling.

Training and Validation Protocol
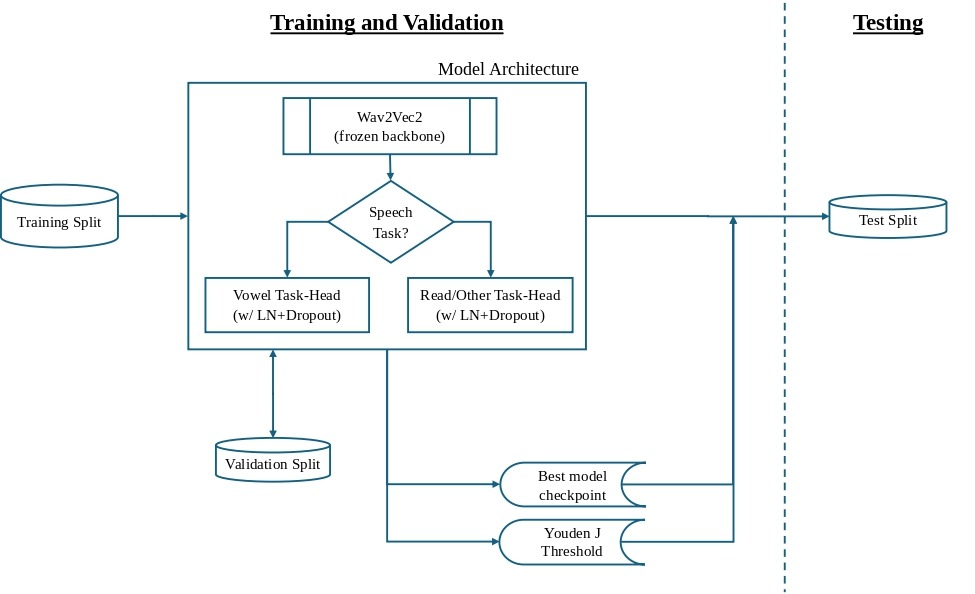
All the datasets (D1, D2, D4, D5v2, and D6) followed the same training and validation protocol (Figure 4). Each training run used fixed settings: run up to 10 epochs, early stopping with a patience level of 2 non-improving epochs on validation AUROC (Area Under the Receiver Operating Characteristic Curve), an effective batch size of 64 (via repeated gradient accumulation of 16), learning rate of 0.001 (for balancing training speed and stability), three random seeds (1337, 2024, and 7777), and mixed precision on the GPU processor for improving the speed. The best performing epoch was stored for each seed. The use of three seeds provided a basic estimate of the run-to-run variability in model performance, but a larger repeated-run design with more seeds would be necessary to better assess the variability in performance. Early stopping after 2 non-improving epochs was implemented due to the limited learning capacity of the training heads, as their performance improvements usually happen early and further continuation can lead to noise or overfitting. A decision threshold was optimized on the validation split using Youden’s J statistic and used during the test evaluations. Youden’s J statistic selects the optimal cut-off on the ROC (Receiver Operating Characteristic) curve that balances sensitivity (true positive rate, TPR) and specificity (true negative rate, TNR) of the test. During training, the audio clips were paired with an attention mask on Wav2Vec2 to preclude the model from learning from the artificial padding that was added to make the clip lengths consistent in a batch. The weights in each of the two task-heads (vowel and read/other) were optimized with Adam (Adaptive Moment Estimation algorithm).
Testing Protocol
The test evaluations also followed a uniform workflow (Figure 4) to preclude unintentional tuning of the model by the test set. The seed-specific best head weights were loaded from the model training. AUROC results were averaged across the three seeds and stored as the mean test AUROC. The mean validation-optimal Youden J threshold was applied for the confusion matrix and other threshold-dependent metrics. Fairness was calculated as ΔFNRF-M = FNR(Female) − FNR(Male), as evaluated on the test set. Statistical uncertainty estimates such as confidence intervals or bootstrap intervals were not calculated in the present study. The reported AUROC and fairness should be interpreted as descriptive performance summaries versus precise population estimates.
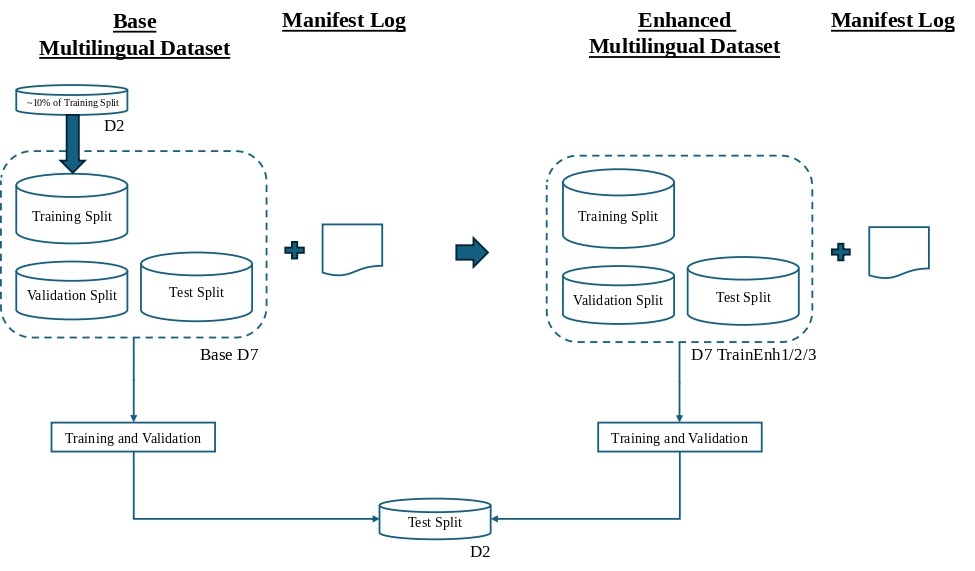
Base Multilingual Model
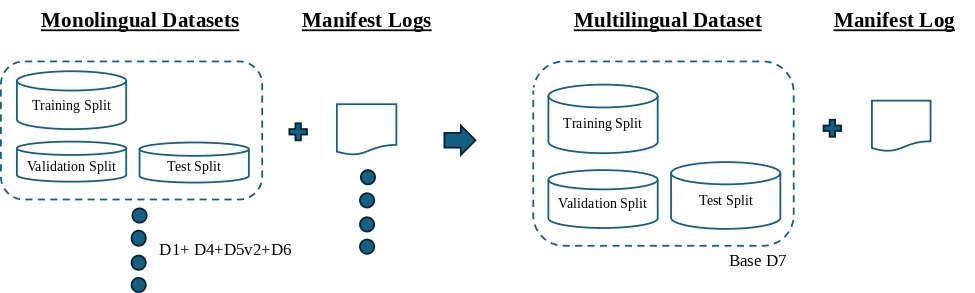
In order to produce a leave-one-dataset-out multilingual model, a “base” model (D7) was built by combining the training splits of four preprocessed datasets D1, D4, D5v2, and D6 (Figure 5). D2 was selected as the left-out target dataset because it contained a large number of speakers and clips to make it sufficiently diverse. Further, monolingual testing on D2 had achieved a moderate mean AUROC of 0.73, which indicated that it was learnable. Nevertheless, this decision to select D2 as the left-out target dataset was made to accommodate the available imbalanced datasets, and should not be interpreted as a balanced assessment of multilingual training capacity. The multilingual model (D7) was trained on the combined training splits of the four datasets and validated on their combined validation splits. The D7 base model was initially evaluated on the D7 test split to establish its in-dataset performance for reference, and then on the D2 test split as the target set.
Enhanced Multilingual Models
Three enhanced multilingual training models were created by adding small speaker-balanced, non-overlapping portions of the D2 training split to the D7 base training split (Figure 6). Individual speakers, not audio clips, were chosen from the D2 training split. Choice of a speaker meant that all of their clips from D2 were included. The target sample size was 10% of the D2 training split, forced to an even number to maintain a 50/50 balance between Healthy and Parkinson’s speakers. This process created two distinct enhanced datasets, viz. “TrainEnh1” and “TrainEnh2”. However, “TrainEnh3” was left with approximately 9% non-overlapping speakers since the remaining PD speakers in the D2 training split were insufficient to permit a full 10% balanced draw. This target-dataset calibration was performed on one primary left-out dataset (D2) and not repeated across multiple left-out datasets. The three enhanced datasets then followed the training and validation protocol with the D7 validation split, and were evaluated on the D2 test split.
Ablations and Interpretability Study
Target Data Ablation
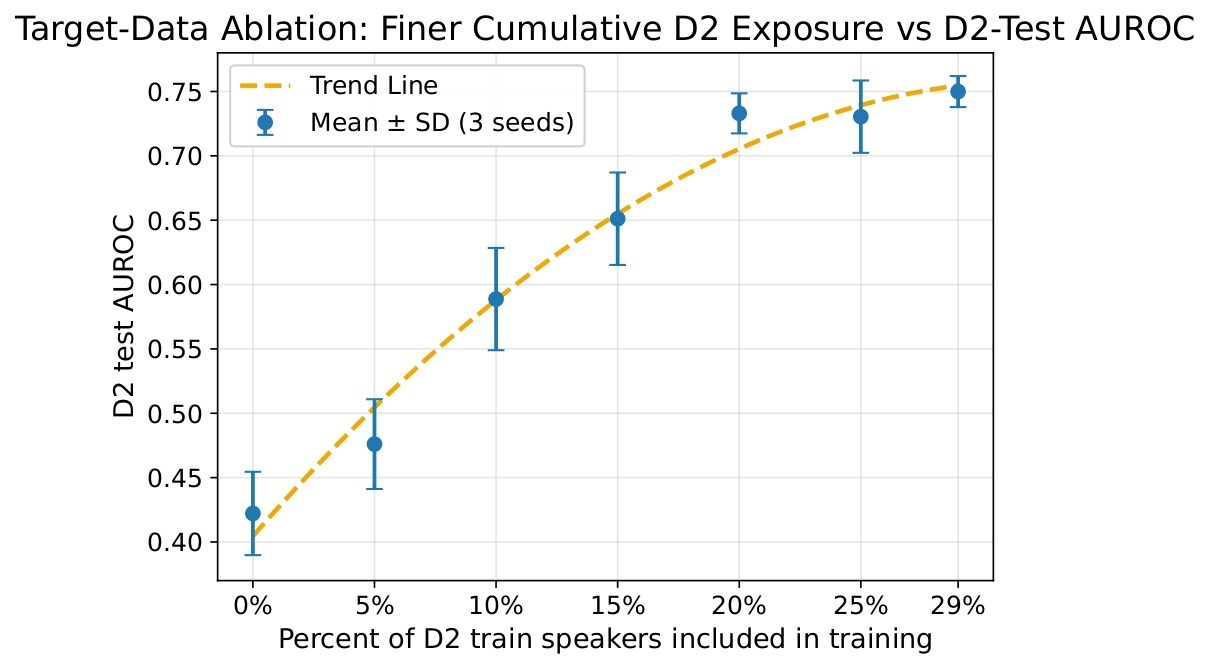
Target data ablation was performed in order to evaluate how varying exposure to the target dataset affected the performance of the multilingual model. The base model was cumulatively enhanced with speakers from the D2 training split in increments of 5%, 10%, 15%, 20%, 25%, and ~ 29%. All additions were performed while maintaining a 50/50 balance between Healthy and Parkinson’s speakers. The final increment (from 25% to ~ 29%) was limited to ~ 4% since the remaining number of PD speakers in the D2 training split did not permit any further balanced draws (as seen before for TrainEnh3). For each of the above increments, the mean test AUROC across seeds was calculated and plotted against the percentage of D2 training speakers included in the multilingual model.
Threshold Sweeps
Threshold sweeps were performed by reloading each enhanced model without any retraining, and running a forward pass on the D2 test split per seed. PD probabilities were determined per clip, and the analysis swept 199 thresholds from 0.01 to 0.99. The fairness difference ΔFNRF-M and its absolute value |ΔFNRF-M| were averaged across the seeds. A fairness-optimized threshold that minimized the mean |ΔFNRF-M|, while also achieving mean sensitivity ≥ 0.60 and mean specificity ≥ 0.50, was recommended for each enhanced model. The minimum sensitivity of 0.60 ensured meaningful detection of Parkinson’s speakers, while the minimum specificity of 0.50 prevented the trivial outcome of classifying almost all speakers as Parkinson’s. If the sensitivity and specificity constraints were not met, then the program was designed to report the failed constraint and select the closest associated threshold (called “Policy B+”).
Task-Head Ablation – Vowel vs Non-Vowel Speech Contributions
Task-head ablation was performed to quantify the effects of vowel and read/other speech tasks on the as-tested performance and fairness of each base and enhanced model. Existing prediction files were used and no new test runs were performed. The validation-optimal threshold was used to delineate Healthy versus Parkinson’s clips based on the predicted probabilities. Comparison charts showing AUROC and ΔFNRF-M by task type were plotted. This analysis identified which speech task had a greater influence on the AUROC performance and evaluated whether sex-related fairness was dependent on the task type.
Forced Task-Head Routing Ablation
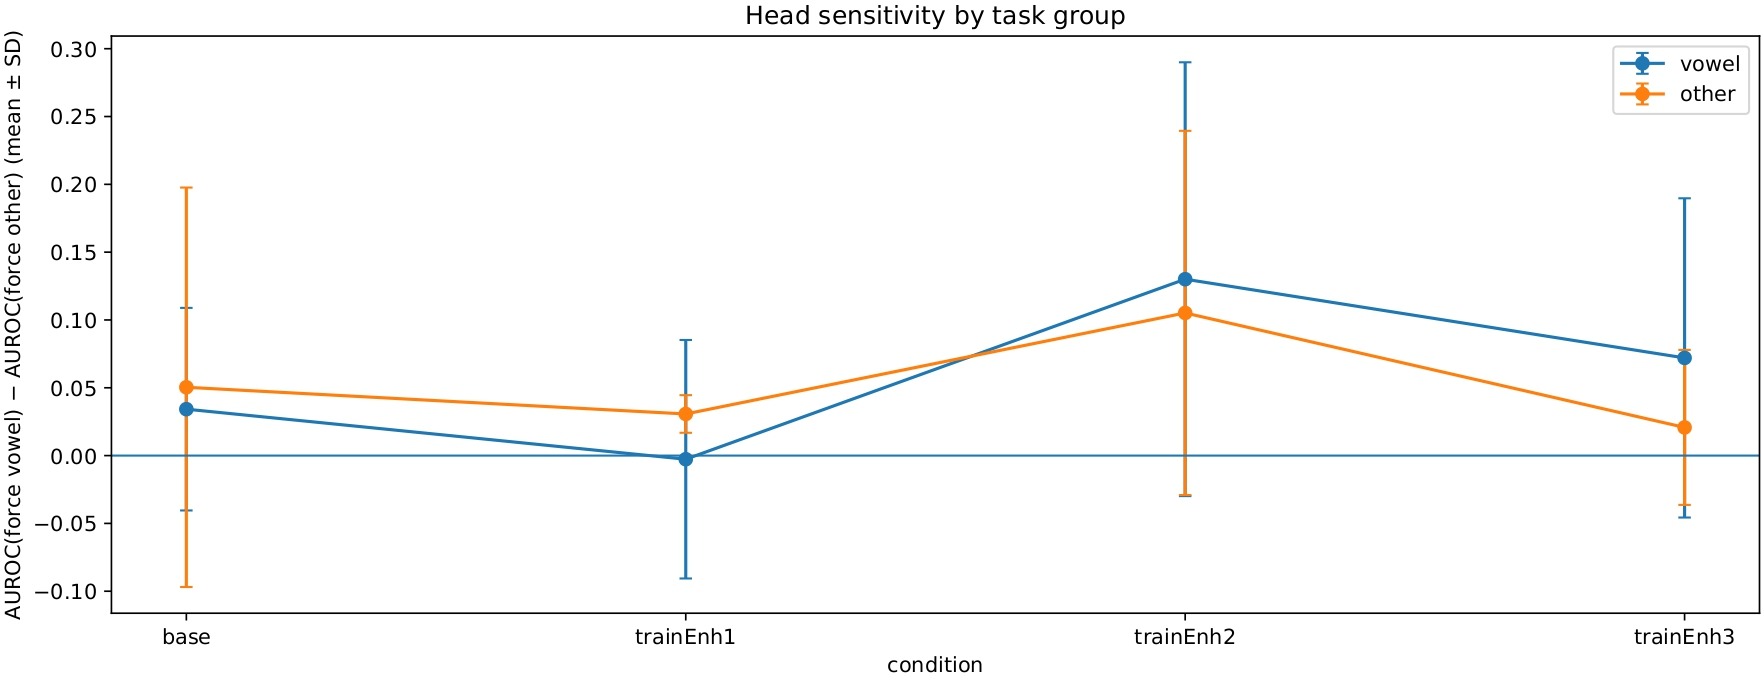
Forced task-head routing ablation examined whether model performance and fairness depended on using the dedicated task-specific head. Additional runs included testing each base and enhanced model on the D2 test split by intentionally forcing all clips to route through a single task-head (vowel or read/other) independent of their task type. Thus, two forced task-head runs for each of the three seeds were conducted per model. Test AUROC performance and fairness difference ΔFNRF-M were plotted, and so was the “head sensitivity”. Head sensitivity assessed whether the model performed better when the audio clip was sent to its assigned task-head versus the other head. Since head sensitivity was defined as AUROC(force vowel head) − AUROC(force read/other head), positive head sensitivity indicated that the vowel head performed better than the read/other head on that test condition. Negative head sensitivity meant that the read/other head performed better than the vowel head.
Interpretability Study – Prediction Score Distribution Analysis
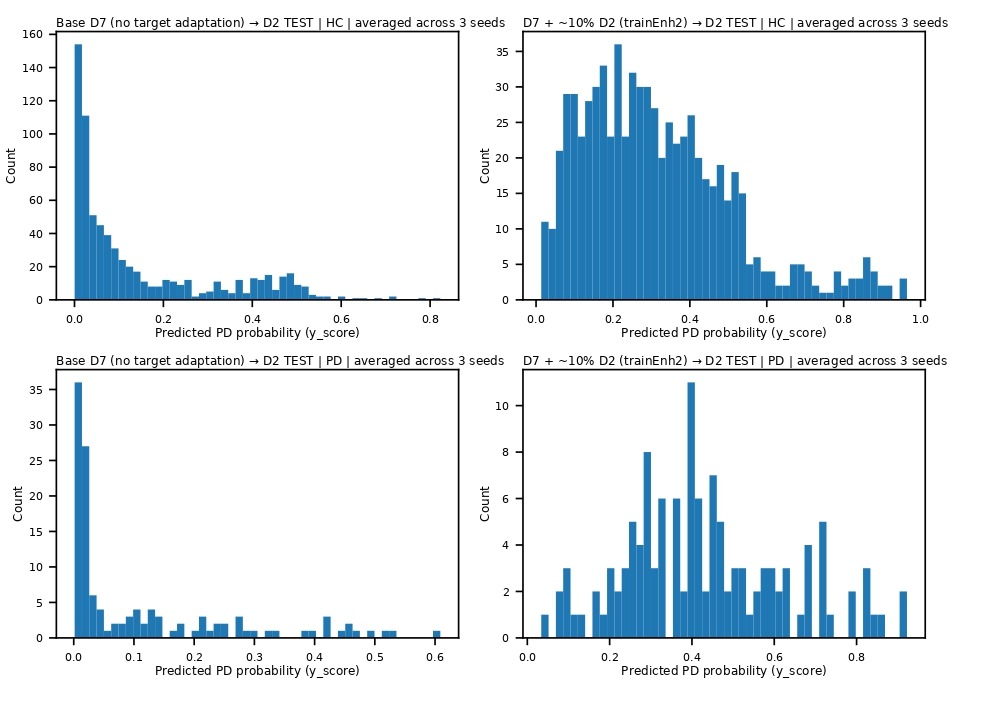
An interpretability study was conducted to analyze the saved predicted score distributions and explain model behavior. From the test results of the base and enhanced models on the D2 test split, the predicted Parkinson’s probabilities were averaged across the seeds for each test clip. Histogram plots of the counts of Healthy and Parkinson’s clips versus their respective predicted probabilities (ranging from 0 to 1) were created, and these plots were split by sex as well. The score distributions indicated how the ~ 10% target inclusion in each enhanced model had shifted the probabilities to the right on the graph. This analysis helped explain prediction confidence in model behavior, more than what a single AUROC parameter could help understand.
Code Availability
The code used for data preprocessing, model training, evaluation, and analysis in this study is available at: https://github.com/ynganatra/pd-speech-cross-dataset-transfer.
Results
Monolingual and Cross-Dataset Zero-Shot Testing
Monolingual models that were trained and tested on the same dataset showed convincing AUROC performance (Table 3). The highest mean AUROC of 0.85 among the monolingual tests was obtained for the D4 (Italian) dataset with 93 test clips. D2 (Slovak) produced a mean test AUROC of 0.73 on its larger test set of 846 clips. Due to the relatively small test split of D4, its performance estimates were considered less statistically stable than those from D2 and should be cautiously interpreted. D1 (Castilian Spanish) also reported a mean AUROC of 0.70 on 270 test clips. On the other hand, D5v2 (English-UK) and D6 (English-US sustained “Ah” sounds) had lower mean AUROC values of 0.58 and 0.61 respectively. Since several datasets were imbalanced with respect to others in the present study, AUROC was utilized as an overall performance metric, but it did not fully describe precision-recall behavior.
| Dataset | Test set size (# audio clips) | Mean Test AUROC | Interpretation |
|---|---|---|---|
| D1 | 270 | 0.70 Range (3 seeds): 0.69–0.70 | Moderate in-dataset performance. |
| D2 | 846 | 0.73 Range (3 seeds): 0.72–0.74 | Large test set; moderate in-dataset performance. |
| D4 | 93 | 0.85 Range (3 seeds): 0.80–0.88 | Strong in-dataset performance, but smaller test set. |
| D5v2 | 24 | 0.58 Range (3 seeds): 0.45–0.80 | Small test set; results are noisy and should not be overinterpreted. |
| D6 | 12 | 0.61 Range (3 seeds): 0.50–0.67 | Extremely small test set; results are indicative only. |
In contrast with the above results, cross-dataset zero-shot transfer tests that were conducted with the model trained on one dataset and evaluated on another performed substantially worse (Table 4). The transfer test from the dataset D1 to D2 yielded a low mean AUROC of 0.57. Further, the transfer test from D4, which had earlier reported the highest monolingual AUROC, to the largest test set D2 received a 0.31 mean AUROC (worse than chance, AUROC < 0.5). This pointed to a stronger disparity between the training and test datasets as opposed to simply being a weak transfer. Similarly, transfers from D5v2 and D6 to D2 provided low mean AUROC of 0.52 and 0.55 respectively, indicating poor transfer performance. Italian and Castilian Spanish belong to the same language family (Romance), yet the zero-shot D4 to D1 transfer yielded a mean AUROC of 0.50. Another transfer test from D2 to D5v2 also yielded a mean AUROC of 0.35 on the small test set.
| Training dataset → Test dataset | Test set size (# audio clips) | Mean Test AUROC | Interpretation |
|---|---|---|---|
| D1 → D2 | 846 | 0.57 Range (3 seeds): 0.55–0.59 | Limited transfer. |
| D4 → D2 | 846 | 0.31 Range (3 seeds): 0.30–0.31 | Very poor transfer, worse than chance. |
| D5v2 → D2 | 846 | 0.52 Range (3 seeds): 0.41–0.61 | Near chance performance, high AUROC variability. |
| D6 → D2 | 846 | 0.55 Range (3 seeds): 0.43–0.61 | Near chance performance, high AUROC variability. |
| D4 → D1 | 270 | 0.50 Range (3 seeds): 0.50–0.51 | Near chance performance. |
| D2 → D5v2 | 24 | 0.35 Range (3 seeds): 0.31–0.39 | Poor transfer, worse than chance, very small test set. |
Testing with the Base and Enhanced Multilingual Models
With the objective of addressing the poor cross-dataset test AUROC performance in zero-shot tests, a multilingual model was developed and trained on a combined dataset (D7), following the leave-one-dataset-out framework. When the D7 base model was evaluated on the target D2 test set, it reported a mean test AUROC of only 0.41 across the three seeds. However, when a small proportion of the target D2 training split was added to the base multilingual model, the AUROC performance improved (Table 5). When 10% of the D2 speakers were added to create “TrainEnh1”, the mean test AUROC increased to 0.58. Similarly, TrainEnh2 and TrainEnh3 reported improved mean test AUROC of 0.67 and 0.59 respectively. These results showed that a small amount of speaker-balanced, non-overlapping, target-domain data led to performance improvements of the enhanced multilingual models.
| Model | Mean Test AUROC | Interpretation |
|---|---|---|
| D7 Base | 0.41 Range (3 seeds): 0.41–0.42 | AUROC is below chance on D2. |
| D7 TrainEnh1 | 0.58 Range (3 seeds): 0.55–0.60 | AUROC improves vs D7 Base, but less than D7 TrainEnh2. |
| D7 TrainEnh2 | 0.67 Range (3 seeds): 0.66–0.70 | AUROC improves the most. |
| D7 TrainEnh3 | 0.59 Range (3 seeds): 0.57–0.60 | AUROC improves vs D7 Base, but less than D7 TrainEnh2. |
The multilingual test runs reported fairness ΔFNRF-M measured at the mean validation-optimal (Youden J) threshold for the model. Although the D7 base model reported a mean ΔFNRF-M of −0.01, its poor overall AUROC performance may reflect unreliable classification. TrainEnh1 measured a larger positive mean ΔFNRF-M of 0.17, i.e. on average, the model missed more female speakers with PD than male speakers, suggesting that the TrainEnh1 model favored more accurate PD detection in male speakers. On the other hand, TrainEnh2 and TrainEnh3 produced mean ΔFNRF-M values of −0.03 and −0.02 respectively that are both closer to zero.
Ablations and Interpretability Study
Target Data Ablation
Figure 7 shows the AUROC performance results of the cumulative inclusion of the D2 training speakers in the D7 multilingual model. Each test performed with the increasing proportion of D2 speakers trended towards higher mean test AUROC values. The largest increases in AUROC were seen up to approximately 20% inclusion of D2 training speakers. After this level, the AUROC improvements were smaller, but a peak mean D2 test AUROC of 0.75 was achieved by enhancing the D7 multilingual model with ~ 29% D2 training speakers. This value was slightly higher than the mean test AUROC of 0.73 reported by the D2 monolingual model trained with the full D2 training split.
Threshold Sweeps
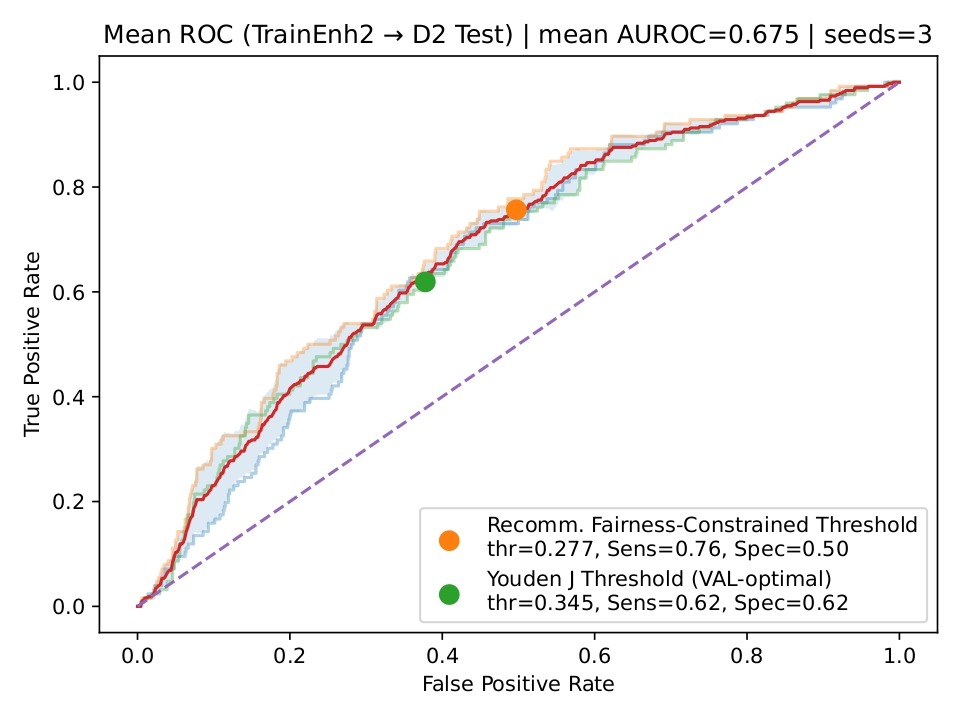
Threshold sweeps for TrainEnh1 just barely achieved the constraints of minimum 0.60 mean sensitivity and minimum 0.50 mean specificity across the seeds, and recommended a fairness-constrained threshold of 0.3614. Similar thresholds of 0.2773 and 0.3020 were also recommended for TrainEnh2 and TrainEnh3 respectively (Table 6). Figure 8 shows the mean ROC curve, averaged across the three seeds, for TrainEnh2 evaluated on the D2 test split. The mean AUROC across the three seeds was 0.67, indicating moderate performance of the model. Two thresholds are also indicated: the validation-optimal Youden J threshold and the recommended fairness-constrained threshold. The Youden J threshold balanced the sensitivity and specificity (at 0.62), whereas the fairness-constrained threshold increased sensitivity to approximately 0.76 at the penalty of reduced specificity (~ 0.50).
| Model | Youden J Threshold (VAL-optimal) | Recomm. Fairness-Constrained Threshold | Mean Sensitivity @Recomm. Threshold | Mean Specificity @Recomm. Threshold | Mean |ΔFNRF-M| @Recomm. Threshold | Interpretation |
|---|---|---|---|---|---|---|
| D7 TrainEnh1 | 0.4407 | 0.3614 | 0.6058 | 0.5083 | 0.1704 | Large fairness gap remains. |
| D7 TrainEnh2 | 0.3446 | 0.2773 | 0.7566 | 0.5028 | 0.051 | Best balance: strong sensitivity with substantially reduced fairness gap. |
| D7 TrainEnh3 | 0.3778 | 0.3020 | 0.6111 | 0.5056 | 0.0354 | Modest threshold shift yields strong fairness balance. |
Task-Head Ablation – Vowel vs Non-Vowel Speech Contributions
The task-head ablation indicated higher contribution to AUROC (up to 0.68) from the read/other speech tasks as compared to the vowel tasks that were lower and reached 0.45 at best. The same ablation also indicated that fairness results, measured by ΔFNRF-M, yielded values closer to 0 for read/other tasks as compared to the vowel tasks (Figure 9).

Forced Task-Head Routing Ablation
Forced task-head routing affected the model performance. For read/other clips, normal routing through their own task-head achieved the highest AUROC of 0.65 to 0.70 for the enhanced models. However, forcing read/other clips through the vowel task-head reduced AUROC by 0.05 to 0.10. On the other hand, AUROC was lower overall (0.45 to 0.58) for vowel clips, and forcing them through the vowel task-head increased the AUROC slightly versus forcing them through the read/other task-head. The head sensitivity results are shown in Figure 10. Finally, the absolute fairness difference |ΔFNRF-M| for vowel clips was generally lower (0.05 to 0.10) as compared to read/other clips.
Interpretability Study – Prediction Score Distribution Analysis
The prediction score distribution analysis indicated that the probability scores for PD and HC clips overlapped significantly on the base model. Most clips were clustered closer to lower predicted probabilities, which is reflective of the mean test AUROC of the base model being 0.41. A shift of probabilities to the right was observed for the enhanced models (TrainEnh1, TrainEnh2, and TrainEnh3). Figure 11 illustrates this rightward shift for the TrainEnh2 model as an example. When further broken down by sex, the score distributions for male and female PD speakers appeared to be similar to each other in general.
Discussion
Key Takeaways and Interpretation
Monolingual models trained and tested on the same dataset showed that patterns related to PD can be learned from speech within the same domain. This was inferred from the higher mean test AUROC values reported for the datasets D1, D2, and D4. The AUROC results for D5v2 and D6 were weaker and more variable due to their smaller test sets. Their test splits were smaller due to limited dataset sizes, which caused unstable performance scores, and the reported AUROC may not represent the model’s true ability to transfer. In particular, D5v2 continued to show poor performance despite increasing the test split of D5 from 15% to 30%. At the same time, cross-dataset zero-shot transfer tests performed poorly and inconsistently across language pairs. These results indicated that the performance of zero-shot transfers was dependent on the source and target datasets, and attempts to utilize a model trained on one dataset to evaluate another dataset were not generally reliable. Therefore, the observed differences in performance reflected transfer under combined domain shifts rather than differences in language alone.
The base multilingual model built by combining all, but one, datasets (leave-one-dataset-out strategy) also reported very low AUROC performance when tested on the target (left-out) dataset. The mixing of datasets with varied languages and recording conditions did not produce a model with high AUROC performance when tested on an unseen dataset. In contrast, when a small amount of the target dataset D2 (~ 10%) was added into the base model and used for training, the cross-dataset test performance showed improvement for each of the enhanced training datasets. Further, the target data ablation highlighted that the performance of the multilingual model improved with increasing exposure to the target data. In the present study, the largest gains were observed below 20% of D2 target speaker inclusion into the multilingual model.
The above results showed that the target domain-sampling strategy matters. Although the common theme of AUROC improvement was evident in the three enhanced models, differently sampled speaker subsets from the same target training dataset led to clearly different AUROC and fairness results. The data collection efforts for the target language do not need to be extensive as long as the sampled speakers are carefully chosen. However, this study did not test the validity of this concept under real-world deployment conditions, so this point should be interpreted cautiously. In summary, the results supported the three hypotheses evaluated in this study. H1 was supported because the cross-dataset zero-shot testing consistently showed lower AUROC results than in-dataset testing. H2 was supported since adding a small speaker-balanced portion of the target dataset improved the transfer performance of the multilingual model. H3 was also supported because the fairness results, measured by ΔFNRF-M, differed across models and changed with the selected decision threshold.
The threshold sweep ablation demonstrated that fairness, quantified as ΔFNRF-M in the present study, was not determined by training alone. The same model outputs without retraining could lead to different results and tradeoffs based on the threshold values chosen after training. Table 6 and Figure 8 illustrate that, in practice, one could choose the threshold to minimize the difference in fairness. However, that choice generally comes at a compromise between sensitivity and specificity. Thus, the choice of an acceptable operating threshold depends on its intended application. The task-type ablation indicated that read/other speech tasks contributed to higher AUROC performance gain on the D2 test set as compared to vowel tasks. Similarly, the forced task-head routing ablation indicated that the specialized training of the task-heads matters. Routing of the read/other clips through their own specialized task-head yielded the highest AUROC, whereas routing them through the vowel task-head dropped the AUROC. Vowel clips were less sensitive to the choice of the task-head but on the whole, AUROC was lower for vowel clips even when routed through the vowel task-head. This is consistent with the observation from the task-type ablation that vowel tasks were less dominant in the AUROC performance on the D2 target set.
The prediction score distribution histograms illustrated that the model predictions produced greater separation of probabilities when the target training enhancements were introduced into the base model. The initial prediction scores were clustered near zero and low probabilities for the base model, but the histograms showed a noticeable shift of the probabilities to the right after training enhancements with the target dataset, resulting in greater separation between the Healthy and Parkinson’s clips.
Limitations
Several limitations influenced the results of the present study, and it is important to address them here. The results are representative of the differences across datasets that vary in language, recording conditions, speech tasks, and collection protocols, so the language effects were not isolated. Data preprocessing required a few manual design choices, and this study did not explicitly test the sensitivity of the results with respect to those choices. This study did not evaluate model performance with real-world background noise, differences in recording devices, or the consistency of predictions over time.
A significant limitation is the imbalance in the speech dataset sizes that were publicly available. D2 contained considerably more speakers and clips than D1, D4, D5, and D6, making it the most statistically stable dataset and causing it to dominate several comparisons. On the other hand, some datasets such as D4, D5, and D6 had limited numbers of speakers and audio clips. This increased uncertainty and reduced the reliability and stability of performance and fairness estimates, both of which should be interpreted with caution for those cases. An additional limitation is that the D7 base model was not designed as a balanced multilingual training set, since D2 was intentionally excluded to create a left-out target dataset, and the remaining datasets still differed in size and language. Moreover, the results of this study were summarized primarily using AUROC as a single summary performance measure as opposed to precision-recall analysis that can be more informative for imbalanced datasets. The below-chance, zero-shot transfer result from D4 to D2 suggests that some cross-dataset failures may be the result of a stronger disparity between source and target conditions, but this limitation was not investigated further in the present study.
The present study did not include statistical uncertainty estimates such as confidence intervals or bootstrap intervals, so its results should be treated as descriptive rather than conclusive. This study used only three random seeds, which limited the strength of its conclusions with respect to performance stability, for the smaller test sets in particular. The backbone was kept frozen and only the small task-heads were trained. Although this improved comparability and speed for all the training and test runs, it may have also limited the maximum achievable adaptability to the target dataset. The study did not compare this frozen backbone configuration with classical feature-based baselines, fully fine-tuned Wav2Vec2 models, domain adaptation approaches, or alternative pooling methods. Hence, its results should be interpreted as those resulting from a single defined modeling pipeline rather than an all-inclusive benchmark. Finally, the limited target-dataset calibration was performed by using a single left-out target dataset rather than being repeated across multiple left-out domains.
Conclusion and Future Work
Overall, this study showed that speech-based Parkinson’s detection worked well within a dataset, but cross-dataset transfer was poor unless some target training data was incorporated into the model. From a practical perspective, this finding suggested that limited target-domain calibration may improve the transfer to a different dataset, but this should be further validated before utilizing it as evidence of real-world deployment readiness. In the future, model performance should be tested under more realistic conditions, including background noise, variations in recording devices, and repeated recordings over time. Future controlled multi-language data collection efforts with matching speech tasks and recording environments would help isolate the language effects from other sources of cross-dataset variation. Further, besides repeating the calibration analysis across multiple left-out target datasets to evaluate the consistency of our findings, future work could include additional target datasets, higher speaker counts within datasets so that the performance estimates are statistically stable, and the evaluation of additional demographic factors besides sex.
Future work should also test more balanced multilingual training sets by controlled down-sampling or matched dataset construction in order to determine whether the present findings would still hold under less imbalanced dataset composition. Precision-recall curves and related summary metrics could be included to complement AUROC, which was used as a single performance measure in this study, particularly for the smaller and more imbalanced evaluation datasets. It may be beneficial to investigate the below-chance transfer results closely in order to pinpoint whether they are a result of differences in recording conditions, speech tasks, label balance, or model calibration. Potential future efforts should also explore the sensitivity of the results to the preprocessing design choices, viz. normalization, clipping limits, VAD settings, and clip-selection rules. Future comparisons with classical feature-based machine learning baselines, fully fine-tuned models, domain adaptation approaches, alternative pooling strategies, larger seed counts, and statistical uncertainty estimates would contribute to developing a more comprehensive benchmark study. Furthermore, focused fine-tuning experiments could help explain whether selective adaptation of the backbone improves cross-dataset transfer more effectively than the frozen-backbone configuration used in this study.
Acknowledgements
The author would like to thank Dr. Dvijesh Shastri from the Department of Computer Science and Engineering Technology at the University of Houston-Downtown for his guidance and feedback. The author also acknowledges his research mentor, Mihir Relan of Johns Hopkins University, for his support and discussions. Additionally, the author thanks his father, Nirmal (Nick) Ganatra, for his guidance and review of the manuscript.
References
- C. Quan, Z. Chen, K. Ren, Z. Luo. FedOcw: optimized federated learning for cross-lingual speech-based Parkinson’s disease detection. npj Digital Medicine. Vol. 8, pg. 357, 2025, https://doi.org/10.1038/s41746-025-01763-3. [↩] [↩]
- C. D. Rios-Urrego, J. Rusz, J. R. Orozco-Arroyave. Automatic speech-based assessment to discriminate Parkinson’s disease from essential tremor with a cross-language approach. npj Digital Medicine. Vol. 7, pg. 37, 2024, https://doi.org/10.1038/s41746-024-01027-6. [↩] [↩] [↩]
- G. Dimauro, D. Caivano, V. Bevilacqua, F. Girardi, V. Napoletano. VoxTester, software for digital evaluation of speech changes in Parkinson disease. In Proceedings of the 2016 IEEE International Symposium on Medical Measurements and Applications (MeMeA), pg. 1–6, 2016, https://doi.org/10.1109/MeMeA.2016.7533761. [↩]
- H. Xu, W. Xie, M. Pang, Y. Li, L. Jin, F. Huang, X. Shao. Non-invasive detection of Parkinson’s disease based on speech analysis and interpretable machine learning. Frontiers in Aging Neuroscience. Vol. 17, pg. 1586273, 2025, https://doi.org/10.3389/fnagi.2025.1586273. [↩] [↩]
- L. Simone, M. G. Camporeale, V. M. Rubino, V. Gervasi, G. Dimauro. Interpretable early detection of Parkinson’s disease through speech analysis. In Proceedings of the International Conference on Artificial Intelligence in Medicine, pg. 373–378, 2025, https://doi.org/10.1007/978-3-031-95841-0_69. [↩]
- E. Vaiciukynas, A. Verikas, A. Gelzinis, M. Bacauskiene. Detecting Parkinson’s disease from sustained phonation and speech signals. PLOS ONE. Vol. 12, pg. e0185613, 2017, https://doi.org/10.1371/journal.pone.0185613. [↩]
- J. R. Orozco-Arroyave, F. Hönig, J. D. Arias-Londoño, J. F. Vargas-Bonilla, K. Daqrouq, S. Skodda, J. Rusz, E. Nöth. Automatic detection of Parkinson’s disease in running speech spoken in three different languages. The Journal of the Acoustical Society of America. Vol. 139(1), pg. 481–500, 2016, https://doi.org/10.1121/1.4939739. [↩] [↩]
- M. Hireš, P. Drotár, N. D. Pah, Q. C. Ngo, D. K. Kumar. On the inter-dataset generalization of machine learning approaches to Parkinson’s disease detection from voice. International Journal of Medical Informatics. Vol. 179, pg. 105237, 2023, https://doi.org/10.1016/j.ijmedinf.2023.105237. [↩]
- D. Xavier, V. Felizardo, B. Ferreira, H. Zacarias, M. Pourvahab, L. Souza-Pereira, N. M. Garcia. Voice analysis in Parkinson’s disease – a systematic literature review. Artificial Intelligence in Medicine. Vol. 163, pg. 103109, 2025, https://doi.org/10.1016/j.artmed.2025.103109. [↩]
- W. S. Lim, S.-I. Chiu, P.-L. Peng, J.-S. R. Jang, S.-H. Lee, C.-H. Lin, H.-J. Kim. A cross-language speech model for detection of Parkinson’s disease. Journal of Neural Transmission. Vol. 132, pg. 579–590, 2025, https://doi.org/10.1007/s00702-024-02874-z. [↩]
- P. V. K. Pandey, S. S. Sahu. Parkinson’s disease detection using hybrid Siamese neural network and support vector machine in multilingual voice signal. Journal of Voice. Advance online publication, 2025, https://doi.org/10.1016/j.jvoice.2025.06.036. [↩]
- I. K. Veetil, S. V., J. R. Orozco-Arroyave, E. A. Gopalakrishnan. Robust language independent voice data driven Parkinson’s disease detection. Engineering Applications of Artificial Intelligence. Vol. 129, pg. 107494, 2024, https://doi.org/10.1016/j.engappai.2023.107494. [↩]
- M. La Quatra, J. R. Orozco-Arroyave, M. S. Siniscalchi. Bilingual dual-head deep model for Parkinson’s disease detection from speech. In Proceedings of the ICASSP 2025 – IEEE International Conference on Acoustics, Speech and Signal Processing, pg. 1–5, 2025, https://doi.org/10.1109/ICASSP49660.2025.10889445. [↩]
- J. Mendes-Laureano, J. A. Gómez-García, A. Guerrero-López, E. Luque-Buzo, J. D. Arias-Londoño, F. J. Grandas-Pérez, J. I. Godino Llorente. NeuroVoz: a Castillian Spanish corpus of parkinsonian speech (version 1.0.0). Zenodo 2024, https://doi.org/10.5281/zenodo.10777657. [↩]
- J. Mendes-Laureano, J. A. Gómez-García, A. Guerrero-López, E. Luque-Buzo, J. D. Arias-Londoño, F. J. Grandas-Pérez, J. I. Godino-Llorente. NeuroVoz: a Castillian Spanish corpus of parkinsonian speech. Scientific Data. Vol. 11, pg. 1367, 2024, https://doi.org/10.1038/s41597-024-04186-z. [↩]
- Institute of Informatics of the Slovak Academy of Sciences, AXON PRO s.r.o., Pan-European University, M. Trnka, M. Rusko. EWA-DB – early warning of Alzheimer speech database (version 1.0). Zenodo 2023, https://doi.org/10.5281/zenodo.10952480. [↩]
- M. Rusko, R. Sabo, M. Trnka, A. Zimmermann, R. Malaschitz, E. Ružický, P. Brandoburová, V. Kevická, M. Škorvánek. Slovak database of speech affected by neurodegenerative diseases. Scientific Data. Vol. 11, pg. 1320, 2024, https://doi.org/10.1038/s41597-024-04171-6. [↩]
- G. Dimauro, F. Girardi. Italian Parkinson’s voice and speech. IEEE DataPort 2019, https://doi.org/10.21227/aw6b-tg17. [↩]
- G. Dimauro, V. Di Nicola, V. Bevilacqua, D. Caivano, F. Girardi. Assessment of speech intelligibility in Parkinson’s disease using a speech-to-text system. IEEE Access. Vol. 5, pg. 22199–22208, 2017, https://doi.org/10.1109/ACCESS.2017.2762475. [↩]
- H H. Jaeger, D. Trivedi, M. Stadtschnitzer. Mobile device voice recordings at King’s College London (MDVR-KCL) from both early and advanced Parkinson’s disease patients and healthy controls. Zenodo 2019, https://doi.org/10.5281/zenodo.2867216. [↩]
- F. Prior, T. Virmani, A. Iyer, L. Larson-Prior, A. Kemp, Y. Rahmatallah, L. Pillai, A. Glover. Voice samples for patients with Parkinson’s disease and healthy controls (version 1). Figshare 2023, https://doi.org/10.6084/m9.figshare.23849127.v1. [↩]
- A. Iyer, A. Kemp, Y. Rahmatallah, L. Pillai, A. Glover, F. Prior, L. Larson-Prior, T. Virmani. A machine learning method to process voice samples for identification of Parkinson’s disease. Scientific Reports. Vol. 13(1), pg. 20615, 2023, https://doi.org/10.1038/s41598-023-47568-w. [↩]
- O. Kursun, B. Sakar, M. Isenkul, C. Sakar, A. Sertbas, F. Gurgen. Parkinson’s speech with multiple types of sound recordings. UCI Machine Learning Repository 2013, https://doi.org/10.24432/C5NC8M. [↩]
- B. E. Sakar, M. E. Isenkul, C. O. Sakar, A. Sertbas, F. Gurgen, S. Delil, H. Apaydin, O. Kursun. Collection and analysis of a Parkinson speech dataset with multiple types of sound recordings. IEEE Journal of Biomedical and Health Informatics. Vol. 17(4), pg. 828–834, 2013, https://doi.org/10.1109/JBHI.2013.2245674. [↩]
- A. Baevski, Y. Zhou, A. Mohamed, M. Auli. wav2vec 2.0: a framework for self-supervised learning of speech representations. In Advances in Neural Information Processing Systems. Vol. 33, 2020, https://proceedings.neurips.cc/paper_files/paper/2020/file/92d1e1eb1cd6f9fba3227870bb6d7f07-Paper.pdf. [↩]
- P. von Platen. Fine-tuning XLS-R for multilingual ASR with transformers. Hugging Face Blog. 2021 https://huggingface.co/blog/fine-tune-xlsr-wav2vec2 [↩]


