
Abstract
Terrestrial analog site identification for planetary rover testing often relies on logistical convenience, qualitative geomorphological similarity, and the availability of field infrastructure. While these approaches have produced widely used analog sites, it remains difficult to scale or systematize analog selection across large geographic regions using consistent, quantitative criteria. In this study, I present a low-cost, image-based screening framework that ranks terrestrial candidate sites by their visual-textural similarity to representative lunar and Martian terrains. Using grayscale orbital/satellite imagery, I compute two image-derived texture descriptors: (i) a brightness variability index capturing spatial intensity heterogeneity, and (ii) a local-gradient roughness proxy capturing small-scale intensity transitions. These descriptors are not treated as physical elevation or mechanical roughness; instead, they are standardized image-texture measures extracted under a consistent preprocessing pipeline, with images reprojected and resampled to a common spatial scale to reduce resolution-driven bias. Similarity between Earth sites and extraterrestrial reference regions is quantified in a multi-dimensional feature space that incorporates both central tendency and spatial variability of the descriptors. Applied to a curated multi-body image set and evaluated with bootstrap resampling, the framework yields stable rankings and frequently places established analog regions (including Devon Island) among the closest matches within this dataset. I emphasize that this method is intended as an initial screening tool rather than a substitute for physics-based terrain assessment, and I discuss key limitations related to illumination geometry, albedo/sensor differences, and the need for validation against elevation-derived roughness measures.
Keywords: planetary analogs; rover testing; terrain similarity; image texture; Moon; Mars; Devon Island; remote sensing
Introduction
Planetary rovers are routinely tested on Earth before deployment in extraterrestrial environments, yet the selection of appropriate terrestrial test sites remains largely heuristic1,2. Sites such as Devon Island in the Canadian High Arctic, volcanic terrains in Iceland, and hyper-arid regions of the Atacama Desert are frequently chosen based on qualitative similarity, logistical accessibility, or historical precedent3,4,5,2. While these locations have proven valuable, the absence of a standardized, scalable method for comparing terrestrial terrains to planetary surfaces complicates the identification of new or complementary analog sites across large regions1,2.
Remote sensing imagery offers a potential avenue for systematic, global-scale screening of candidate terrains6,1,7. Large archives of Earth, lunar, and Martian imagery enable comparative analysis without immediate in situ measurements7. However, the use of image-derived quantities must be approached cautiously. Pixel intensity patterns are influenced by illumination geometry (incidence/emission/phase angles), surface albedo and composition, atmospheric effects (Earth), sensor bandpasses, onboard processing, and spatial resolution8,9. Consequently, intensity-based descriptors should not be naively interpreted as physical elevation or mechanical roughness, especially across heterogeneous sources8.
The objective of this study is therefore limited but practical: to test whether simple, consistently extracted image-texture descriptors can be used to rank terrestrial sites by their visual-textural similarity to selected lunar and Martian terrains10,11. Rather than attempting to infer rover mobility directly, I operationalize “resemblance” as proximity in a defined feature space derived from image-texture statistics10. The resulting rankings are intended to support early-stage site screening and prioritization, to be followed by more detailed analyses using photometric correction, digital elevation models (DEMs)12,13, and field-based validation in established analog programs2,8,14.
Scope and Definitions
Throughout this paper, we use the term “similarity” to denote proximity in a defined image-feature space, not equivalence in physical, mechanical, or geological properties8. Two image-derived quantities are employed:
- Brightness variability index (BVI): a normalized measure of spatial variation in grayscale intensity within an image.
- Roughness proxy (RP): a texture descriptor based on local intensity gradients given by:
![\[R=(1/N)\sum_{i=1}^{N}\sum_{\text{neighbors}} \left|p_i - p_j \right|\]](https://nhsjs.com/wp-content/ql-cache/quicklatex.com-2b8c9ada2a6e24823be467240e763639_l3.png "Rendered by QuickLaTeX.com")
Where pi is the pixel and pj is the average value of the pixels around it
Importantly, neither BVI nor RP is interpreted as physical elevation, slope, rock abundance, or mechanical roughness8. Because illumination, albedo, and sensor processing can dominate intensity patterns, these descriptors are best viewed as standardized image-texture measures that may correlate with terrain appearance under constrained conditions but are not direct physical measurements8,9. The method does not model gravity, regolith mechanics, or rover–terrain interaction and must not be used to predict mobility or traction performance14. Its role is limited to comparative visual screening under a standardized processing pipeline.
Dataset
A curated dataset of grayscale or grayscale-converted orbital/satellite images was assembled for Earth, the Moon, and Mars from publicly available scientific image archives14. For each planetary body, ten images were used in the primary analysis. Images were selected to represent relatively homogeneous terrains; Earth scenes were chosen to minimize cloud cover and strong atmospheric obscuration.
Reproducibility note: The present manuscript reports region names and computed descriptor summaries for each scene. Full per-image provenance (sensor/mission, acquisition date/time, resolution in m/pixel, projection/CRS, and a retrievable identifier/link) is necessary for strict replication and is identified as a required improvement in future revisions and follow-on work14,15.
Table 1 summarizes the dataset and computed descriptors used in this study. To avoid physical overinterpretation, the former “altitude” columns are explicitly treated as normalized intensity statistics (scaled for readability) and reported in arbitrary units (a.u.), not meters8.
| Planet | Location | Country/Region | Mean normalized intensity (scaled; a.u.) | Std. normalized intensity (scaled; a.u.) | Mean roughness proxy (a.u.) |
| Earth | Askja Caldera | Iceland | 86.03 | 27.39 | 6.07 |
| Earth | North Atacama Desert | Chile | 152.17 | 55.32 | 15.8 |
| Earth | South Atacama Desert | Chile | 138.71 | 51.14 | 15.22 |
| Earth | Devon Island | Canada | 129.95 | 27.64 | 11.11 |
| Earth | Mauna Kea | United States- Hawaii | 95.74 | 25.74 | 6.14 |
| Earth | Meteor Crater | United States- Arizona | 152.49 | 42.21 | 13.54 |
| Earth | Nevada Desert | United States- Nevada | 175.73 | 24.49 | 5.51 |
| Earth | Nevada Test Site | United States- Nevada | 156.19 | 26.88 | 6.78 |
| Earth | Utah Desert | United States- Utah | 137.96 | 34.8 | 18.01 |
| Earth | Wadi Rum | Jordan | 159.23 | 32.52 | 13.17 |
| Moon | Moon1 | Mare Serenitatis | 152.49 | 50.32 | 6.82 |
| Moon | Moon2 | Mare Imbrium | 195.14 | 49.55 | 7.76 |
| Moon | Moon3 | Lacus Somniorum | 120.57 | 32.29 | 5.72 |
| Moon | Moon4 | Oceanus Procellarum | 156.03 | 29.37 | 10.73 |
| Moon | Moon5 | Mare Crisium | 120.61 | 61.43 | 11.7 |
| Moon | Moon6 | Mare Nectaris | 111.08 | 32.95 | 4.2 |
| Moon | Moon7 | Mare Nubium | 133.33 | 29.67 | 5.22 |
| Moon | Moon8 | Mare Frigoris | 113.71 | 67.05 | 10.73 |
| Moon | Moon9 | Mare Vaporum | 98.94 | 21.98 | 2.65 |
| Moon | Moon10 | Mare Cognitum | 105.8 | 32.04 | 2.46 |
| Mars | Mars1 | Elysium Planitia | 88.43 | 23.4 | 13.27 |
| Mars | Mars2 | Isidis Planitia | 57.46 | 27.91 | 5.53 |
| Mars | Mars3 | Noctis Labyrinthus | 155.91 | 22.98 | 8.47 |
| Mars | Mars4 | Gale Crater | 113.09 | 38.34 | 6.55 |
| Mars | Mars5 | Valles Marineris | 108.93 | 31.57 | 7.18 |
| Mars | Mars6 | Hellas Basin | 133.88 | 43.53 | 6.28 |
| Mars | Mars7 | Arabia Terra | 108.8 | 38.06 | 10.68 |
| Mars | Mars8 | Utopia Planitia | 133.47 | 39.95 | 4.09 |
| Mars | Mars9 | Terra Cimmeria | 134.55 | 27.98 | 5.13 |
| Mars | Mars10 | Argyre Planitia | 111.14 | 34.09 | 8.47 |
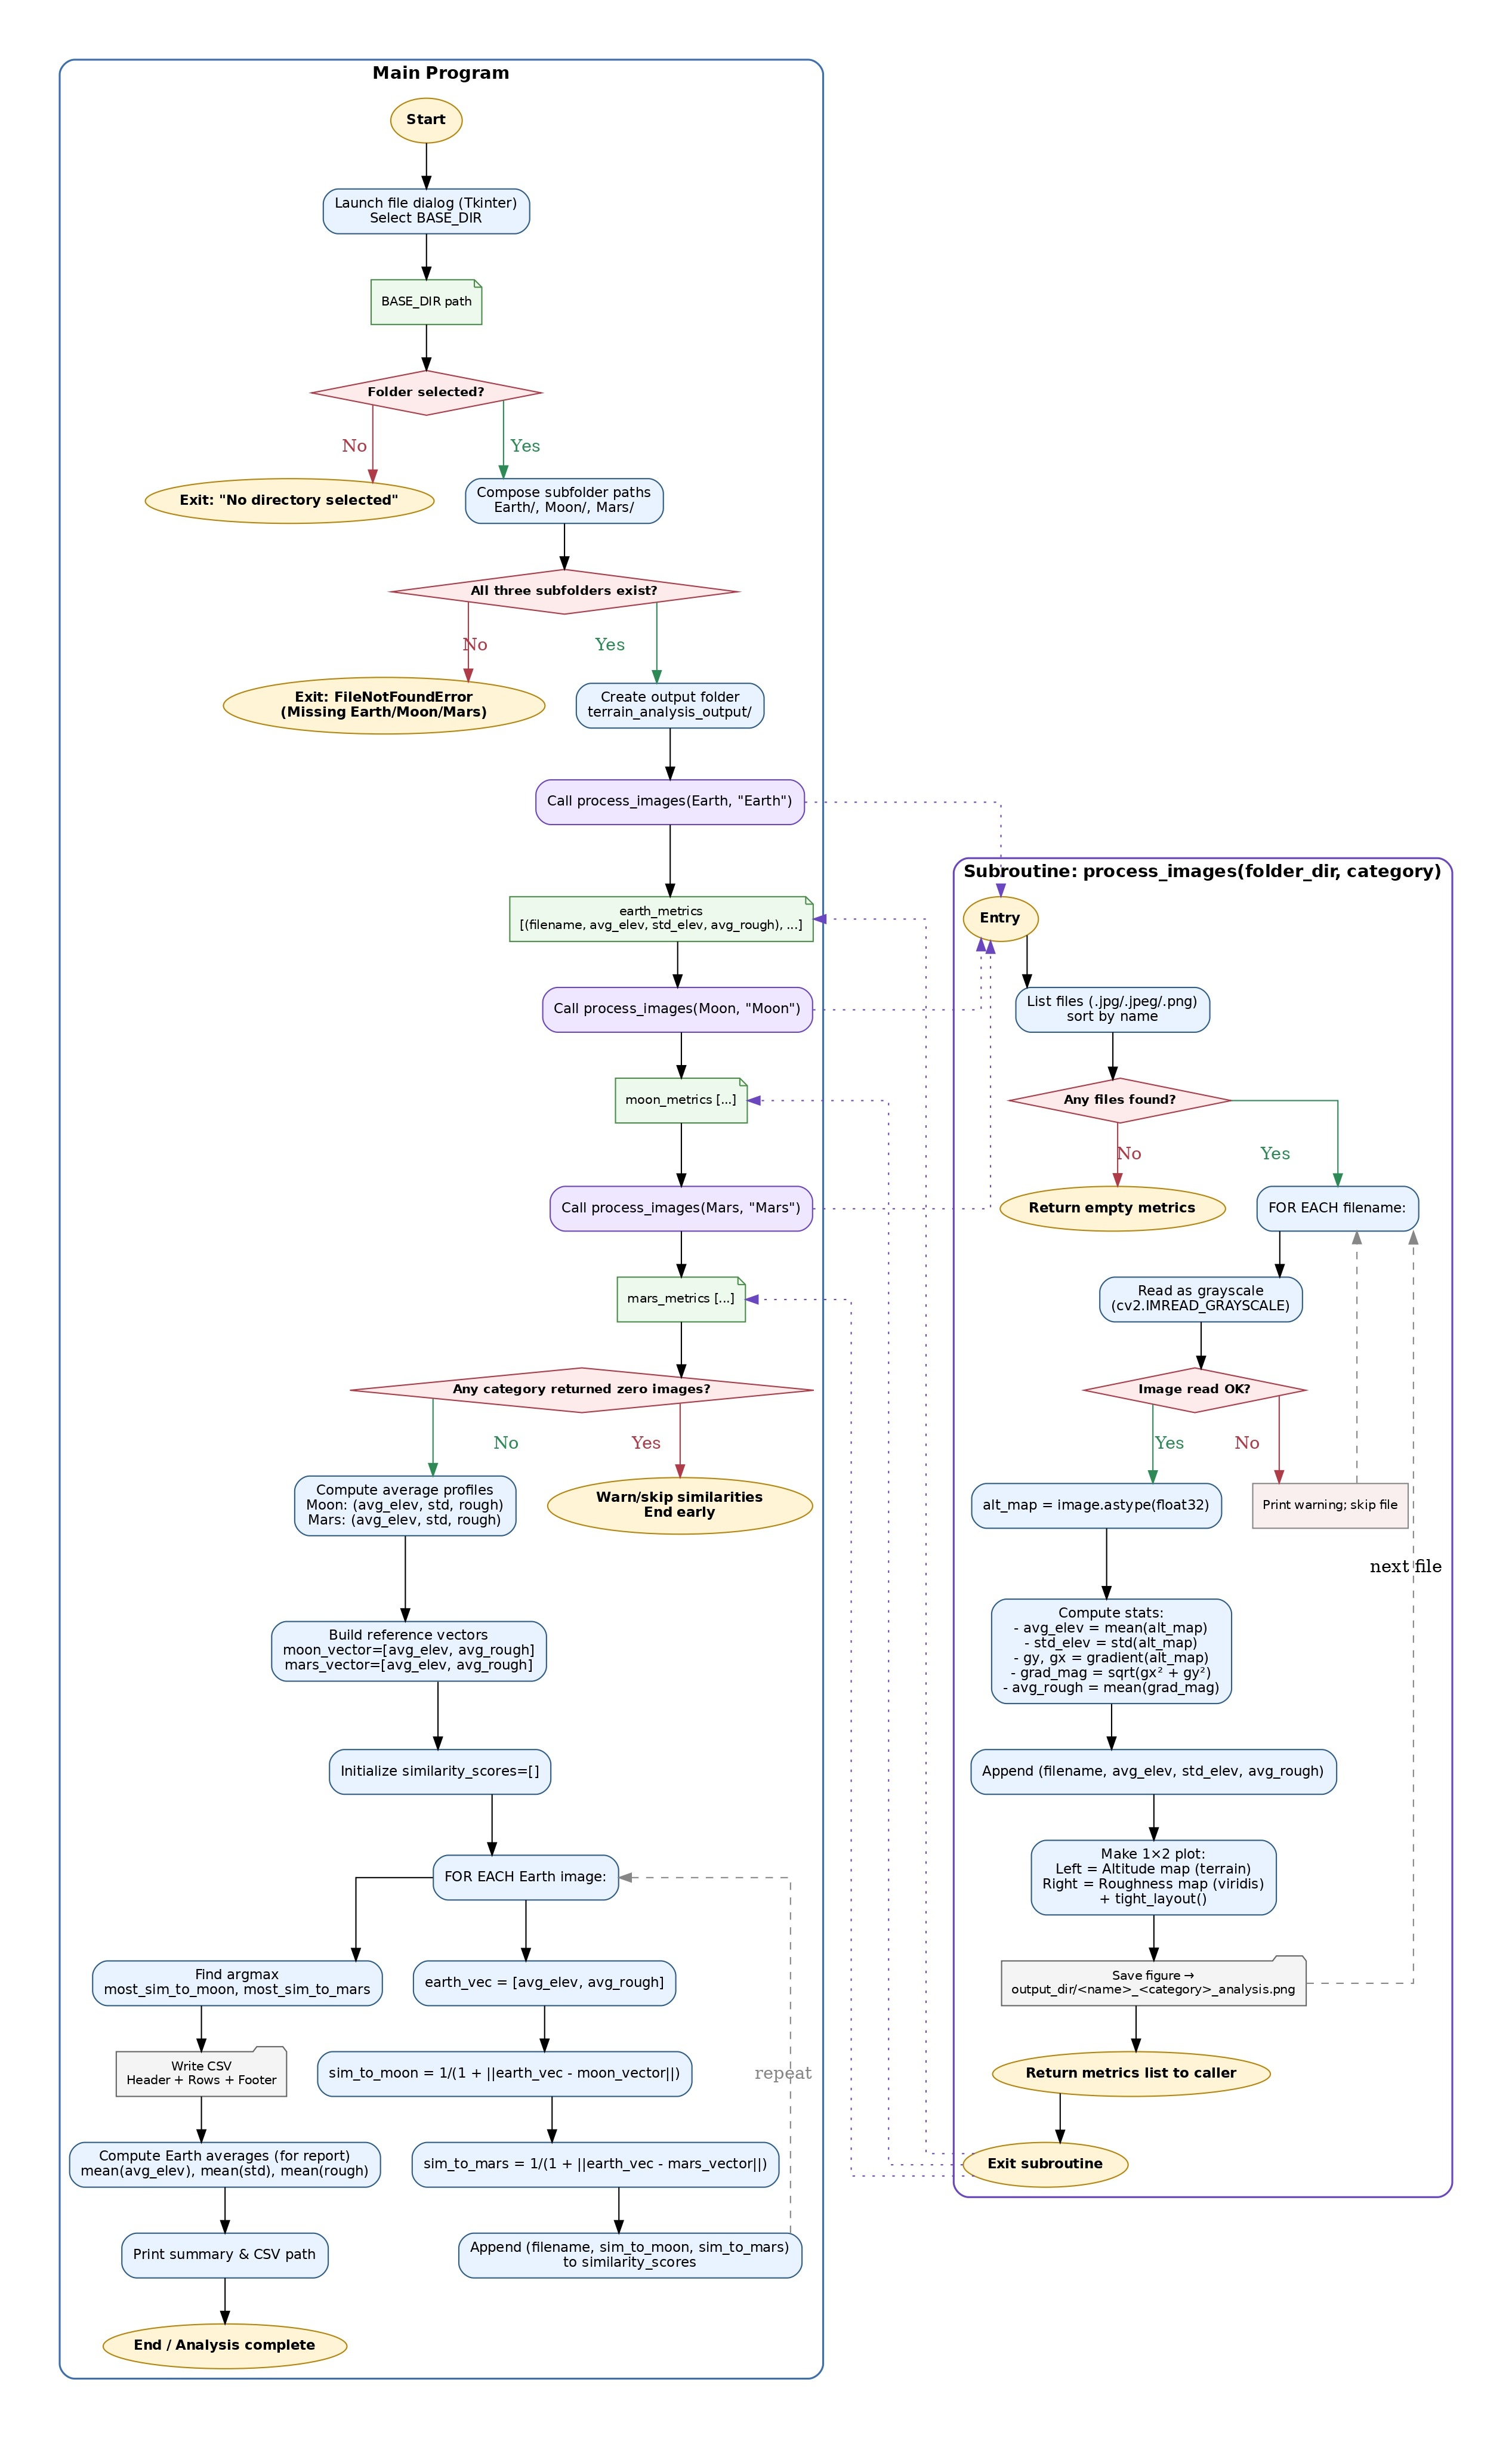
Image Preprocessing
All images were converted to grayscale prior to analysis. Natural-color Earth images were converted using a standard luminance transformation:
![\[I\ =\ 0.299R\ +\ 0.587G\ + 0.114B\,\]](https://nhsjs.com/wp-content/ql-cache/quicklatex.com-d112d6b528e26386bdd3dc2a672faa54_l3.png "Rendered by QuickLaTeX.com")
where R, G, and B denote the red, green, and blue channels, respectively. Lunar and Martian images, which were already grayscale, were processed directly7.
To reduce the influence of absolute illumination differences, grayscale intensities were normalized on a per-image basis using min–max normalization:
![\[I_{norm} =\ (I\ - I_{min}) / (I_{max}\ - I_{min}),\]](https://nhsjs.com/wp-content/ql-cache/quicklatex.com-74457c5986220aa728b1524d6dcd8f72_l3.png "Rendered by QuickLaTeX.com")
where I_min and I_max are the minimum and maximum pixel intensities within the image. This normalization preserves relative spatial variability while discarding absolute brightness offsets. However, normalization alone does not correct for differing illumination geometries or photometric functions; therefore, intensity-based descriptors may still be confounded by phase angle, incidence/emission angles, shadowing, and surface reflectance properties8,9. In the Discussion, I treat these factors as primary limitations and motivate photometric correction as future work8,9.
Image-Derived Metrics
Brightness Variability Index
The brightness variability index (BVI) quantifies spatial heterogeneity in normalized intensity. For each image, the mean and standard deviation of I_norm were computed over all valid pixels. The standard deviation serves as the primary descriptor of brightness variability, while the mean provides a complementary measure of overall tone. Because intensity is influenced by photometric and sensor factors, BVI is treated strictly as a texture/appearance descriptor rather than a physical topography measure8,9.
Roughness Proxy
RP is computed from local intensity gradients. For each pixel p_i, the absolute difference between its intensity and the mean intensity of its 8-connected neighborhood is computed16, and the image-level RP is defined as the mean of these local differences over all valid pixels. Similar local-gradient descriptors are widely used in image texture analysis to quantify edge density and high-frequency spatial variation10,11. RP therefore captures small-scale intensity transitions, but it does not directly measure rover-scale mechanical roughness or hazards without validation against physical ground truth (e.g., DEM-derived slope/roughness or field measurements)8,15.
To assess scale sensitivity, RP was recalculated for a subset of images after downsampling/resampling experiments, confirming that absolute values vary with resolution while relative rankings can remain stable within a narrow, controlled resolution band. This sensitivity motivates reporting resolution metadata and enforcing a common analysis scale15.
Similarity Metric
Similarity between terrestrial and extraterrestrial terrains was evaluated in a four-dimensional feature space consisting of the mean and standard deviation of normalized intensity and the mean and standard deviation of the roughness proxy10:
![\[F\ =\ [mean(I_{norm})\, std(I_{norm})\, mean(RP)\, std(RP)].\]](https://nhsjs.com/wp-content/ql-cache/quicklatex.com-adf7405ca201dd2a1404d119915ae40b_l3.png "Rendered by QuickLaTeX.com")
For each Earth site, a feature vector F_Earth was constructed and compared to the centroid of the Moon and Mars reference feature sets, computed as the mean feature vector across the lunar images and across the Martian images, respectively.
Euclidean distance in this feature space was used as a dissimilarity measure. For clarity, lower distances correspond to higher similarity. Distances were computed between each Earth site and reference feature centroids for the Moon and Mars computed from the corresponding image sets10.
Table 2 reports the computed distances (labeled as “Similarity” in the original draft but interpreted here as distances). To avoid ambiguity, these values should be interpreted as distances d, where smaller d indicates greater similarity.
![\[\text{Similarity Score} = \frac{1}{1 + \sqrt{(E_{\text{avg}} - P_{\text{avg}})^2 + (R_{\text{avg}} - Q_{\text{avg}})^2}}\]](https://nhsjs.com/wp-content/ql-cache/quicklatex.com-30e8551262d69d2f80038f142013d182_l3.png "Rendered by QuickLaTeX.com")
In this formula:
 → The average elevation (altitude) of the Earth image being compared.
 → The average elevation (altitude) of the reference planetary body (Moon or Mars).
 → The average roughness of the Earth image being compared.
 → The average roughness of the reference planetary body (Moon or Mars).
| Earth_Image_Name | Similarity_to_Moon | Similarity_to_Mars |
| Askja_Caldera.jpg | 0.022 | 0.034 |
| Atacama_Desert.jpg | 0.041 | 0.025 |
| Atacama_Desert2.jpg | 0.08 | 0.038 |
| Devon_Island.jpg | 0.186 | 0.06 |
| Mauna_Kea.jpg | 0.028 | 0.05 |
| Meteor_Crater_Arizona.jpg | 0.042 | 0.025 |
| Nevada_Desert.jpg | 0.022 | 0.016 |
| Nevada_Test_Site.jpg | 0.038 | 0.023 |
| Utah_Desert.jpg | 0.07 | 0.038 |
| Wadi_Rum_Jordan.jpg | 0.033 | 0.022 |
Sensitivity Analysis
To assess robustness, a bootstrap resampling analysis was performed. Reference feature centroids for the Moon and Mars were recomputed multiple times with one image removed at each iteration. Earth sites were re-ranked for each resample, and the frequency with which each site achieved the top rank was recorded. This analysis provides a measure of ranking stability and guards against overinterpretation based on small sample sizes17.
Results
Using the defined feature space and Euclidean distance, the framework produces a ranked list of terrestrial sites relative to the lunar and Martian reference centroids. Based on Table 2, Nevada_Desert and Askja_Caldera are among the closest matches to the lunar reference set (distance 0.022), while Nevada_Desert provides the closest match to the Martian reference set (distance 0.016). These rankings should be interpreted strictly as within-dataset ordering of image-texture similarity under the preprocessing pipeline and selected scenes, not as a statement about rover mobility, geology, or mechanical terrain equivalence8,7.
Devon Island is an established operational analog site with extensive prior field use18, but in this specific image-texture dataset it does not rank among the closest matches by the current distance metric2. This discrepancy underscores a key limitation of intensity-based screening: image appearance can be strongly affected by illumination geometry, albedo/composition, and sensor processing choices, and any single curated image set may not represent the full diversity of a region8,9. A more rigorous evaluation would require (i) more comprehensive sampling per region, (ii) standardized acquisition constraints and metadata reporting, and (iii) validation against physics-based or elevation-derived terrain measures8,15.
Discussion
The primary contribution of this study is a lightweight screening baseline that can be applied broadly using widely available imagery. The method is deliberately simple and therefore limited: it reduces each scene to a small set of image-texture summary statistics, which may support early-stage prioritization but cannot replace physics-based terrain assessment and rover engineering evaluation19.
Illumination geometry and photometric response are major confounders. Although per-image min–max normalization reduces absolute brightness offsets, it does not enforce comparable incidence/emission angles or account for bidirectional reflectance effects20. Consequently, differences in I_norm statistics and gradient-derived RP may reflect imaging conditions as much as surface structure. In future work, photometric correction and explicit reporting of illumination metadata would be necessary to strengthen cross-body comparisons.
Resolution dependence is another central limitation. Gradient-based descriptors can change with spatial resolution (m/pixel), and strict comparability requires a controlled spatial scale and explicit resampling strategy12. Additionally, collapsing scenes to mean and standard deviation discards distributional and spatial-correlation information that can matter for rover traversability (e.g., clustered hazards versus diffuse roughness). Future work can incorporate distribution-sensitive texture descriptors (e.g., histograms, percentiles, lacunarity, or multi-scale features) and compare results against elevation-derived slope/roughness from DEM products21,13.
Finally, this framework does not model gravity, regolith mechanics, or wheel–soil interactions, which are critical for rover mobility outcomes and cannot be inferred reliably from intensity texture alone22,23. Therefore, the method should be used only as an initial filter and followed by detailed physical characterization and/or field testing in established analog programs3.
Conclusion
This study presents an image-based framework for preliminary screening of terrestrial rover analog sites using standardized image-texture descriptors computed under a consistent preprocessing pipeline. By operationalizing resemblance as proximity in a defined feature space and assessing ranking stability through resampling, the method provides a transparent, low-cost way to prioritize candidate sites for deeper investigation. However, because illumination, sensor differences, and spatial resolution can strongly influence intensity-derived descriptors, and because key physical factors for mobility (e.g., gravity and wheel–soil mechanics) are out of scope, the framework should be treated as an initial screening tool rather than a standalone decision method. Future work should add full per-image metadata for reproducibility, apply photometric correction where possible, and validate similarity rankings against DEM-derived roughness/slope measures and established analog-site findings.
References
- Foing BH, Stoker C, Zavaleta J, Ehrenfreund P, Thiel C, Sarrazin P, et al. Field astrobiology research in Moon–Mars analogue environments: instruments and methods. Int J Astrobiol. 2011;10(3):141-160. doi:10.1017/S1473550411000036. [↩] [↩] [↩]
- Lee P, Osinski GR. The Haughton-Mars Project: overview of science investigations at the Haughton impact structure and surrounding terrains, and relevance to planetary studies. Meteorit Planet Sci. 2005;40(12):1755-1758. doi:10.1111/j.1945-5100.2005.tb00144.x. [↩] [↩] [↩] [↩] [↩]
- Barfoot TD, Furgale PT, Osinski GR, Ghafoor N, Williams K. Devon Island as a proving ground for planetary rovers. In: Angeles J, et al., eds. Brain, Body and Machine. Advances in Intelligent and Soft Computing. Berlin: Springer; 2010;83:277-288. doi:10.1007/978-3-642-16259-6_21. [↩] [↩]
- Azua-Bustos A, Gonzalez-Silva C, Mancilla RA, Salas L, Gomez-Silva B, McKay CP, Vicuna R. Hypolithic cyanobacteria supported mainly by fog in the coastal Atacama Desert of Chile. Microb Ecol. 2011;61(3):568-581. doi:10.1007/s00248-010-9784-z. [↩]
- Arvidson RE, Squyres SW, Bell JF, Catalano JG, Clark BC, Crumpler LS, De Souza PA, Fairen AG, Farrand WH, Fox VK, Gellert R, Golombek MP, Grant JA, Guinness EA, Herkenhoff KE, Iagnemma KD, Johnson JR, Lindemann RA, McGovern JA, Morris RV, Moersch JE, Mittlefehldt DW, Parker TJ, Rice MS, Schroder C, Shepard MK, Stroupe DD, Sullivan RJ, Thompson SD, Wolff MJ, Wray JJ, Zlotkin S. Ancient aqueous environments at Endeavour Crater, Mars. Science. 2014;343(6169):1248097. doi:10.1126/science.1248097. [↩]
- Neumann GA, Zuber MT, Wieczorek MA, Head JW, Baker DMH, Solomon SC, Smith DE, Lemoine FG, Mazarico E, Sabaka TJ, Goossens SJ, Melosh HJ, Phillips RJ, Asmar SW, Konopliv AS, Williams JG, Sori MM, Soderblom JM, Miljkovic K, Andrews-Hanna JC, Nimmo F, Kiefer WS. Lunar impact basins revealed by Gravity Recovery and Interior Laboratory measurements. Sci Adv. 2015;1(9):e1500852. doi:10.1126/sciadv.1500852. [↩]
- Yingst RA, Cohen BA, Hynek BM, Schmidt ME, Schrader C, Rodriguez A. Testing Mars Exploration Rover-inspired operational strategies for semi-autonomous rovers on the moon II: The GeoHeuristic Operational Strategies Test in Alaska. Acta Astronaut. 2014;99:24-36. doi:10.1016/j.actaastro.2014.01.019. [↩] [↩] [↩] [↩]
- McEwen AS. Photometric functions for photoclinometry and other applications. Icarus. 1991;92(2):298-311. doi:10.1016/0019-1035(91)90053-V. [↩] [↩] [↩] [↩] [↩] [↩] [↩] [↩] [↩] [↩] [↩] [↩] [↩] [↩]
- Chen C, Qin Q, Chen L, Zheng H, Fa W, Ghulam A, Zhang C. Photometric correction and reflectance calculation for lunar images from the Chang’E-1 CCD stereo camera. J Opt Soc Am A. 2015;32(12):2409-2422. doi:10.1364/JOSAA.32.002409. [↩] [↩] [↩] [↩] [↩] [↩]
- Haralick RM, Shanmugam K, Dinstein I. Textural features for image classification. IEEE Trans Syst Man Cybern. 1973;SMC-3(6):610-621. doi:10.1109/TSMC.1973.4309314. [↩] [↩] [↩] [↩] [↩]
- Gonzalez RC, Woods RE. Digital Image Processing. 4th ed. New York, NY: Pearson; 2018. [↩] [↩]
- Kreslavsky MA, Head JW. Kilometer-scale roughness of Mars: Results from MOLA data analysis. J Geophys Res Planets. 2000;105(E11):26695-26711. doi:10.1029/2000JE001259. [↩] [↩]
- Cord A, Baratoux D, Mangold N, Martin P, Pinet P, Greeley R, Costard F, Masson P, Foing B, Neukum G. Surface roughness and geological mapping at subhectometer scale from the High Resolution Stereo Camera onboard Mars Express. Icarus. 2007;187(2):348-373. doi:10.1016/j.icarus.2006.10.004. [↩] [↩]
- Malin MC, Edgett KS. Mars Global Surveyor Mars Orbiter Camera: Interplanetary cruise through primary mission. J Geophys Res. 2001;106(E10):23429-23570. doi:10.1029/2000JE001455. [↩] [↩] [↩] [↩]
- Smith DE, Zuber MT, Neumann GA, Lemoine FG, Mazarico E, Torrence MH, et al. Initial observations from the Lunar Orbiter Laser Altimeter (LOLA). Geophysical Research Letters. 2010;37(18):L18204. doi:10.1029/2010GL043751. [↩] [↩] [↩] [↩]
- Rosenburg MA, Aharonson O, Head JW, Kreslavsky MA, Mazarico E, Neumann GA, Smith DE, Torrence MH, Zuber MT. Global surface slopes and roughness of the Moon from the Lunar Orbiter Laser Altimeter. J Geophys Res Planets. 2011;116(E2):E02001. doi:10.1029/2010JE003716. [↩]
- Efron B, Tibshirani RJ. An Introduction to the Bootstrap. New York, NY: Chapman & Hall/CRC; 1993. [↩]
- Osinski GR, Spray JG, Lee P. Impactites of the Haughton impact structure, Devon Island, Canadian High Arctic. Meteorit Planet Sci. 2005;40(12):1789-1812. doi:10.1111/j.1945-5100.2005.tb00147.x. [↩]
- Zakrajsek JJ, McKissock DB, Woytach JM, Zakrajsek JF, Oswald FB, McEntire KJ, Hill CM, Abel P, Eichenberg DC, Goodnight TW. Exploration rover concepts and development challenges. AIAA Space. 2005:2525. doi:10.2514/6.2005-2525. [↩]
- Hapke B. Bidirectional reflectance spectroscopy: 1. Theory. J Geophys Res Solid Earth. 1981;86(B4):3039-3054. doi:10.1029/JB086iB04p03039. [↩]
- Kreslavsky MA, Head JW, Neumann GA, Rosenburg MA, Aharonson O, Smith DE, Zuber MT. Lunar topographic roughness maps from Lunar Orbiter Laser Altimeter (LOLA) data: Scale dependence and correlation with geologic features and units. Icarus. 2013;226(1):52-66. doi:10.1016/j.icarus.2013.01.034. [↩]
- Iagnemma K, Kang S, Shibly H, Dubowsky S. Online terrain parameter estimation for wheeled mobile robots with application to planetary rovers. IEEE Trans Robot. 2004;20(5):921-927. doi:10.1109/TRO.2004.829462. [↩]
- Shepard MK, Campbell BA, Bulmer MH, Farr TG, Gaddis LR, Plaut JJ. The roughness of natural terrain: A planetary and remote sensing perspective. J Geophys Res Planets. 2001;106(E12):32777-32795. doi:10.1029/2000JE001429. [↩]


 and Family-Integrated Care (FIC): Global Trends and Local Provider Awareness in Fresno County, California")