
Abstract
CO₂ emissions are a major contributor to global warming. Among different sources of CO₂ emissions, home electronic usage has increased rapidly in recent decades. This paper investigates the impact of household electronic usage on CO₂ emissions using a localized, device-specific analysis focused on Aliso Viejo, California, where technology usage patterns may differ from national norms due to socioeconomic and lifestyle factors. This study examines two main contributors. First, direct household electronic usage was evaluated through survey data and converted to emissions. Second, indirect emissions associated with servers and networks were estimated using metadata from peer-reviewed studies. The methodology is based on a quantitative, non-experimental approach that examines the electronic device usage and calculates associated CO₂ emissions. The results indicate that direct emissions from household electronic devices account for approximately 64.4% of electronic device related CO₂ emissions. Indirect emissions associated with shared server infrastructure make up approximately 35.6 %. These findings imply that direct and indirect emissions linked to household digital activity play a notable role in environmental sustainability. This also suggests that energy reduction efforts should extend beyond typical household appliances to include everyday electronic device usage.
Keywords: Hardware devices, software, server, home electronics, CO2 emission, global warming, correlational analysis, metadata analysis.
Introduction
CO₂ emission has negatively affected the Earth resulting in global warming. The extreme usage of fossil fuels in transportation and manufacturing has been the main culprit of CO₂ emissions. It is important to clarify that CO₂ contributes to global warming via the greenhouse effect. However, it does not deplete the ozone layer; ozone depletion is caused primarily by CFCs and similar chemicals. CFCs and other similar chemicals have caused the ozone layer to deplete1, a government-published journal by NASA states that the ozone layer is like a shield between the Earth and the Sun filtering UV radiation. Over time humans have poked a hole in it from the extreme use of gasses. The CO₂ emission causes the greenhouse effect, which traps the heat energy around the Earth. This is the leading cause of global warming, heating the Earth, and thereby increasing the average temperature. The CO₂ emission is mainly driven by daily activities. However, massive usage of electronic devices and servers with high electric power consumption has been overlooked as one of the major causes of CO₂ emission in the recent century. This study focuses only on operational emissions from electronic devices and servers, while recognizing that lifecycle emissions from device manufacturing, transportation, and disposal also contribute to total household CO₂, these are outside the scope of this analysis as this paper only focuses on operational aspects. The long-term effect is inevitable unless preventive measures are taken.
Here are the key terms frequently used throughout this paper. Hardware devices are any communication or computation device. They are the physical components of electronic devices. Examples of hardware devices are computer keyboards, monitors, printers, flash drives, and projectors. Software is any instruction or program that performs operations and specific functions based on the user’s commands. Chrome and Safari are examples of software. Watt is the unit of measurement for power, specifically the rate at which energy is transferred or used. A kilowatt hour measures the electrical energy equivalent to power consumption of 1,000 watts in 1 hour. A server is a powerful computer that processes, stores, and transfers data to other devices through a network, such as websites, apps, or streaming services. Home electronics are technological devices that are primarily used in households, including, but not limited to, phones, televisions, game consoles, iPads/tablets, etc. Please note that one gigabyte is one billion bytes. These terms are general physics and electrical definition. The definitions clarify that this study focuses on direct operational use and excludes lifecycle and embodied emissions unless otherwise noted.
Consumer electronics account for a significant amount of residential energy consumption.2, a peer-reviewed study examines residential energy usage and estimates that approximately 20% of greenhouse gas emissions in the United States come from the residential sector. This highlights the significance of household energy consumption in national emissions2, organizes the carbon emission levels by geography, income level, and housing characteristics. The broader national patterns and the significance of targeting household behaviors are crucial for contextualizing this research’s localized study.
Similarly3, a peer-reviewed study, uses a nationwide survey to collect primary data on household energy consumption, transportation, and waste practices within Ireland3 calculated the CO₂ emission using a standardized conversion formula and found that an average Irish household emits 10.4 tonnes of CO₂ annually. Transportation and heating were the largest contributors. These studies are cited to justify methodology and conversion factors. However, local device and household characteristics may differ due to geographical location which is addressed in the survey designed for Aliso Viejo4, a peer-reviewed journal, analyzed the global household energy trends4 surveyed various studies on energy conservation while examining their behavioral involvement, technology adoptions, and feedback systems. This links behavioral changes to CO2 emission outcomes, a key component measured in this paper through electronic usage.
Hardware devices are not the only contributors to electronic CO2 emissions. Electronics must connect to servers to operate. As a result, servers also play a role in the carbon footprint of electronic devices5, a study from the Summit on the Future of Energy Security, a high-level event hosted by the UK government and the International Energy Agency, evaluates the environmental impact of streaming. It estimates that 36 grams of CO2 are produced per hour from video streaming in 2019. This is useful for this paper as server emissions will be examined6, a study from Simon Fraser University Burnaby, Canada, discusses the complexities of carbon footprint calculation in correlation with streaming media and looks at the environmental impact beyond the carbon output. It looks into content delivery networks, data storage, and the infrastructure of streaming. This may be used to broaden this paper’s argument beyond just emission data. Additionally7, a peer-reviewed article from Uppsala University, focuses on server energy usage during data processing, and maintenance. This is significant for this paper because the connection between home electronics and servers is data processing. In both aforementioned studies, the specifics of the findings might vary from a U.S. base research due to geographical differences. However, the general outcome is a valuable benchmark to support this paper.
Behavioral patterns play an important role in household energy consumption, especially in digital technologies 8, a peer-reviewed journal article uses metadata to explore the behavioral economics of why people waste or conserve energy. It examines decision-making trends and feedback loops that support user responsibility and intervention potential. Likewise9, a peer-reviewed journal published by the University of Southern Queensland, Australia, explored the relationship between economic prosperity and energy consumption. This study analyzed national-level data over time as researchers identified the increase in economic activity associated with changes in energy usage and carbon emission. This highlights the importance of consumer behavior and economic factors while understanding the broader environmental impact of data-driven perspectives. However, the specifics of the Australian university findings might vary from the potential U.S. results due to geographical differences.
While direct electronic usage contributes to a significant amount of carbon emissions, the embodied emissions also contribute to a notable amount of the footprint10, a peer-reviewed academic journal that studies the life cycle of carbon emissions from laptops, desktops, and smartphones. It found that newer devices have 50-60% lower emissions compared to older counterparts. Production plays a notable role in the total emission in electronics which aligns with this paper. Moreover11, a peer-reviewed article, evaluates the carbon footprint of electronic device manufacturing like smartphones and tablets. It emphasizes the significance of looking at the entire lifecycle of these producers and including the raw materials and logistics as factors. In alignment with10,11,12, a peer-reviewed article from the University of Oxford, analyzed the full lifecycle of IT equipment like computers and desktops. This study highlights the fact that the emission caused by the production of electronic devices is substantially greater than the emission from the use of the devices. This underscores the importance of the environmental impact of digital technologies that extend beyond daily usage. The link between industrial production and user habits reinforces the need to evaluate the lifecycle of electronic devices and their impact on the environment.
Previous publications, such as3,12, have provided valuable insights into household emissions and the environmental impact of electronics. They mostly focused on national averages or broader categories like transportation, heating, and general energy consumption. However, there is a noticeable gap in localized, device-specific data, particularly in regions like Aliso Viejo, where patterns of technology usage may differ from national norms due to socioeconomic and lifestyle factors. This research aims to fill this gap by focusing specifically on the CO₂ emissions generated by everyday electronic devices and servers within households in Aliso Viejo. This led to the research question “How much operational CO₂ emission is associated with direct digital device consumption and indirect data usage?”. This study’s goal is to bring awareness to how common household electronic devices play a role in the overall CO2 emission of households13, a peer-reviewed journal from the University of California Irvine, explains that CO2 emission levels from electronic devices and their associated electronic waste have increased by 53% from 2014 to 2020. Based on this, this study hypothesizes that a significant amount of household CO2 emission comes from the usage of electronic devices. Nevertheless, this study has a few limitations. First being that it was solely focused on one particular region, Aliso Viejo, California. Therefore, the findings may not accurately represent regions with different energy sources and lifestyles. Second, the power consumption of electronic devices may vary due to the variation of electronic devices. However with accurate estimations this can be accounted for. This paper utilizes a non-experimental, quantitative design that examines the relationship between household electronic device usage and CO2 emissions in Aliso Viejo, CA. The data will be collected through a structured survey distributed to students. The survey is stored in a secure location with password protections to ensure the safety of the respondents. The survey gathers information on the daily usage of devices such as computers, phones, tablets, game consoles, and televisions. Subsequently, the average daily energy consumption, both direct and indirect, will be calculated using conversion factors and the calculated wattage data of each device. This methodology will analyze both direct and indirect emissions associated with household electronic device usage.
Method
This paper aims to answer the question, “How much operational CO₂ emission is associated with direct digital device consumption and indirect data usage?” This methodology is a non-experimental, quantitative study. A non-experimental study refers to looking at the natural relationship between two existing factors. In this case, those two factors would be electronic usage and CO₂ emission. This method solely uses quantitative data, which refers to numerical information that can be measured and analyzed statistically. While the study is non-experimental, descriptive statistics and ranges will be provided for each variable to allow meaningful interpretation of patterns and to quantify uncertainty in the survey data.
The first part of this method is the collection of household electronic usage, which is going to be obtained from surveys3, a peer-reviewed study, used a survey to collect quantitative data on students’ household usage of home electronics throughout the day. This survey will be conducted in Aliso Viejo, CA, for the purpose of collecting an electronics usage sample representing national averages rather than regional. Households will receive QR codes in their mailbox or through their teachers at school. Scanning the QR code would take the participants to the five survey questions on a Google Form. The online survey will include consent forms, debriefing forms, and questions about five specific electronics: computers, phones, game consoles, TVs, and iPads/tablets. An example of the survey question is “How many hours per day does your household cumulatively use a computer at home?” (Please refer to Appendix for more details). For clarity, the full survey and consent form are included in the Appendix.
Ethical considerations will be accounted for as participants may withdraw from answering any questions in the survey at any point. This preserves their rights during the process. The data collected will be used anonymously, as it will not include any personal information or names, ensuring complete confidentiality. All data will be stored securely on a password-protected platform for privacy. All the data and contents related to this paper are archived in an external storage unit (a flash drive) which does not require any ongoing maintenance. By removing the data from a live storage platform (like a cloud storage) the environmental impact of digital storage related to this paper has been minimized. The survey will be administered virtually.
After obtaining data from the participants regarding the five electronic devices, the average usage of each device was calculated. This was done by summing all reported daily usage hours for each specific device and dividing by the sample size of 46. The calculated mean value of the daily collective household usage was 15.53 hours for computers, 17.76 hours for smartphones, 1.89 hours for iPads/tablets, 4.73 hours for televisions, and 0.98 hours for game consoles. Descriptive statistics such as the sample size, mean, median, standard deviation, minimum, and maximum were calculated and presented on Table 1.
| Device | Sample Size | Mean (hrs/day) | Median | Standard Deviation | Minimum | Maximum |
| Computer | 46 | 15.53 | 10.5 | 17.52 | 1.0 | 110 |
| Smartphone | 46 | 17.76 | 13.5 | 14.04 | 2.0 | 90 |
| Ipad/Tablet | 46 | 1.89 | 1.0 | 2.30 | 0.0 | 10 |
| TV | 46 | 4.73 | 3.0 | 5.47 | 0.0 | 30 |
| Game Console | 46 | 0.98 | 0.0 | 2.22 | 0.0 | 13 |
The next step was to determine the average operational power consumption for each electronic device. Unlike manufacturing labels that typically report maximum rated or charging power rather than real-world operational usage, in this approach, peer-reviewed sources are used which report more accurate annual energy consumption under realistic usage conditions. Based on this method, the estimated average operational power consumption was 106 W for desktop computers14, 4.1 W for smartphones15, 11 W for iPads/tablets15, 103 W for televisions16, and 140 W for game consoles14.
Direct Electronic Usage Emissions Formulas
After obtaining the average daily usage hours and the average operational power consumption for each electronic device, the following equations were used to calculate electrical energy consumption.
(1) 
where E is the electrical energy consumption, p denotes the average power consumption and t stands for the time. In order to obtain the energy in kWh (kilowatt hour), we need to divide the product of power in Watt and time in hour by 1000 or equivalently
(2) 
After calculating the daily average energy for each device, it will be multiplied by 30 to get the monthly energy and subsequently by another factor of 12 to obtain the annual energy. In order to convert the energy to CO2 emission, a conversion factor is needed. This can be specified as
(3) 
where c is the conversion factor to convert E (energy) to the CO₂ emission. As Southern California Edison derived in17, the conversion factor, c, is approximately 0.2502 kilograms per kilowatt hours. Depending on the time duration, the energy can be specified as the daily, monthly, or the annual average consumption. The following equation will be used. Therefore, to calculate the annual CO₂ emission we can use the following equation
(4) 
or equivalently:
(5) 
where Edaily denotes the average daily electrical energy consumption in kilowatt hour and annual emission will be in kilograms.
Below is a worked example with units to illustrate step-by-step calculations from hours × watts to kWh to kg of CO₂.
This example will be for computers. The daily average usage of computers, 15.53 hours, is multiplied by the average watt usage which is 106 watts. The product is 1,646.18 W. From there 1,646.2 W is divided by 1000 to get the kWh. The quotient of that is 1.6462 kWh. Next to get the monthly energy consumption of computers I multiplied 1.64618 by 30 days to get 49.40 kWh/month. To get the annual kWh multiple 49.40 kWh/month by 12 months to get 592.8 kWh/year. Next the conversion factor of 0.2502 is multiplied by 592.7 kWh/year to get 148.2 kg of CO₂ per year.
Indirect Server Emission Formulas
Thus far, I have derived direct energy usage of household electronics in the calculations above. Indirect energy usage from servers will be calculated in this subsection. A notable contributor to household CO₂ emissions is the energy consumption of servers and network infrastructures that support user data usage. Servers and digital networks support various household devices simultaneously thus following calculations represent an estimated upper-bound of server energy per household. Therefore, the outcome does not imply a complete allocation of server or digital infrastructure to a single household device. Instead they illustrate a methodological approach to estimate potential upper-limit operational CO₂ emission associated with digital usage.
Metadata is the only form of data that can be used for this study as measuring direct server energy usage is considerably complicated and impractical for this study. Metadata is the background data collected from online sources. This was used for the server energy usage and data consumption to support and calculate the server-based activities like cloud storage and streaming8, a peer-reviewed study, used metadata to explore energy usage patterns. Metadata is advantageous for calculating server energy utilisation since direct measurements are not practical at the household level. Also, using standardized metadata facilitates more accurate estimates of server-related CO₂ emissions in everyday digital activities, cloud storage, streaming, and other data activities.
An estimate of household data usage is needed to calculate server energy consumption. Allconnect, a company that consumers use to compare internet providers, reports that an average household consumes roughly 652 gigabytes per month18. According to a peer-reviewed study, each gigabyte of data processed by servers is estimated to require 0.06 kWh of electrical energy19,20, another peer-reviewed study, suggests that the range of kWh to gigabytes is between 0.047 to 1.0 kWh per gigabyte. Therefore 0.06 kWh per gigabyte seems to be a reasonable conversion factor as it also falls within the range of 0.047 and 1.0 kwh per gigabyte. These values are upper-bound estimates and actual kWh per GB may vary depending on content delivery networks, caching, and shared infrastructure. Limitation of this will be further discussed in the Discussion section.

or
(6) 
Using equation (3),

the annual server CO2 emission for a household will be
(7) 
Statistical Descriptions
Descriptive statistics including the mean, median, standard deviation, minimum, and maximum were calculated for each device category as shown in Table 1. The 95% confidence intervals for the mean of each electronic device were also calculated using the t-distribution with 45 degrees of freedom as population standard deviation was unknown and sample standard deviation was used instead based on a peer-reviewed study21 Please refer to equation 8 for the 95% confidence interval equation:
(8) 
Result
A total of 46 participants completed the survey. This sample size is appropriate for an exploratory, non-experimental quantitative study that aims to estimate the usage patterns and the corresponding environmental impacts. A scientific research publication, uses small to moderate sample sizes when the objective is to describe trends and summarize real-world behavior22. A sample of 46 participants provides sufficient data for the scope of this study within a defined region.
The survey included households ranging from 2 to 5 members. Device usage data was normalized by the number of people per household to provide per-capita usage estimates. As shown in Table 2, the top row lists the five electronic devices that participants were surveyed about. In each column, the hourly data is reported below to the corresponding electronic device. The number in the parenthesis specifies the frequency of the sample if reported (e.g., 20 (4) means that four participants reported 20 hours of household usage). It should be noted that survey responses are self-reported, which may introduce recall bias. Standard deviations, medians, and ranges are reported to account for the variability and potential reporting errors of the survey data.
| Computer (hrs) | Smartphones (hrs) | iPads/Tablets (hrs) | TV’s (hrs) | Game Console (hrs) |
| 20 (5) | 20 (5) | 0 (18) | 2 (7) | 0 (31) |
| 10 (4) | 11 (1) | 4 (4) | 4 (9) | 2 (3) |
| 6 (2) | 22 (1) | 1 (8) | 3 (5) | 1 (5) |
| 16 (3) | 12 (4) | 5 (4) | 6 (2) | 4 (2) |
| 8 (4) | 25 (2) | 6(1) | 0 (3) | 3 (1) |
| 7 (4) | 4 (1) | 2 (7) | 5 (2) | 5 (1) |
| 30 (1) | 8 (3) | 3 (2) | 1 (5) | 3.5 (1) |
| 18 (1) | 18 (1) | 10 (1) | 10 (3) | 13 (1) |
| 15 (3) | 14 (1) | 7 (1) | 8 (3) | 1.5 (1) |
| 4 (4) | 15 (2) | 20 (1) | ||
| 110 (1) | 10 (8) | 1.5 (1) | ||
| 35 (1) | 13 (1) | 30 (1) | ||
| 26 (1) | 90 (1) | 15 (1) | ||
| 25 (1) | 32 (1) | .2 (1) | ||
| 60 (1) | 30 (5) | 2.5 (2) | ||
| 13 (2) | 24 (2) | |||
| 9 (1) | 5 (2) | |||
| 1 (1) | 3 (1) | |||
| 11 (1) | 2 (1) | |||
| 17 (1) | 29 (1) | |||
| 5 (2) | 6 (1) | |||
| 12 (1) | 33 (1) | |||
| 3.5 (1) |
Descriptive Statistics
The descriptive statistics of direct electronic device usage is provided for variability and distribution. These calculations were based on a sample size of 46 for each device category.
According to Table 1 in the Method section, the mean daily usage of computers was 15.53 hours, median of 10.5 hours, standard deviation 17.52 and a range of 1–110 hours. According to equation 8 the 95% confidence interval for the mean was 10.34 to 20.72 hours. For smartphone usage the mean was 17.76 hours per day, a median of 13.5 hours, standard deviation of 14.04, and a range of 2–90 hours. The 95% confidence interval was 13.60 to 21.92 hours. IPads/tablets had a mean of 1.89 hours, a median of 1.0 hour, a standard deviation of 2.30, and a range of 0–10 hours. The 95% confidence interval was 1.21–2.57 hours. The television usage mean was 4.73 hours, a median of 3.0 hours, standard deviation of 5.47, and a range of 0–30 hours. The 95% confidence interval was 3.11–6.35 hours. Lastly, the game console usage mean was 0.98 hours, a median of 0 hours, standard deviation of 2.22, and a range of 0–13 hours. The 95% confidence interval was 0.32–1.64 hours.
The computer and smartphone usage distributions were positively skewed based on the maximum values exceeding the medians. This indicates the data included a small number of high-use households which overall increased the average usage for these two electronic device categories.
Daily Electronics Device Usage and Monthly Energy
The calculated mean daily collective household electronic usage was 15.53 hours for computers, 17.76 hours for smartphones, 1.89 hours for iPads/tablets, 4.73 hours for televisions, and 0.98 hours for game consoles. Using the average operational power consumption values established in the methodology, these usage levels correspond to an estimated monthly energy consumption of 49.4 kWh for computers, 2.18 kWh for smartphones, 0.62 kWh for iPads/tablets, 14.6 kWh for televisions, and 4.11 kWh for game consoles. Table 3 summarizes the average daily usage derived from the survey data and the corresponding monthly energy consumption for each electronic device.
| Daily Usage (hours) | Monthly (kWh/month) | |
| Computers | 15.53 | 49.40 |
| Smart- phones | 17.76 | 2.18 |
| iPads/Tablets | 1.89 | 0.62 |
| TV’s | 4.73 | 14.60 |
| Game Console | 0.98 | 4.11 |
Annual Electronic Device CO₂ Emissions
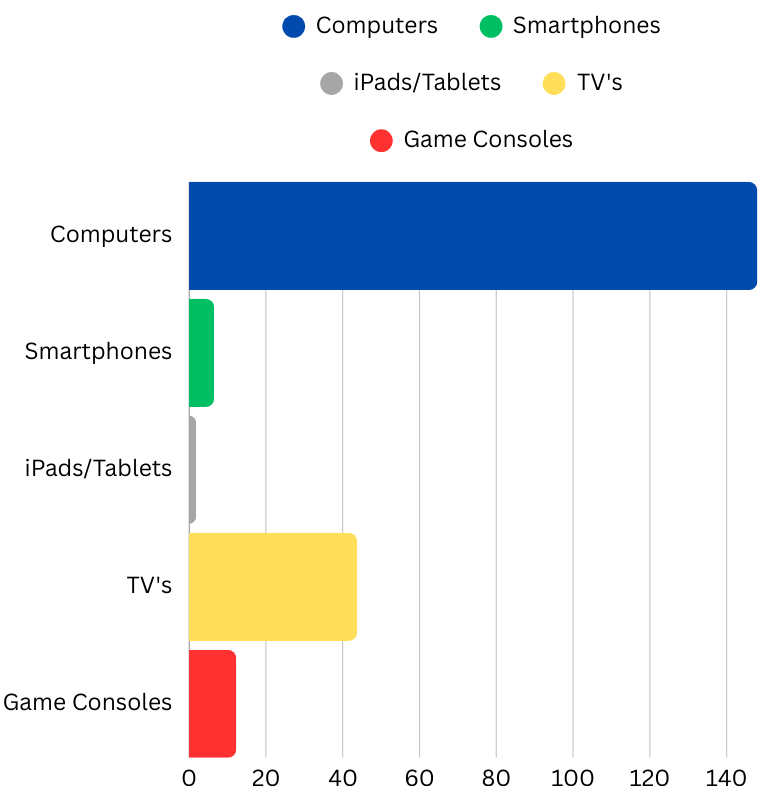
After multiplying the monthly energy consumption of each electronic device by 12 and applying the CO₂ conversion factor of 0.2502 kg/kWh, the annual CO₂ emissions for each device were calculated. Figure 1 summarizes the calculation by showing that computers produce approximately 148.2 kg of CO₂ per year, smartphones 6.55 kg, iPads/tablets 1.86 kg, televisions 43.8 kg, and game consoles 12.3 kg annually.
Annual Household CO₂ Emission
A Boston-based company23 that compares clean energy products like solar, estimated that an average household in Orange County, California consumes 11,676 kWh annually in 2026. Aliso Viejo is a city in Orange County, CA. Using equation (3) from the method section, the annual household CO₂ emission is 2,921 kg.
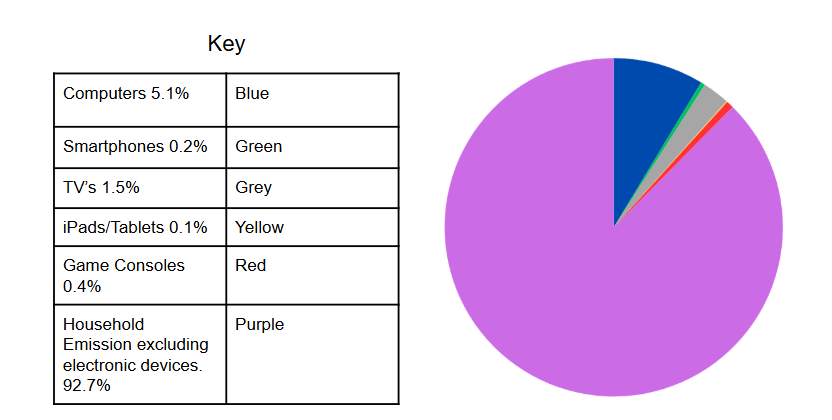
This study estimated that 212.7 kg of CO₂ per year comes from electronic devices. Therefore the household CO₂ emission excluding electronics is 2,709 kg annually. Figure 2 below illustrates the direct CO₂ emission of an average household in Aliso Viejo, CA. The purple represents the CO₂ emission of a household excluding home electronics, making up 92.7% of the total. The blue represents the CO₂ emission from computers, accounting for 5.1%. Smartphones make up 0.2% of the total and are shown in green. The grey represents the televisions, which account for 1.5%. The thin yellow line represents the CO₂ emission of iPads/tablets per household at 0.1%, and game consoles make up 0.4% of the total, shown in red.
Indirect and Direct CO₂ Emission
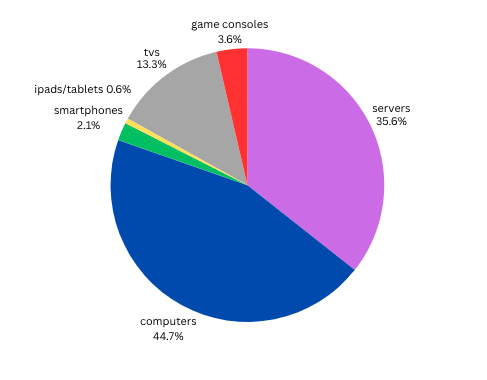
Figure 3 compares the CO₂ emissions from servers to household electronics usage. Using equation (7), the total CO₂ emission for servers was calculated to be 118 kg per year. This accounts for 35.6% and is shown in purple. The estimated server emissions may be significantly lower due to economies of scale and shared usage across multiple users. Household electronics emit approximately 212.7 kg of CO₂ annually and account for 64.4%. Among electronics, computers contribute 148.2 kg that 44.7% shown in blue. For televisions 43.8 kg is represented in grey and is 13.3%. Smartphones 6.55 kg is 2.1% and in green. Game consoles produce 12.3 kg of CO2 and make up 3.6% shown in red. Lastly the thin yellow line is iPads/tab and they produce 1.86 kg making up 0.6% of the total. The reported emissions here refer exclusively to direct and indirect operational energy usage, and no emissions from device production or disposal are included in these calculations.
The results provide valuable insight into the research question: “How much operational CO₂ emission is associated with direct digital device use and indirect data usage?” This paper calculated the average electricity consumption for a household in Aliso Viejo, California, is about 11,676 kWh annually23. Using equation 3, kWh times the conversion factor of 0.2502 kg CO₂ per kWh, the total CO₂ emissions from household electricity consumption were estimated to be 2,701 kg annually. To contextualize these findings, the annual CO₂ emission from home electronics, 212.7 kg, represents approximately 7.3% of the total household electricity emissions. This indicates that the other 92.7% coming from other household activities such as heating, cooling, and lighting dominate the energy footprint.
This shows that home electronics contribute to a household’s carbon footprint, however, their impact is relatively small compared to other energy consumptions. Among home electronics, computers (148.2 kg, 5.1%) and televisions (43.8 kg, 1.5%) are the main contributors. Smartphones (6.55 kg, 0.2%), game consoles (12.3 kg, 0.4%), and iPads/tablets (1.86 kg, 0.1%) have comparatively smaller impacts. These findings suggest that reducing home electronics usage has a limited impact on the overall carbon footprint. However, establishing a controlled household usage pattern is a step toward sustainability.
As a study12 from the University of Oxford focused on direct CO₂ emissions from producing and using devices like laptops and desktops, this research demonstrates that indirect data usage from servers produce a comparable amount of the digital carbon footprint by accounting for roughly 35.6% of the emissions associated with digital activities.
This highlights that everyday digital activities such as streaming and cloud storage have a comparable environmental impact to direct household hardware usage. Previous studies3,12, focused mainly on internal device use. They underestimated the energy consumed by servers. This study demonstrates that while household electronics themselves contribute to emissions, their connection to servers stands for 35.6% of household digital activities. This shows that residential electronic usage has often been overlooked and these findings underscore the importance of mindful electronic consumption.
This study offers valuable insights, nevertheless it has some limitations. First, the focus was solely on a particular region, Aliso Viejo, CA. Due to that the results may not represent regions with different climates, energy sources, or household behaviors. Second, electronic devices vary in power consumption. Therefore, the averages used here are supported by peer-reviewed literature14,16. Third, the survey data were self-reported which may introduce potential recall bias. However, the medium sample size of 46 and reported statistics such as the mean, median, standard deviation, minimum, and maximum normalizes the survey data.
Based on these findings, household electronics account for 212.7 kg of CO₂ annually, while servers account for 118 kg of CO₂ annually. These results indicate that servers supporting the connectivity and operation of household electronics have comparable CO₂ emissions to individual electronic devices. While the combined CO₂ emission driven by household electronic devices and supporting servers are still not as significant as other CO₂ emission drivers like cars and the manufacturing sector, the importance of bringing awareness to the impact is significant enough to be considered for future energy saving measures.
Discussion
This study originally hypothesized that a notable amount of CO₂ emission from the residential sector comes from home electronics as it was based on a study by the University of California Irvine13. The findings partially supported this hypothesis. The results showed that direct household electronic devices account for 212.7 kg of CO₂ annually and represent approximately 7.3% of total household electricity emissions, 2,921 kg annually. This confirms that electronic devices contribute to the residential carbon footprint but the overall impact remains relatively small compared to other household energy sources like heating, cooling, and lighting.
In addition to direct device emissions, this study estimated that servers contribute approximately 118 kg of CO₂ annually per household. When combining household electronic devices, 212.7 kg, and supporting servers of 118 kg, the total digital-related emissions is approximately 330.7 kg of CO₂ annually. Within this digital category, servers account for 35.6% of emissions, while direct electronic devices account for 64.4%. This shows that indirect emissions from digital infrastructure represent a substantial portion of digital carbon emissions while they are not directly visible to household users. As discussed in the method section, server emissions were estimated using published metadata and not measured directly. This could result in some recall bias thus potential uncertainty as the value represents an upper-bound estimate per household rather than the exact attribution.
These findings highlight the importance of mindful electronic usage when it comes to everyday activities. Among devices, computers and televisions are the primary contributors annually generating 148.2 kg and 43.8 kg of CO₂, respectively. Smartphones, game consoles, and iPads/tablets contribute smaller amounts. This reinforces that larger, high-wattage electronic devices dominate operational emissions within homes. According to Energy Star, a government based organization for energy efficiency, which is administered by the U.S. Environmental Protection Agency, a Sub Zero energy efficient refrigerator consumes 159 kWh/year. By applying the CO₂ conversion factor of 0.2502 kg/kWh, the total CO₂ emission of this refrigerator is 40 kg which is comparable to a television ( 43.8 kg of CO₂ per year)24.
This research contributes to a broader understanding of residential sustainability by distinguishing between direct operational emissions from household devices and indirect emissions from servers. Previous studies,11,12, focused primarily on device production and internal operational energy usage. However, this study expands the scope by incorporating indirect server emissions to capture a more accurate estimate. It is important to mention that indirect server emissions are not fully attributable to one household due to shared infrastructure and content delivery networks. This paper uses a conservative approach on per-household data usage.
Limitations
While this study offers meaningful insights, there are limitations that must be considered. The focus was limited to Aliso Viejo, CA, and results may differ in regions with different climates, electricity generation sources, or household behaviors. In addition, the power consumption rates were based on peer reviewed sources for each device category, which did not consider device age, efficiency, or model type. Seasonal factors of electronic device usage and regional electricity grid carbon intensity were not captured in this study. This may minimally affect annual CO₂ emission estimates. However, these limitations do not invalidate this paper’s findings. Instead they define the scope of research to average CO₂ emission rates rather than individualized household trends. Lastly, the survey responses were self-reported which may reflect recall bias. However the sample size of 46 reduces the margin of error for recall bias. Descriptive statistics such as the mean, median, standard deviation, minimum, and maximum were used to account for variability.
Key Implications
The findings suggest that reducing electronic device usage alone would produce a modest reduction in total household emissions. However, small behavioral changes like turning off electronic devices when they are not in use could lower digital related emissions. By establishing these habits across communities with collective effects will result in a measurable conservation.
Future Research
Future research should expand the geographic sample size and integrate more accurate measuring approaches to reduce recall bias from self reporting surveys. For instance, incorporating smart meters or device-level monitoring applications can improve data accuracy. Additionally, future studies can go more in depth analyzing the shared usage of current servers and networks to incorporate economies of scale and mitigate the redundancy of shared network usage.
Conclusion
Overall, this study demonstrates that household electronic devices and supporting servers contribute to a measurable amount of residential CO₂ emissions, around 330.7 kg. Of this, 7.3% is driven by direct operational electronic devices. Even though household electronic devices are not the dominant source of household carbon emissions, their growing impact calls for more awareness. Additionally, digital sustainability remains an important and often overlooked component of modern residential energy consumption. Raising awareness of both direct and indirect digital emissions can support more informed energy-saving behaviors and encourage broader conversations about responsible technology usage within households.
APPENDIX
Consent Form
Thank you for your interest in being a research participant. The goal of this study is to determine if education on corporate practices regarding social issues impacts consumers’ perceptions of their brand. As the primary researcher, I am looking to see if there is a significant change before and after a consumer is informed of the actions of a corporation.
Purpose for this study: This research is aimed at answering the question of how much home electronics contribute to the overall CO2 emission in Aliso Viejo.
What will happen if you choose to be a participant in this study?
After obtaining consent from both the parent and participants, I will administer a virtual survey with multiple choice questions asking participants to report how many hours their household cumulatively uses electronics.
What rights to privacy will be enforced? How will your information be used?
The study recognizes the nature of the sensitive material and therefore will grant all participants confidentiality. Information will at any time be disclosed to a member outside of the study, and only the quantitative data gathered from the survey will be used.
Can I say no?
Yes, you have the right to not answer or withdraw from participating in the study at any time with no penalty towards you with no questions asked.
What are the risks and benefits?
Due to the sensitivity of the topic, there is a possibility of emotional distress being evoked. There will be provided tools to debrief any individuals who feel as if they may benefit from such services. There is no direct benefit to the participants, though individuals will be helping gather data to help answer the previously stated research question and contribute to the body of knowledge.
If you have any questions, comments, or concerns, or would like to follow up at any time, please feel free to contact me at either of the following: vianazr@yahoo.com
If you wish to voice any questions, problems, or concerns you may have about the study, please email the research advisor Erin E. Rose at eerose@capousd.org
Recognize that as a participant, you have the right to withdraw from the study at any time with no questions asked. If you agree to be a participant in this study, please check the box below.
I am willing to be a participant in the research and acknowledge the above statements:
*you are not required to take the survey if the answer is ‘no’
- Yes
Section 1 – Demographics
DISCLAIMER: Confidentiality – Please state “I agree” below in acknowledgment that the data obtained will not be used with your name attached. All data will be kept private and not shared by the researcher with impartial individuals not integral to the study. If you have any questions about anonymity, please ask now before continuing.
Question 1: How many hours per day does your household cumulatively use a computer at home?
Question 2: How many hours per day does your household cumulatively use their phones at home?
Question 3: How many hours per day does your household cumulatively use an iPad/tablets at home?
Question 4: How many hours per day does your household cumulatively watch TV at home?
Question 5: How many hours per day does your household cumulatively use a game console at home?
DEBRIEFING FORM
Thank you for your time and participation in completing this survey. Your feedback is integral in creating a successful and comprehensive byproduct.
Following the study, if you have any questions, concerns, or sentiments of discontent, please do not hesitate to reach out to me at vianazr@yahoo.com
Below are attached resources if you feel you could benefit from additional aid:
Text “HOME” to 741741 to get in contact with a crisis counselor
1-800-662-4357 (national helpline for mental health)
Poison Control: 1-800-222-1222
Alcoholics Anonymous (AA): 909-825-4700
Narcotics Anonymous (NA): 909-622-4274
Community Crisis Response Team (24/7): 909-458-1517 office 909-535-1316 pager (after hours)
National Suicide Prevention Lifelines: 800-784-2433, 800-273-8255
Suicide and Crisis Lifeline (available 24 hours): 988
Once again, I would like to thank you for your participation formally.
References
- NASA, “Is the ozone hole causing climate change?,” science.nasa.gov, (2024). [↩]
- B. Goldstein, D. Gounaridis, and J. P. Newell, “The carbon footprint of household energy use in the United States,” Proceedings of the National Academy of Sciences, vol. 117, no. 32, (Jul. 2020). [↩] [↩]
- T. Kenny and N. F. Gray, “A preliminary survey of household and personal carbon dioxide emissions in Ireland,” Environment International, vol. 35, no. 2, pp. 259–272, (Feb. 2009). [↩] [↩] [↩] [↩] [↩]
- T. Wang, Q. Zhao, W. Gao, and X. He, “Research on energy consumption in the household sector: a comprehensive review based on bibliometric analysis,” Frontiers in Energy Research, vol. 11, (Jan. 2024). [↩] [↩]
- G. Kamiya, “The carbon footprint of streaming video: fact-checking the headlines – Analysis,” IEA, (Dec. 11, 2020). [↩]
- “Marks and Przedpelski, ‘The Carbon Footprint of Streaming Media: Problems, Calculations, Solutions’ | Streaming and AI carbon footprint | Laura U. Marks,” Laura U. Marks, (2024). [↩]
- B. Selb, “Degree project 120 credits Assessing the carbon impact of a data centre server for video streaming Programme name (eg Master’s Programme in Molecular Biotechnology Engineering) Master’s Programme in Data Science,” (2023). [↩]
- R. V. Jones, A. Fuertes, and K. J. Lomas, “The socio-economic, dwelling and appliance related factors affecting electricity consumption in domestic buildings,” Renewable and Sustainable Energy Reviews, vol. 43, pp. 901–917, (Mar. 2015). [↩] [↩]
- M. Salahuddin and K. Shahjahan.“Empirical Link between Economic Growth, Energy Consumption and CO2 Emission in Australia.” The Journal of Developing Areas, vol. 47, no. 2, 2013, pp. 81–92, [↩]
- P. Teehan and M. Kandlikar, “Comparing Embodied Greenhouse Gas Emissions of Modern Computing and Electronics Products,” Environmental Science & Technology, vol. 47, no. 9, pp. 3997–4003, (Apr. 2013). [↩] [↩]
- N. Lövehagen, J. Malmodin, P. Bergmark, and S. Matinfar, “Assessing embodied carbon emissions of communication user devices by combining approaches,” Renewable and Sustainable Energy Reviews, vol. 183, p. 113422, (Sep. 2023). [↩] [↩] [↩]
- “Environmental impact of IT: desktops, laptops and screens,” www.it.ox.ac.uk. [↩] [↩] [↩] [↩] [↩]
- B. Aldrich, “UCI study finds 53 percent jump in e-waste greenhouse gas emissions between 2014, 2020,” UCI News, (Oct. 26, 2022). [↩] [↩]
- L. Desroches, “Computer Usage and National Energy Consumption: Results from a Field-Metering Study | Energy Analysis & Environmental Impact Division.” Lbl.gov, 2025 [↩] [↩] [↩]
- Addendum Report for the Total Energy Model V2.0 for Connected Devices F E B R U a R Y 2 0 2 1. Electronic Device & Networking Device Annex EDNA, Feb. 2021 [↩] [↩]
- B. Urban, K. Roth, M. Singh, D. Howes, “Energy Consumption of Consumer Electronics in U.S. Homes in 2017 [↩] [↩]
- Southern California Edison, “ESG and sustainability quantitative information [↩]
- R. Layton, “2023 Report: Average Home Internet Data Usage Nears 600 GB,” Allconnect, Mar. 23, 2023. [↩]
- J. Aslan, K. Mayers, J. G. Koomey, and C. France, “Electricity Intensity of Internet Data Transmission: Untangling the Estimates,” Journal of Industrial Ecology, vol. 22, no. 4, pp. 785–798, 2018. [↩]
- H. Pihkola, M. Hongisto, O. Apilo, and M. Lasanen, “Evaluating the Energy Consumption of Mobile Data Transfer—From Technology Development to Consumer Behaviour and Life Cycle Thinking,” Sustainability, vol. 10, no. 7, Art. no. 2494, (2018). [↩]
- A. Hazra, “Using the confidence interval confidently,” Journal of Thoracic Disease, vol. 9, no. 10, pp. 4124–4129, (Oct. 2017). [↩]
- J. W. Creswell, Research Design: Qualitative, Quantitative, and Mixed Methods Approaches, 4th ed., Sage Publications, 2014 [↩]
- “Electricity Cost in Orange County, CA: 2023 Electric Rates.” EnergySage, Jan. 2026 [↩] [↩]
- “Product Finder — ENERGY STAR Certified Refrigerators,”ENERGYSTAR, [↩]

 and Family-Integrated Care (FIC): Global Trends and Local Provider Awareness in Fresno County, California")
