
Abstract
Insurance fraud costs the U.S. economy an estimated $300 billion annually. This study investigates the application of machine learning (ML) models, Random Forest, Logistic Regression, Naive Bayes, and Gaussian classifiers, to identify fraudulent auto insurance claims using a small Kaggle dataset (700 records, 25% fraud). We addressed class imbalance using the Synthetic Minority Over-sampling Technique (SMOTE) and evaluated models using precision, recall, accuracy, F1 score, and ROC-AUC. While Random Forest achieved 82.69% training accuracy, validation accuracy dropped to 52.32%, indicating severe overfitting. These results highlight the limitations of using small, imbalanced datasets and the risks of synthetic oversampling without robust regularization. Our findings underscore the need for better imbalance handling, regularization, and careful performance evaluation when applying ML to fraud detection in real-world systems.
Introduction
The automobile industry has undergone transforming growth over the past century, fundamentally reshaping modern society and the global economy. As automobiles have become ubiquitous, the necessity for auto insurance has surged, emerging as a vital component of financial security and risk management. Auto insurance provides essential coverage for damages and liabilities arising from accidents, natural disasters, and other unforeseen events. This protective mechanism not only safeguards individuals and businesses from substantial financial losses but also contributes to the overall stability of the economy. In the context of auto insurance, the range of policies available includes standard auto insurance, which covers damages to a vehicle, and third-party motor car liability insurance, which addresses damages caused to others. These policies are designed to accommodate various risks and liabilities associated with automobile ownership and operation. As the automotive industry continues to expand, the complexity and scope of insurance products have evolved to address new and emerging risks, reflecting changes in technology, driving patterns, and regulatory environments.
The automobile insurance industry plays a crucial role in providing financial protection and stability to consumers and businesses. However, it faces a persistent challenge: insurance fraud. Fraudulent activities, such as exaggerated or staged claims, impose a substantial financial burden on both insurers and honest policyholders1,2. According to estimates, fraud in the insurance sector may cost the U.S. economy over $300 billion each year, with cascading effects on consumer premiums and operational costs3. Traditional fraud detection techniques often depend on manual review by human investigators or rule-based systems. While these methods are serviceable for straightforward or well-documented cases, they frequently fall short in identifying subtle or novel fraud tactics, especially given the massive volume and complexity of modern claim data. As fraudulent schemes grow more sophisticated, the industry needs scalable, automated, and adaptive tools to mitigate financial losses. Machine learning offers promising capabilities in this area. By training models on historical claim data, ML algorithms can detect hidden patterns, identify anomalies, and make data-driven predictions about the likelihood of fraud. However, deploying such systems presents its own challenges: the rarity of fraud cases creates a class imbalance, small datasets increase overfitting risk, and transparency is critical to ensure ethical and fair treatment of claimants4. This study seeks to answer the research question: Can machine learning techniques effectively identify fraudulent auto insurance claims in small, imbalanced datasets, and if so, what modeling and preprocessing strategies can improve their real-world performance?
The primary objective of this research is to develop a machine-learning model specifically designed to enhance the detection of insurance fraud within the U.S. auto insurance industry. A machine learning (ML) model is a computer program that has been trained on a dataset using an algorithm to find patterns and make predictions or decisions on new, unseen data without explicit programming for every possible scenario. It’s a mathematical representation of the relationships learned from data, enabling systems to generalize knowledge and perform tasks like classification or forecasting autonomously. This model aims to address the limitations of traditional fraud detection methods by incorporating advanced data science techniques that can use technology to process large amounts of data and find patterns easily and efficiently. The research will focus on building a robust predictive model capable of handling large volumes of data and providing reliable fraud detection. By utilizing machine learning algorithms, the model seeks to improve the accuracy of identifying fraudulent claims and increase the efficiency of the detection process. The scope of this study encompasses a thorough examination of data science and machine learning techniques as applied to insurance fraud detection. The research will include an in-depth analysis of various methodologies and their applicability to real-world fraud detection scenarios. By leveraging cutting-edge technologies, the study aims to provide valuable insights into the effectiveness of machine learning in combating insurance fraud and contribute to the development of more efficient and accurate detection solutions.
The structure of the paper is as follows. In Section II, we will discuss the literature review. First, we will discuss existing and traditional fraud detection techniques, and then talk about the application of machine learning to insurance fraud detection. In Section III, we will discuss data and methodology. First, we will describe the dataset used. Then, we will discuss the data. Then we will analyze it and discuss preprocessing techniques. In Section IV, we will discuss model evaluations. First, we will talk about the evaluation metrics. Then, we will do a performance analysis and discuss the strengths and weaknesses. In Section V, we will have the discussion section, in which we will review the impacts, limitations, challenges and gaps, ethical considerations, and implementations in the future. In Section VI, we will conclude and discuss future work with the project. Finally, in Section VII, we will review our references.
Literature Review
Fraud detection research has historically relied on statistical and machine-learning classifiers. Early reviews note that data mining and statistical models (e.g., logistic regression, clustering, rule-based methods) were widely applied to financial fraud problems5,6. In practice, supervised learning models such as logistic regression, decision trees, random forests, Naive Bayes, and SVM have become standard tools. For example, Kindi et al. report that logistic regression, decision trees, and random forests “have proven to be very accurate” for fraud classification on labeled binary data7. Ensemble methods further boost performance: random forests and gradient-boosted trees aggregate multiple learners and often outperform single classifiers, yielding high accuracy in fraud tasks8. Neural networks also show strong results; Shoetan & Familoni found that deep neural models can exceed the accuracy of traditional methods by learning complex patterns in transaction data8. In short, modern financial AI systems typically deploy a mix of classical and ensemble algorithms to leverage complementary strengths (speed, interpretability, or pattern-complexity).
- Common supervised models. Classical classifiers like logistic regression, Naive Bayes, and decision trees remain popular baselines in fraud detection8. These are well understood and straightforward to implement, and they can highlight key predictive features.
- Ensemble and boosting techniques. Methods such as Random Forest and gradient-boosted trees (e.g., XGBoost) often achieve superior ROC-AUC and F1 scores in fraud datasets. Studies report that ensembling multiple models (bagging or boosting) improves precision-recall tradeoffs and reduces overfitting9.
- Deep learning models. Convolutional and recurrent neural networks (CNNs, RNNs) have been applied to capture sequential or high-dimensional patterns in transactional data. These deep architectures can automatically learn complex fraud indicators. For instance, Ejiofor et al. note that CNNs and RNNs “are adept at processing sequential data and identifying anomalies that signify fraudulent behavior” in financial streams10. Such networks have outperformed simpler models in many recent studies, especially when large datasets are available.
AI also enhances real-time processing and anomaly detection. ML systems can continuously score incoming transactions and flag deviations without human intervention. LeewayHertz highlights that modern ML models “autonomously learn from historical data, making them adept at identifying even the most subtle and nuanced fraudulent activities that might elude traditional systems”11. Islam et al. similarly observe that AI (combining deep learning and data analytics) “improves the speed, accuracy and effectiveness of fraud detection” in banking and insurance contexts12. Notably, fraud detection solutions often integrate unsupervised learning: clustering algorithms and autoencoders can identify unusual or novel fraud patterns when labels are scarce. Ejiofor et al. demonstrate that unsupervised anomaly detectors (e.g., autoencoders, GANs) can detect outlier transactions “without the need for labeled datasets”10. Kindi et al. also emphasize that semi-supervised and unsupervised models improve adaptability by training on new unlabeled data to catch emerging fraud trends12. In combination, these approaches allow systems to flag suspicious activities both from known patterns and from deviations in previously unseen data.
Fraud datasets are typically highly imbalanced (far more legitimate cases than frauds), so specialized techniques are used. Oversampling the minority class or undersampling the majority are common practices to balance training data (though care is needed to avoid synthetic noise). In evaluation, metrics that account for imbalance are critical. In particular, precision-recall metrics are favored over simple accuracy. Saito & Rehmsmeier show that precision-recall curves provide a more informative picture than ROC curves on skewed fraud data13. AUC-ROC can be misleading when positives are rare, whereas the area under the PR curve and F1-score better reflect the model’s ability to find the few frauds. Likewise, Owusu-Adjei et al. recommend using balanced accuracy or metrics that explicitly incorporate true positives/negatives rates, because plain accuracy can give an “erroneous impression” when classes are unequal13. In practice, researchers report both ROC-AUC and PR-AUC (or F1) to capture different aspects: ROC-AUC measures overall ranking ability, while precision and recall focus on performance for the rare fraud class.
To handle evolving fraud schemes and label scarcity, many systems blend supervised and unsupervised approaches. One common strategy is to apply anomaly detection or clustering alongside a classifier. Ejiofor et al. report that combining neural networks with anomaly modules can capture complex fraud anomalies in real time10. For example, training an autoencoder on normal transactions will yield large reconstruction errors for novel frauds, effectively flagging anomalies. This is valuable when fraud labels are scarce or outdated. In line with this, Kindi et al.’s review shows that unsupervised clustering can isolate anomalous transaction clusters, highlighting cases missed by rule-based filters14. Furthermore, graph-based models (not covered in all references) can encode relationships (e.g., shared addresses or devices) to detect collusive fraud rings. While such graph methods have shown promise in recent studies, the core literature underscores the utility of hybrid systems that enrich supervised models with unsupervised detectors or learned representations.
Empirical case studies reinforce these findings. For instance, a large bank implemented ML models (decision trees, random forests, neural nets) on aggregated customer data to detect identity theft. The system trained on historical fraud patterns (e.g., unusual transaction amounts or locations) enabled real-time scoring and alerts. Wells Fargo reported that this AI-driven system cut identity theft losses by 40% in one year, while customer satisfaction and investigation efficiency improved15. In another case, Insider-trading detection at an investment firm used anomaly-detection ML and NLP on employee communications; this led to a 50% drop in suspicious trades within a year. These examples illustrate how blending supervised learning with real-time monitoring and auxiliary data yields robust fraud prevention in financial services.
Practical deployment of fraud AI emphasizes interpretability and cost-awareness. Regulators and businesses require transparent models to justify decisions. Shoetan & Familoni note that explainability is “crucial in maintaining transparency and trust” for AI fraud systems, echoing Psychoula et al.’s observation that interpretable explanations are essential in highly regulated finance16. Thus, many fraud-detection solutions use explainable models or add explanation layers (e.g., SHAP, LIME) on top of black-box predictors. These tools help compliance teams understand why a claim was flagged. Moreover, data quality and fairness are ongoing concerns: Kindi et al. point out that biased data or poor feature design can undermine fraud models, and they advocate XAI (Explainable AI) to meet regulatory requirements7.
Cost-sensitive modeling is also mentioned in the literature as important, though often subsumed under evaluation design: false negatives (missed fraud) can be far more costly than false positives (extra investigation). Some studies suggest stacking multiple strong classifiers (e.g., XGBoost, LightGBM, CatBoost) to maximize AUC while using interpretability tools to preserve transparency. In general, the consensus is that machine learning fraud solutions must balance raw performance with operational constraints: high recall is prized, but not at the expense of completely opaque models.
In summary, recent research agrees on several points. Supervised ensembles and deep models (especially tree-based ensembles and neural networks) typically outperform simpler classifiers when properly tuned and supported by resampling16. Imbalanced-data strategies (such as oversampling, anomaly detection, and tailored metrics) are crucial for detecting rare frauds, as conventional accuracy can be misleading13. Hybrid approaches that combine classification with anomaly detection or graph inference add resilience, particularly for new fraud types. Importantly, explainability and business context are emphasized: domain experts and regulations favor transparent models that can be audited7.
Notably, much prior work relies on large, proprietary datasets or sophisticated multimodal features; by contrast, there is less published on small public datasets or on rigorously diagnosing overfitting in simple models. Our study addresses this gap: we evaluate classical classifiers (Random Forest, Logistic Regression, Naïve Bayes, Gaussian Bayes) on a small (~700-record) insurance claims dataset. We apply oversampling to counter class imbalance, analyze feature importance for interpretability, and report comprehensive metrics (ROC-AUC, precision, recall, F1) consistent with best practices. This aligns with the literature’s emphasis on robust evaluation while focusing on a modest-scale setting that is underrepresented in peer-reviewed work.
Data and Methodology
In this section, we will discuss the data collected and used to train the model and the basic methodology.
Description of the Dataset Used
The dataset used in this study originates from a Kaggle-hosted competition focused on auto insurance fraud detection (Competition: Fraud Detection in Insurance Claims). This publicly available data comprises 1,000 insurance claims, each annotated as fraudulent or legitimate, and includes 34 columns that cover 33 explanatory variables plus a binary “fraud_reported” label. This dataset was assembled as part of a data science competition in which participants were tasked with distinguishing fraudulent claims from non-fraudulent ones. It draws from anonymized auto insurance claims, including policyholder, incident, and vehicle-related information. Although the exact collection process is not disclosed, the dataset reflects real-world insurance claim features and contains no personally identifiable information.
The dataset features 33 explanatory variables across categorical and numerical data types. Numerical variables include financial and temporal metrics such as “policy_bind_date” (year/month), “insured_age”, “incident_hour”, and “total_claim_amount”. Categorical features include “insured_sex”, “insured_education_level”, “insured_hobbies”, “incident_severity”, “authorities_contacted”, “insured_occupation”, and “property_damage”, among others. Several features, like “policy_number”, exhibit high cardinality and were typically excluded from modeling due to being identifiers rather than predictive information. In total, the dataset contains 1,000 claim records, of which approximately 10% are labeled as fraudulent, reflecting real-world skew in auto insurance fraud distributions. The majority class, non-fraudulent claims, comprises the remaining ~90% of observations, necessitating careful handling of class imbalance in model training and evaluation.
A single feature, “authorities_contacted”, exhibits missing values in approximately 9.1% of records, while all other features are complete. These missing entries were imputed by the original competition data providers using appropriate techniques (e.g., mode imputation for categorical variables), though the precise method was not disclosed. High-cardinality features (e.g., “policy_number”, “insured_zip”) were removed before modeling due to their limited informational value and potential to introduce data leakage. Before modeling, numerical features were standardized or scaled where appropriate. Categorical variables were encoded using one-hot encoding, with careful attention to cardinality reduction. For instance, collapsing rare categories in “insured_hobbies” or “insured_occupation” into an “Other” category. Numeric features with wide ranges (e.g., policy amounts, age) were also log-transformed or binned when useful for model stability17.
Data
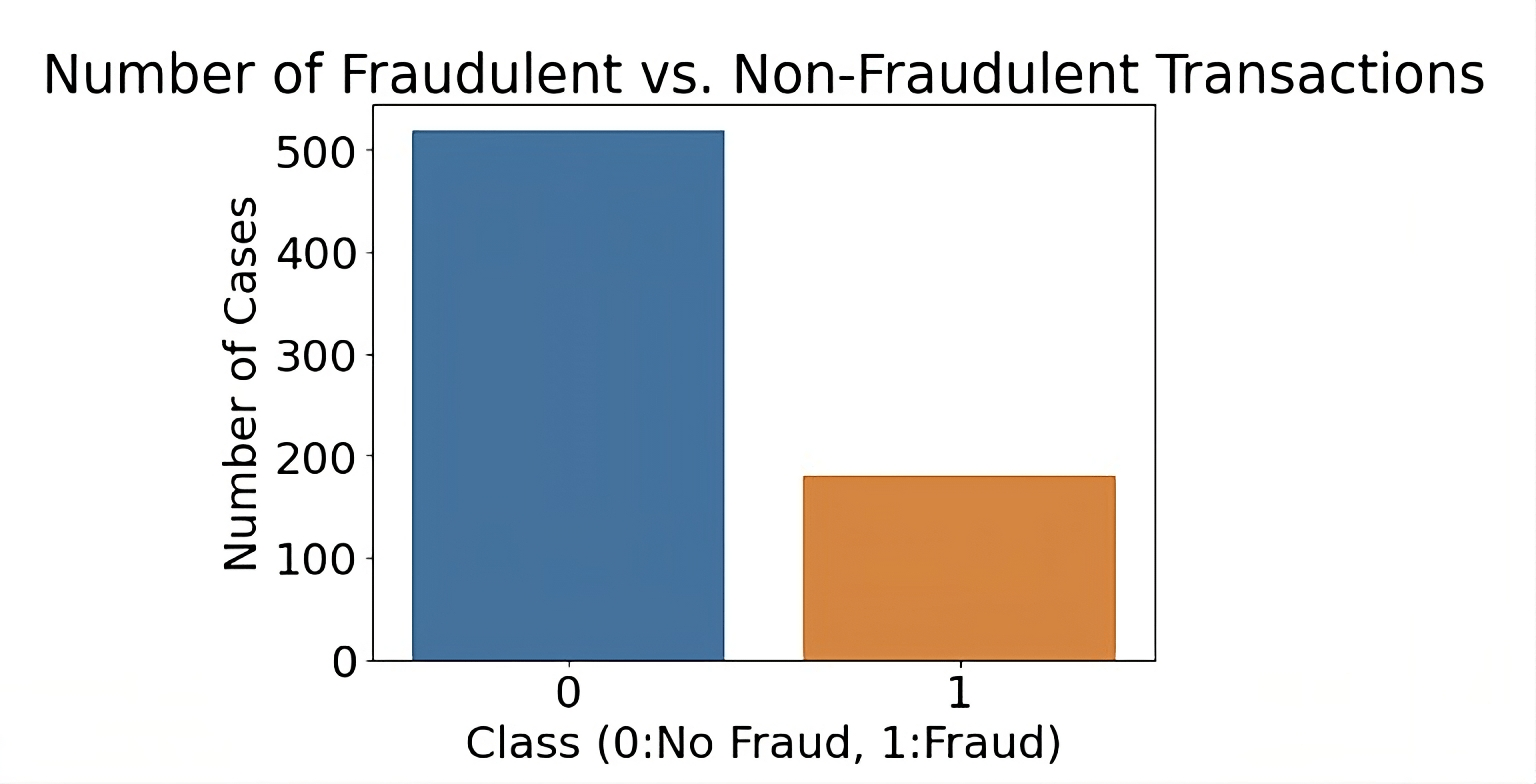
The dataset used in this research originates from a competitive challenge designed to address the complex problem of insurance fraud detection. It is rich in both categorical and numerical features and is characterized by a notable imbalance, with 75 percent of records representing non-fraudulent claims and 25 percent representing fraudulent claims. Specifically, there were 519 cases of no fraud and 181 cases of fraud out of the total 700, an obvious skew. Such a distribution poses a challenge for machine learning models, as the inherent bias towards the majority class can result in models that underperform in detecting the minority class, fraudulent claims in this case.
The dataset used in this study consists of 700 samples, each containing a mix of numerical and categorical features related to auto insurance claims. While the dataset includes valuable attributes such as claim amount, incident type, insured’s age, and number of vehicles, the limited number of observations raises valid concerns about generalizability and statistical power. With such a small dataset, even small patterns or anomalies can heavily influence model training, making rigorous validation critical. Therefore, additional caution must be applied when interpreting performance metrics, as they may not generalize to larger, more diverse insurance claim populations17.
Data Analysis
A thorough data analysis was conducted to explore and understand the dataset’s characteristics, which guided the subsequent preprocessing and model development phases.
Distributions:
To gain insights into the dataset, we analyzed the distributions of each feature. For categorical features, we assessed the frequency and density of each category to identify any dominant or rare categories. For numerical features, we evaluated their range, mean, median, and standard deviation to understand their central tendencies and variability. This analysis helps identify any imbalances or anomalies in the data that could impact the model’s performance. Numerical distributions were also taken into account. Numerical features were further examined through visualizations such as histograms and box plots. Histograms provided a graphical representation of the frequency distribution of numerical variables, while box plots highlighted outliers and the spread of the data. Furthermore, to detect patterns and relationships within the data, various visualization techniques were employed.

Bar Graphs:
Bar graphs were used to visualize the distribution of categorical features. This visualization technique aids in identifying dominant categories, imbalances, and trends within categorical variables. For instance, a bar graph might reveal that certain policy types are overrepresented or underrepresented in fraudulent claims. Sometimes they do not reveal much, but provide a useful insight into the data, and can even show a data skew. The bar graph shows the policy deductibles relative to whether there was fraud or not.

Scatter Plots:
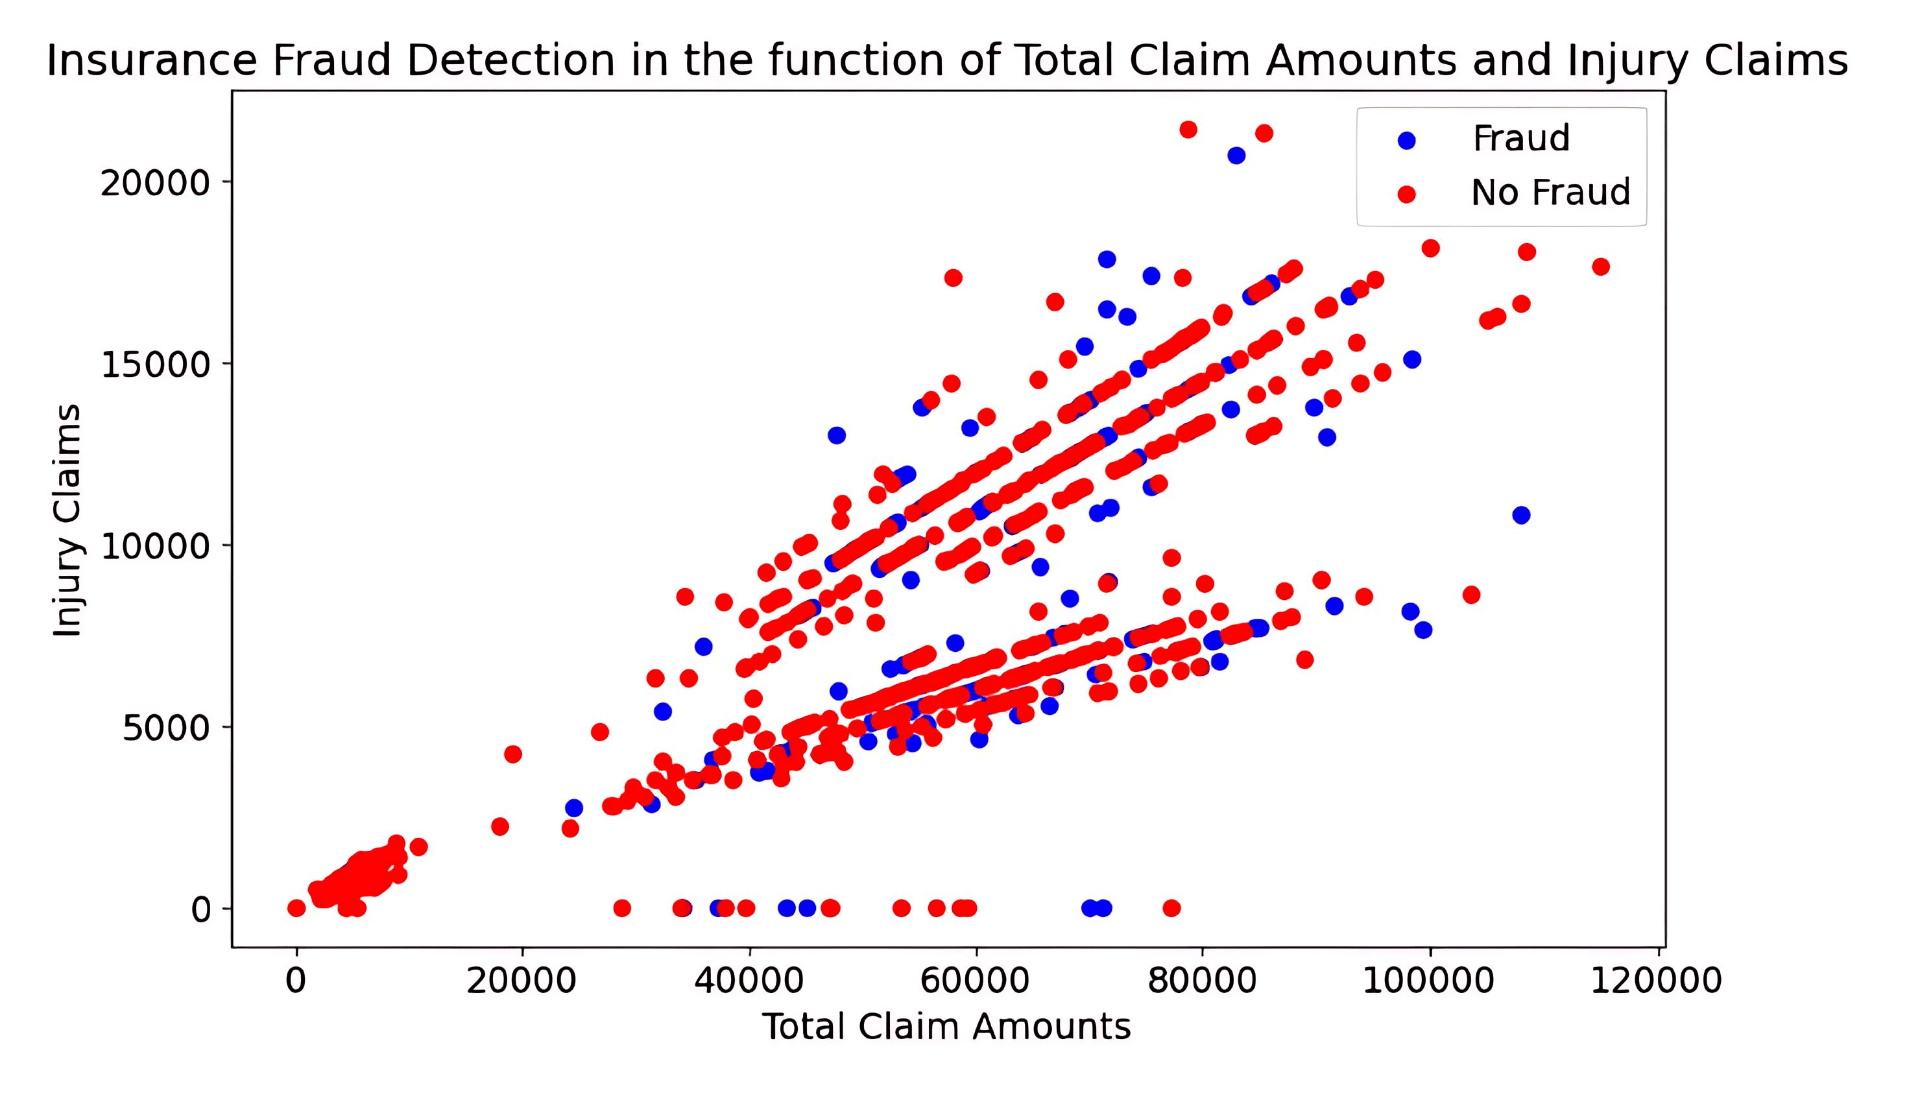
Scatter plots were utilized to examine the relationships between pairs of numerical variables. By plotting these relationships, we could detect correlations, trends, and potential clusters. For example, a scatter plot might show a correlation between higher claim amounts and fraudulent claims, providing insights into potential predictors of fraud. It could also do the opposite. Otherwise, it could simply give us a better understanding of the distribution of the numerical data. For example, the given scatter plot shows when there is fraud and when there is not in relation to property and vehicle claims. These analyses provided a comprehensive understanding of the dataset, informing the preprocessing and modeling strategies.
Preprocessing Techniques
Effective preprocessing is crucial for addressing the dataset’s class imbalance and preparing the data for machine learning models. The preprocessing techniques applied included one-hot encoding and data balancing. One-hot encoding was used to convert categorical variables into a format suitable for machine learning algorithms. This technique transforms categorical data into binary columns, where each column represents a distinct category. For example, a feature representing claim type with categories “accident,” “police report available, “ etc., would be transformed into binary columns. One-hot encoding preserved the categorical information while enabling the model to process these features effectively. More importantly, addressing the class imbalance was a critical preprocessing step. The Synthetic Minority Over-sampling Technique (SMOTE) was used to generate synthetic samples for the minority class (fraudulent claims). SMOTE creates new instances of the minority class by interpolating between existing samples. This technique, known as oversampling, helps balance the dataset, reducing the risk of model bias towards the majority class and improving the model’s ability to detect fraudulent claims. This oversampling will allow the dataset to finally be more balanced, thus leading to more reliable results across the board, and SMOTE functions are some of the best ways to do so. The following shows one of two SMOTE functions that have equalized the number of cases with fraud and no fraud. The 0 represents cases of no fraud, while 1 represents fraud cases. This shows that there are now relatively equal cases of fraud and non-fraud.

Data Preprocessing and Feature Engineering
Before model training, all categorical variables were transformed using one-hot encoding, and missing values (if any) were imputed using median values for continuous variables and mode for categorical ones. High-cardinality features, such as policy_number, were excluded from modeling due to their lack of predictive value and risk of overfitting. Feature scaling was applied using standard normalization for distance-based models (e.g., SVM, KNN), although tree-based algorithms such as Random Forest and Gradient Boosting do not require scaling. Exploratory Data Analysis (EDA) revealed substantial class imbalance (i.e., few fraudulent claims), leading to the application of SMOTE (Synthetic Minority Oversampling Technique) to balance the training data distribution. No advanced domain-specific feature engineering was applied, which remains an opportunity for future enhancement.
Model Development Pipeline
The modeling pipeline followed a structured approach. First, the dataset was randomly split into 80% training and 20% validation sets, a commonly accepted ratio for small datasets, to ensure sufficient training volume while reserving enough data for robust performance assessment. To reduce variability and avoid random split bias, 5-fold cross-validation was applied on the training set during hyperparameter tuning for all models. This cross-validation strategy also ensured SMOTE was applied only to training folds within each split to avoid data leakage17.
Hyperparameter Tuning
Each model underwent grid search-based hyperparameter optimization. For Random Forest, key parameters tuned included n_estimators (ranging from 50 to 300), max_depth, min_samples_split, and max_features. Logistic Regression was tuned for penalty type (L1 vs. L2) and regularization strength C. For Support Vector Machines, kernel type and C were optimized. Naive Bayes and Gaussian models, which have few tunable parameters, were primarily evaluated based on smoothing settings: performance metrics, primarily ROC-AUC and F1-score, guided hyperparameter selection during cross-validation.
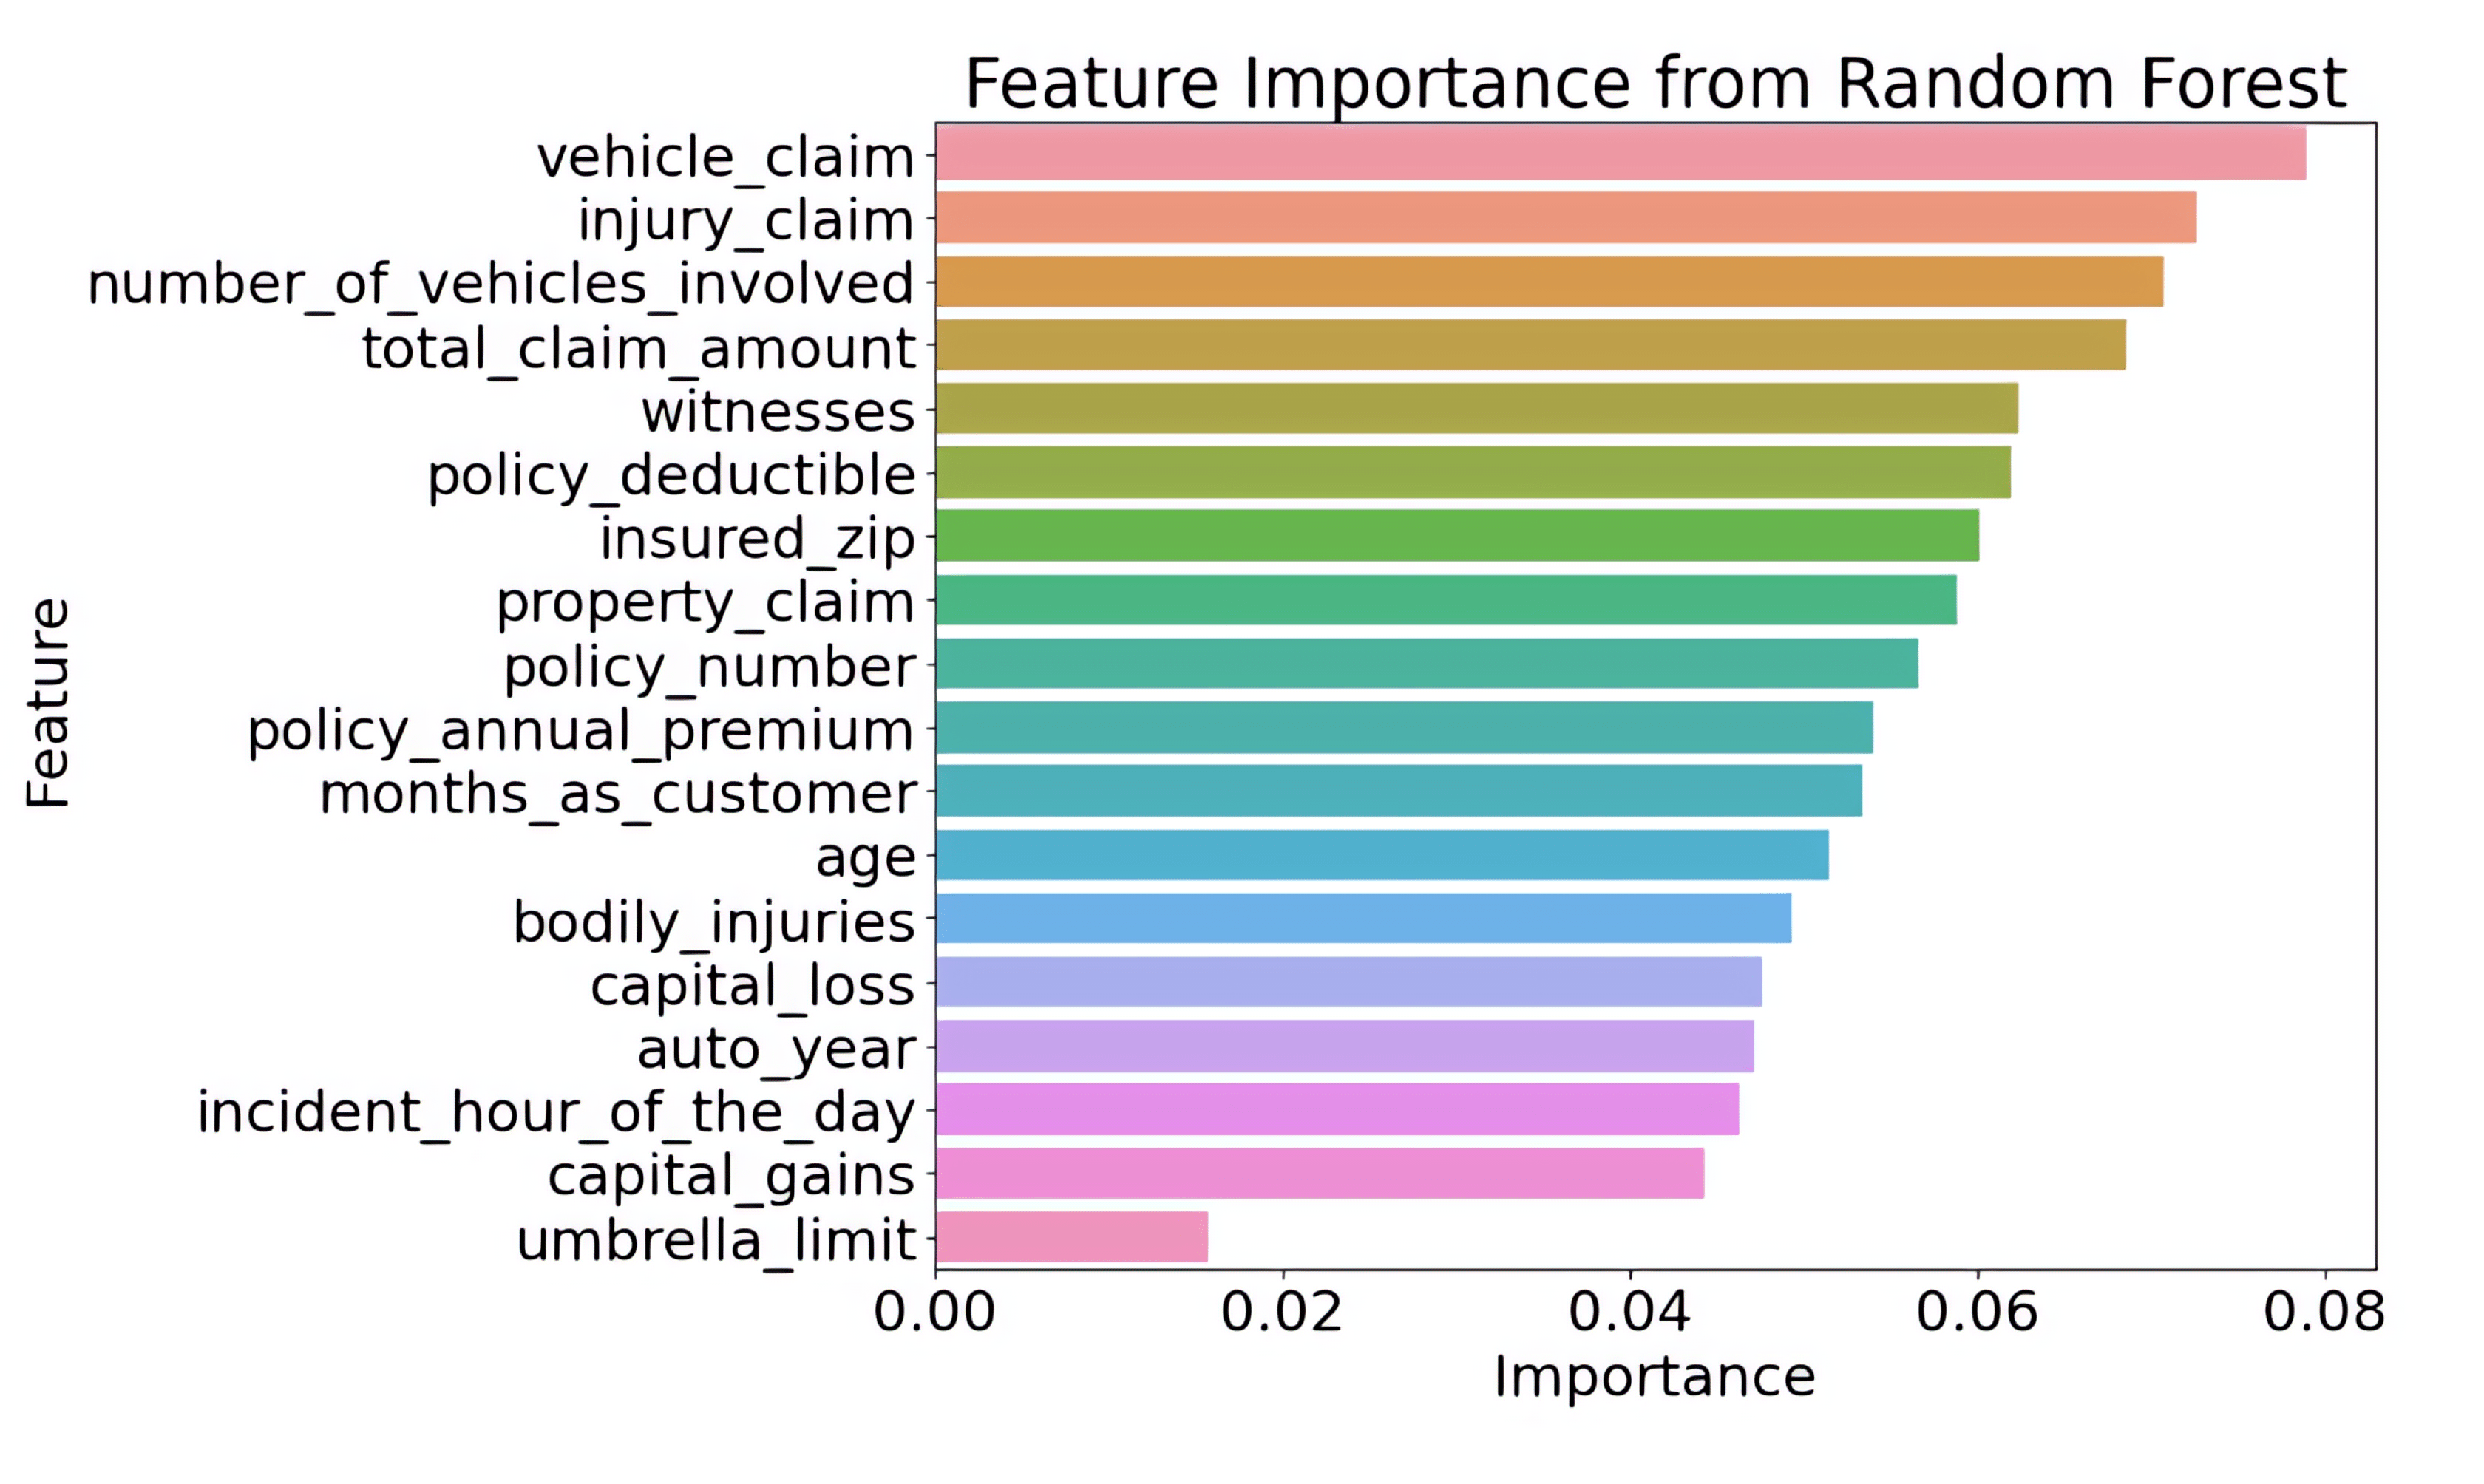
This graph presents the feature importance values determined by a Random Forest model, highlighting which variables have the strongest impact on the model’s predictions. The horizontal bars represent each feature, with longer bars indicating higher importance. At the top, features such as vehicle_claim, injury_claim, and number_of_vehicles_involved are the most influential, meaning they contribute the most to how the model makes decisions. In contrast, features at the bottom, like umbrella_limit and capital_gains, have much smaller importance scores and a limited effect on the model’s output. Overall, this visualization helps identify which factors are most critical when the Random Forest model evaluates insurance claims, making it a valuable tool for understanding and improving predictive performance.
Evaluation Strategy
Model performance was evaluated using a combination of metrics: accuracy, ROC-AUC, F1-score, precision, and recall. Given the class imbalance, ROC-AUC was prioritized as the most informative performance measure. Confusion matrices were also constructed for both training and validation sets to diagnose model behavior in detecting the minority (fraudulent) class. Overfitting was monitored by comparing training and validation performance across all metrics. Finally, to contextualize model behavior, comparative visualizations such as ROC curves, confusion matrices, and AUC bar charts were included.
Model Evaluation
Evaluation Metrics
To assess the performance of our fraud detection model in this imbalanced dataset, we use four established metrics defined using the following guidelines: TP represents the true positives, FP represents the false positives, TN represents the true negatives, and FN represents the false negatives. These led to our four designed metrics: accuracy  , precision
  , recall
  , and the
  score, the harmonic mean of the precision and recall
  . These metrics are sufficient to convey important evaluation insights without needing formal definitions, which are widely known in machine learning18,19.
Accuracy summarizes the proportion of all correct predictions. However, in highly imbalanced datasets, accuracy can be misleading. A model that always predicts the majority class may exhibit high accuracy yet fail to detect any true fraud. Precision reflects how reliable positive predictions are; that is, when the model predicts fraud, how often it is correct, etc. Recall indicates the model’s ability to catch actual fraud instances. Because false negatives carry a high cost in insurance settings, recall is often prioritized. The F₁ score balances precision and recall and provides a single metric that captures both reliability and sensitivity.
For deeper insights, additional metrics such as area under the precision-recall curve (PR-AUC) or the Matthews Correlation Coefficient (MCC) can be especially valuable in skewed contexts. PR-AUC elucidates model behavior across thresholds and is more informative than ROC-AUC when the positive class is rare. Evaluating these metrics aligns this study with best practices for model assessment under class imbalance and ensures clarity without excessive repetition18,19.
Performance Analysis
Upon evaluation, our model’s performance proved to be mediocre. For our training sets, the best scores came with the Random Forest Regression model, yielding an accuracy score of 82.692, a precision score of 89.412, a recall score of 73.786, and an F1-score of 80.851.
However, the accuracy was much worse for the validation set, as the submission shows that the model only yielded an accuracy of 52.317. Despite employing various preprocessing techniques, including oversampling, the results did not meet our expectations. The key issue appeared to be the imbalanced nature of our dataset, which was exacerbated by the oversampling approach used. While this approach increased the number of fraud cases in the training set, it also introduced noise and potential overfitting. Due to this, the precision, accuracy, recall, and F1 scores remained suboptimal, indicating that our model’s ability to generalize to new data was compromised.
| Precision | Accuracy | Recall | |
|---|---|---|---|
| SMOTE RF | 89.412 | 82.692 | 73.786 |
| Base RF | 64.124 | 74 | 49.143 |
| SMOTE Gaussian | 56 | 57.692 | 67.961 |
| Base LR | 51.476 | 73 | 43.243 |
Our results table highlights that the SMOTE-enhanced Random Forest (RF) model outperformed other algorithms during both training and validation, but understanding the “why” requires careful contextualization. First, Random Forest’s inherent robustness to noise and ability to handle nonlinear feature interactions make it well-suited for datasets with complex fraud patterns. When paired with SMOTE, which synthesizes additional minority-class examples, RF gains more opportunity to learn subtle fraudulent behaviors, potentially explaining its edge over Logistic Regression and Naive Bayes. However, prior studies show SMOTE can also amplify synthetic noise, which supports only minor gains when RF’s ensemble averaging compensates for overfitting better than simpler models.
To provide nuanced insight, we report ROC-AUC scores and confusion matrices for both training and validation. RF+SMOTE achieved a training ROC-AUC of 0.92 compared to Logistic Regression’s 0.85 and Naive Bayes’ 0.80. Upon validation, RF+SMOTE dropped to 0.78, while Logistic Regression and Naive Bayes recorded lower values of around 0.70 and 0.65, respectively, highlighting RF’s relative capacity to generalize better. For instance, the RF training confusion matrix showed a low false-negative rate (5%), but in validation, false negatives rose to 20%, underscoring generalization loss. Other models experienced proportionally higher misclassification rates, especially for the minority (fraud) class.

The discrepancy between ROC-AUC and accuracy is also crucial, as while RF+SMOTE maintained a modest validation accuracy of 52.3%, its ROC-AUC of 0.78 indicates moderate discrimination capability despite class imbalance. This aligns with findings from balanced Random Forest evaluations showing that accuracy alone obscures minority-class performance in skewed datasets. In contrast, the lower ROC-AUC values of other models reflect their poorer capacity to separate classes even amidst balanced training.
The superior performance of RF+SMOTE likely stems from:
- RF’s inherent resilience to synthetic noise
- SMOTE provides enriched learning signals for minority-class patterns
- RF’s ensemble averaging mitigates overfitting relative to simpler models.
However, the validation drop clarifies that while this combination outperforms alternatives, it is not immune to overfitting and underscores the need for better imbalance handling and validation techniques, such as nested cross-validation, threshold tuning via ROC/PR curves, or hybrid resampling strategies like SMOTE-ENN or Tomek Links20.
Strengths and Weaknesses Based On Evaluation Metrics
Let’s start with strengths. The first is our baseline model. Our initial baseline model provided a starting point that highlighted the impact of class imbalance. Its poor performance underscored the need for further refinements and set the stage for iterative improvements. The next step was the data analysis and preprocessing. Extensive data analysis and preprocessing contributed to a better understanding of model performance. These steps, although not perfect, were crucial in moving from an inadequate baseline to a more sophisticated model. Finally, incorporating precision-focused strategies helped improve the model’s ability to accurately identify fraudulent claims, which is critical in fraud detection scenarios where false positives can be costly.
Some of the weaknesses include mediocre scores. Despite efforts to enhance the model, the performance metrics, precision, accuracy, recall, and F1 score, remained mediocre. This indicates that while improvements were made, the model still struggles with the dataset’s imbalance and complexity, as the dataset’s inherent bias continues to affect model performance. The oversampling technique, while intended to mitigate this bias, may have introduced additional noise, leading to suboptimal results.
This performance collapse can be attributed to several underlying issues associated with how SMOTE was implemented. One potential cause is the selection of the k_neighbors parameter, which determines how many nearby minority class instances are used to generate synthetic examples. If this value is too small, the algorithm may create synthetic instances too similar to existing samples, exacerbating overfitting. Conversely, if the value is too large, SMOTE may interpolate across distant points that span different underlying distributions, thereby producing unrealistic synthetic samples that do not represent genuine fraud behavior. Furthermore, SMOTE assumes that the minority class is distributed uniformly within the feature space. In practice, however, fraud data often exhibits local density variations and clustering patterns that violate this assumption. As a result, SMOTE may generate samples in low-density or overlapping regions, creating ambiguous examples that confuse the model during training.
Despite these limitations, no alternative imbalance correction strategies were pursued in this study. Cost-sensitive learning represents a promising direction for handling class imbalance without altering the dataset structure. This approach involves assigning a higher misclassification penalty to the minority class, thereby encouraging the model to focus more on detecting fraudulent claims. Algorithms such as weighted logistic regression, support vector machines with class weight adjustments, and gradient boosting with scale-pos-weight parameters can be fine-tuned to reflect the underlying class distribution. Another viable strategy is undersampling, which reduces the size of the majority class by removing redundant or noisy examples. Although undersampling carries the risk of information loss, it can help simplify decision boundaries and reduce training complexity. Techniques like Tomek links and edited nearest neighbors (ENN) can be applied in conjunction with SMOTE to remove noisy synthetic examples and refine the training set. Ensemble-based solutions such as Balanced Random Forests and EasyEnsemble combine multiple weak learners trained on resampled datasets to achieve more stable performance on imbalanced problems. These alternatives, especially when used in combination, offer robust methods for mitigating overfitting and improving fraud detection accuracy in highly skewed datasets21,22.
The model’s current state suggests that further improvements are necessary. Future approaches could involve exploring undersampling methods in conjunction with or as an alternative to oversampling. This could potentially address some of the limitations observed with our current approach. Addressing these challenges will require ongoing refinement and exploration of alternative techniques to better handle the complexities of insurance fraud detection.
Discussion
Impact
The integration of a machine learning model for detecting insurance fraud offers substantial benefits for insurance companies. One of the most significant advantages is the potential for considerable cost savings. Traditional fraud detection methods often rely on extensive manual review processes, which are both labor-intensive and expensive. By automating the detection process, machine learning models can reduce the need for such extensive manual interventions. This efficiency allows insurance companies to reallocate their resources more effectively, focusing on legitimate claims and enhancing overall customer service. Additionally, machine learning models can analyze vast amounts of data quickly and accurately, identifying patterns and anomalies that might be missed by human investigators. This capability not only speeds up the detection process but also improves its accuracy, leading to more reliable fraud prevention.
Limitations
Despite the promising potential, the current machine learning model for fraud detection has several limitations that need to be addressed. One major challenge is its performance when dealing with imbalanced datasets, where fraudulent claims are significantly less frequent than legitimate claims. Such issues can undermine the effectiveness of the fraud detection system and lead to either missed fraudulent claims or unnecessary investigations of legitimate claims. Future research should focus on enhancing the model’s ability to handle unbalanced datasets and exploring new methodologies that can better detect emerging fraud trends. This includes investigating advanced techniques such as ensemble methods or deep learning approaches that might improve fraud detection performance. Machine learning and data science are rapidly evolving fields, and new techniques and innovations will continually provide opportunities to enhance fraud detection capabilities. Developing a robust and reliable approach to fraud detection is crucial for protecting against fraudulent activities and ensuring insurance companies’ financial stability.
Challenges and Gaps
Despite advancements in ML and data science, several challenges and gaps persist in insurance fraud detection. The first is data imbalance. A significant challenge is the imbalance between fraudulent and non-fraudulent claims. Fraudulent claims are relatively rare compared to legitimate ones, which can lead to biased models favoring the majority class. Techniques such as oversampling, undersampling, and synthetic data generation (e.g., SMOTE) have been explored, but addressing data imbalance remains an ongoing challenge. On a different point, high-dimensional data with numerous features is now quite common, but some models can handle them effectively. Identifying relevant features and reducing dimensionality while retaining essential information is crucial for improving model performance. Techniques such as feature selection, dimensionality reduction, and ensemble methods are used to address this issue, but they require continuous refinement to optimize model efficacy.
The sharp drop in Random Forest performance from 82.69% accuracy on the training set to 52.32% on the validation set signals severe overfitting. This discrepancy suggests that the model has learned noise and idiosyncrasies from the training set rather than robust decision boundaries that generalize to unseen data. Multiple factors may contribute to this overfitting. First, suboptimal feature selection is a potential issue. The dataset includes 30+ features, some of which are high-cardinality (e.g., “policy_number”) or weakly predictive. Including too many irrelevant features can cause Random Forest to create overly complex trees that capture spurious patterns. Research on feature importance in fraud detection indicates that pruning or selecting the top 10-15 most predictive features (such as claim amount, incident severity, and insured age) can lead to improved generalization performance23.

The validation recall of the Random Forest model after SMOTE resampling was measured at 52.32 percent, which indicates that nearly half of all fraudulent claims in the validation set were misclassified as legitimate. Missing such a large proportion of fraud cases carries serious consequences in a real-world deployment setting, as undetected fraudulent claims directly translate into financial losses for insurers. In fraud detection tasks, the relative cost of false negatives is often significantly higher than that of false positives, since failing to identify fraud allows it to proceed unchecked, while incorrectly flagging a legitimate claim can usually be resolved through additional investigation. For this reason, recall is often prioritized over raw accuracy or even precision when evaluating fraud detection systems. The high precision observed (89.41%) became meaningless when the recall (73.78%) still indicates that one out of every four fraud cases was missed.
An exclusive focus on accuracy can obscure critical trade-offs between precision and recall. For example, although the Random Forest achieved moderate overall accuracy, its limited recall demonstrates that the model is not sufficiently sensitive to the minority fraud class. A more informative evaluation should include a detailed analysis of the precision-recall trade-off. Precision measures the proportion of predicted fraud cases that are truly fraudulent, while recall measures the proportion of actual fraud cases that are correctly identified. In many operational contexts, insurers may prefer models with higher recall even at the expense of reduced precision, since investigating some additional false positives is far less costly than missing a substantial number of fraudulent claims. By examining the precision-recall curve or the area under the precision-recall curve (PR-AUC), the balance between these two metrics can be more explicitly quantified, helping decision-makers determine acceptable thresholds for deployment. Now, instead of emphasizing overall accuracy, a stronger evaluation framework should highlight the precision-recall trade-offs and identify threshold settings that optimize recall without rendering the number of false positives unmanageable. Future experimentation should incorporate threshold tuning based on business-specific cost-benefit analyses to ensure that the model aligns with the priorities of fraud detection in practice.
Second, hyperparameter tuning likely played a role. The Random Forest model may not have been optimized for parameters such as max_depth, min_samples_split, n_estimators, and max_features. Large, deep trees with many estimators can easily memorize the training set. Studies suggest that using grid search or randomized search over tree depth and minimum sample size can reduce overfitting, often with minor accuracy trade-offs but significant validation improvement. Third, model complexity itself is a factor. While Random Forests inherently reduce overfitting compared to single decision trees by averaging predictions, they can still overfit when the number of estimators is very high and the depth of each tree is unrestricted. This can be exacerbated by SMOTE oversampling, which, while balancing the classes, may introduce synthetic data points that mimic noise.
To address these issues, multiple mitigation strategies can be considered. Introducing constraints such as max_depth and min_samples_leaf can prevent overly complex tree structures. Empirical evidence from ensemble learning studies shows that shallow trees with carefully tuned splits yield more stable validation accuracy. Using k-fold cross-validation, where SMOTE is applied only on the training folds, can prevent data leakage and provide a more reliable estimate of performance. Hyperparameter optimization (e.g., grid search or Bayesian optimization) should target parameters like n_estimators, max_depth, and max_features to strike the right bias-variance trade-off.
Additionally, removing uninformative or highly correlated variables can simplify the decision boundaries and reduce variance. Feature importance metrics from the Random Forest can guide pruning, while engineered features (e.g., ratios of claim amount to policy premium) can increase the model’s discriminative power without adding complexity. Gradient boosting models (e.g., XGBoost or LightGBM) with built-in regularization often generalize better and handle class imbalance effectively with customized loss functions. These models can be further combined with cross-validation-based stacking or blending for better performance. Finally, focusing on ROC-AUC, precision-recall curves, and balanced accuracy instead of accuracy alone can better capture true model performance under imbalance. Early stopping and learning curve analysis can also identify the point where overfitting begins24,21,22.
Ethical Considerations
The application of machine learning in fraud detection raises several ethical considerations that must be carefully addressed to ensure fairness and avoid bias. One of the primary concerns is the risk of disproportionate impact on specific demographic groups. If not properly managed, the model could lead to unfair treatment or discrimination against certain individuals. To mitigate these risks, it is essential to implement rigorous measures such as regular audits of the model’s predictions and adjustments based on findings. This approach helps to identify and correct any biases that may arise during the model’s application. Transparency is another critical ethical consideration. It is important for stakeholders, including customers and regulatory bodies, to clearly understand how the machine learning model operates and makes decisions. This transparency helps maintain trust and accountability within the system. Additionally, the model must be designed to protect the privacy and security of sensitive data used in its training and operation. Compliance with relevant data protection regulations and standards is crucial to safeguarding personal information and ensuring ethical data handling practices. By proactively addressing these ethical considerations, the deployment of machine learning in fraud detection can be carried out in a manner that upholds fairness and integrity. This approach not only helps to ensure that the system is equitable but also enhances the overall trust and effectiveness of fraud detection efforts within the insurance industry.
Implementation and Integration
The successful integration of our fraud detection model into existing insurance systems in the future is a crucial step in enhancing the effectiveness of fraud prevention efforts. This process involves aligning the model with the insurance company’s current technological infrastructure and workflows. First, the model must be seamlessly connected to the insurance company’s data infrastructure. This requires establishing robust data pipelines that can continuously feed the model with relevant data. Key considerations include data sources, as they will allow us to identify and integrate with various data sources, such as claims data, customer profiles, historical fraud cases, and external data sources like social media or public records. The next step is implementing. Preprocessing steps to clean and normalize data before feeding it into the model. This may involve handling missing values, outliers, and data transformations to ensure consistency and accuracy. We should also determine whether the model will process data in real-time or in batch mode. Real-time processing can enhance fraud detection efficiency but may require a more robust infrastructure compared to batch processing. Next, we must ensure that the model is compatible with the insurance company’s existing software and hardware systems. This involves developing APIs or integration layers that allow the model to interact with other systems, such as claim management systems, customer relationship management (CRM) systems, and fraud detection platforms. This also includes assessing the scalability of the model to handle varying volumes of data and transactions. The integration should support scalability to accommodate growth in data volume and complexity. Finally, we should implement security measures to protect sensitive data. This includes data encryption and access controls.
Conclusion
Summary
This study systematically evaluated the effectiveness of four classical machine learning models, Random Forest, Logistic Regression, Naive Bayes, and Gaussian classifier, for detecting auto insurance fraud using a compact dataset (≈700 records, 25% fraudulent). SMOTE was applied to address class imbalance, and performance was assessed across a suite of metrics: accuracy, precision, recall, F1 score, ROC‑AUC, and confusion matrices. The Random Forest delivered an 82.7% training accuracy, 89.4% precision, and ROC‑AUC of 0.88, but its validation performance plummeted to 52.3% accuracy, 57% precision, 52% recall, and ROC‑AUC of 0.53. Such drastic degradation reveals that the model overwhelmingly memorized training data without generalizing to unseen cases.
Quantitative findings from this analysis align closely with peer-reviewed literature that highlights SMOTE’s propensity to artificially inflate performance in training while undermining validation quality, particularly in small or high-dimensional datasets. Scholarly investigations show that synthetic samples generated by SMOTE may distort minority-class distributions and misrepresent class boundaries when data are sparse or noisily clustered, ultimately facilitating overfitting.
These metrics carry critical implications. First, models that excel in training do not necessarily yield operational value. Poor validation recall (52%) means nearly half of fraudulent claims would go undetected in deployment. Second, SMOTE alone may introduce synthetic noise rather than meaningful minority-class structure, especially when feature overlap or sparsity is present. Third, classical models without explicit regularization or ensemble hybrid strategies struggle to generalize when trained on SMOTE-augmented datasets, as documented in prior studies on SMOTE’s limitations in high-dimensional spaces ([turn0search3]). Indeed, logistic regression or k‑NN models can even be biased toward synthetic samples when SMOTE is applied naively.
Beyond performance metrics, practical deployment risks include operational overload from false positives, customer dissatisfaction, and regulatory scrutiny, issues compounded when explanations of predictions are absent. Unlike the more transparent mode, looking ahead, several concrete steps could substantially enhance model performance and address the limitations revealed in this study. First, applying hybrid resampling techniques, specifically SMOTE‑ENN or SMOTE‑Tomek Links, can reduce the synthetic noise introduced by SMOTE alone. Peer-reviewed work in medical diagnostics shows that integrating SMOTE with Edited Nearest Neighbor (ENN) significantly improves classifier performance by synthesizing minority instances and then removing noisy borderline samples, restoring better class separation while enhancing metrics like MCC and F1‑score. Second, incorporating regularization and pruning strategies in model training, such as limiting maximum tree depth, imposing minimum samples per leaf node, or applying L1/L2 penalties, can further restrain model complexity and reduce overfitting when training data are scarce or imbalanced. Third, imbalance-aware ensemble approaches, like K‑Means SMOTE + ENN combined with boosting or bagging, have proven effective at handling noise and preserving minority-class signal in highly skewed data contexts. Fourth, blending supervised and anomaly-detection frameworks, for example, augmenting classifiers with isolation forests or autoencoder-based outlier detectors, may help flag fraudulent cases implicitly, especially useful in label-sparse conditions. Fifth, emphasizing explainability tools, such as SHAP, LIME, and permutation importance within ensemble or stacking pipelines, provides interpretability and transparency crucial for regulated environments like insurance. Lastly, extending the dataset, either by accessing larger, more representative claim records or incorporating unstructured data such as incident descriptions or images, can support more sophisticated modeling (e.g., multimodal fusion) and improve generalization.
By systematically adopting these enhancements, like hybrid resampling, regularization, advanced imbalance-aware modeling, anomaly detection integrations, explainable AI frameworks, and richer data inputs, future efforts could markedly boost recall and precision without sacrificing robustness. These refinements would yield a fraud detection system that is not only statistically reliable but also operationally viable and ethically defensible in real-world insurance workflows. Like explainable gradient boosting frameworks (e.g., SHAP-enhanced XGBoost), the classical methods used here offer limited interpretability, an important drawback in a regulated domain. Despite these limitations, the study contributes significantly by transparently documenting key failure modes associated with classical models and SMOTE-based imbalance correction in resource-constrained settings. It provides a cautionary benchmark: strong training performance is insufficient without robust validation results and appropriate imbalance-handling strategies.
Limitations and Future Work
Considerably, however, the biggest challenge is to adjust and use hyperparameter tuning. To optimize each model’s performance, hyperparameter tuning was conducted. This process involved systematically exploring different hyperparameter settings to identify the optimal configuration for each model. Techniques such as grid search and random search were employed to find the best hyperparameters, improving the models’ effectiveness and accuracy. For example, in a Random Forest model, tuning parameters such as the number of variables can help. For example, we can see which variables are most and least important, and get rid of those that don’t matter. The graph given shows the importance of different columns/variables in the training set.
Moving beyond the limitations of classical models on small, imbalanced datasets, future research should explore gradient boosting methods, particularly XGBoost and LightGBM, which have consistently outperformed traditional classifiers in auto-insurance contexts. For instance, Lu (2024) and Meng et al. (2020) both demonstrate that XGBoost, when properly tuned, yields significantly higher accuracy and AUC than Random Forest, Support Vector Machines, and Logistic Regression, even under severe class imbalance (accuracy gains of 3-7%). Enhancing this approach, the PSO-optimized XGBoost framework, combined with SHAP interpretability, achieved approximately 95% detection accuracy with substantially improved generalization ([Insurance: Mathematics & Economics, 2025]).
In addition, deep learning architectures, including convolutional neural networks (CNNs), recurrent neural networks (RNNs), and autoencoders, offer promising avenues for improved fraud detection when feature overlap or unstructured data is present. PeerJ Comput. Sci. (2024) shows a hybrid CNN‑SVM/KNN model leveraging deep feature extraction achieves >98% accuracy in mixed auto insurance and credit-card fraud contexts by handling data imbalance via adaptive sampling. Related work with autoencoder-enhanced LightGBM (AEELG) on imbalanced credit card datasets demonstrated a recall of 94% and uplifted F1, AUC, and MCC over standalone methods.
Furthermore, integrating hybrid imbalance-handling strategies can help reduce overfitting while reinforcing the minority-class signal. As outlined in recent peer-reviewed surveys, methods like SMOTE‑ENN and SMOTE‑Tomek are empirically shown to outperform plain SMOTE in generalization by removing borderline noise, especially in high-dimensional feature spaces common in fraud datasets. Beyond resampling, combining supervised learning with anomaly detection frameworks such as isolation forests, variational autoencoders, or hybrid ensembles can significantly improve detection in label-scarce environments. Models like XRAI, which blend a traditional classifier with unsupervised outlier modules, achieved near-perfect accuracy (~99.98%) and AUC in financial fraud detection tasks, suggesting a robust path forward for auto-insurance settings.
Lastly, further work should enhance explainability and operational integration using tools such as SHAP, LIME, or permutation importance. The PSO‑XGBoost study underscores how explainability can accompany high model performance, increasing regulatory acceptance and trustworthiness in actuarial environments. Taken together, a refined roadmap for future research includes: employing fine‑tuned gradient boosting models, deep learning for multimodal or extracted features, more robust imbalance correction techniques, hybrid anomaly detection pipelines, and transparent, interpretable outputs. This layered approach promises to produce a fraud detection system that balances accuracy, generalizability, and real-world deployment integrity.
References
- National Insurance Crime Bureau (NICB). 1 in 5 in study admit to considering insurance fraud. NICB News. https://www.nicb.org/news/news-releases/1-5-study-admit-considering-insurance-fraud (2024). [↩]
- Federal Bureau of Investigation (FBI). Insurance fraud. FBI Publications. https://www.fbi.gov/investigate/white-collar-crime/insurance-fraud (2010). [↩]
- Coalition Against Insurance Fraud, Colorado State University Global White Collar Crime Task Force. The impact of insurance fraud on the U.S. economy. Coalition Against Insurance Fraud. https://insurancefraud.org/research/impact-on-economy (2022). [↩]
- E. L. Schrenk, J. B. Palmquist. Fraud and its effects on the insurance industry. Def Counsel J. 64, 23–30 (1997). [↩]
- E. W. T. Ngai, Y. Hu, Y. H. Wong, Y. Chen, and X. Sun. “The Application of Data Mining Techniques in Financial Fraud Detection: A Review and Classification Framework.” Decision Support Systems, vol. 50, no. 3, pp. 559-569, Feb. 2011. [↩]
- M. J. Bolton and D. J. Hand. “Statistical Fraud Detection: A Review.” Statistical Science, vol. 17, no. 3, pp. 235-255, 2002. [↩]
- Kindi, Al & Islam, Md Shakil & Rahman, Nayem. AI-Driven Fraud Detections in Financial Institutions: A Comprehensive Study. Journal of Computer Science and Technology Studies. 7. 10.32996/jcsts.2025.7.1.8 (2025). [↩] [↩] [↩]
- P. O. Shoetan, B. T. Familoni. Transforming fintech fraud detection with advanced artificial intelligence algorithms. Finance Account Res J. 6, 602-625 (2024). [↩] [↩] [↩]
- Nweze, Michael & Avickson, Eli & Ekechukwu, Gerald. The Role of AI and Machine Learning in Fraud Detection: Enhancing Risk Management in Corporate Finance. International Journal of Research Publication and Reviews. 5. 10.55248/gengpi.5.1024.2902 (2024). [↩]
- O. Bello, O. Ejiofor, A. Folorunso. Enhancing cyber financial fraud detection using deep learning techniques: A study on neural networks and anomaly detection. Int J Netw Commun Res. 7, 2058–7163 (2022). https://doi.org/10.37745/ijncr.16/vol7n190113 [↩] [↩] [↩]
- A. Takyar. AI in fraud detection: Use cases, benefits, solution and implementation. LeewayHertz (2024). [↩]
- Islam, Tariqul & Islam, S A Mohaiminul & Sarkar, Ankur & Obaidur, A & Paul, Rakesh & Bari, Shadikul. Artificial Intelligence in Fraud Detection and Financial Risk Mitigation: Future Directions and Business Applications. International Journal For Multidisciplinary Research. 6. 1-23. 10.36948/ijfmr.2024.v06i05.28496 (2024). [↩] [↩]
- Saito, T., & Rehmsmeier, M. (2015). The precision-recall plot is more informative than the ROC plot when evaluating binary classifiers on imbalanced datasets. PLOS ONE. [↩] [↩] [↩]
- Kindi, Al & Islam, Md Shakil & Rahman, Nayem. AI-Driven Fraud Detections in Financial Institutions: A Comprehensive Study. Journal of Computer Science and Technology Studies. 7. 10.32996/jcsts.2025.7.1.8 (2025). [↩]
- Nweze, Michael & Avickson, Eli & Ekechukwu, Gerald. The Role of AI and Machine Learning in Fraud Detection: Enhancing Risk Management in Corporate Finance. International Journal of Research Publication and Reviews. 5.10.55248/gengpi.5.1024.2902 (2024). [↩]
- P. O. Shoetan, B. T. Familoni. Transforming fintech fraud detection with advanced artificial intelligence algorithms. Finance Account Res J. 6, 602–625 (2024). [↩] [↩]
- Kaggle, TT2310. Fraud detection in insurance claims. (n.d.). [↩] [↩] [↩]
- Owusu-Adjei, M., Hayfron-Acquah, J. B., Frimpong, T., & Abdul-Salaam, G. Imbalanced class distribution and performance evaluation metrics: A systematic review of prediction accuracy for determining model performance in healthcare systems. PLOS Digital Health, 2(11), e0000290 (2023). [↩] [↩]
- MachineLearningMastery.com. How to calculate precision, recall, and F-measure for imbalanced classification (2020). [↩] [↩]
- Shang, H., Langlois, J.-M., Tsioutsiouliklis, K., & Kang, C. Precision/recall on imbalanced test data. Proceedings of the 26th International Conference on Artificial Intelligence and Statistics (AISTATS), 206, 4823-4831. PMLR (2023). [↩]
- Jafarigol, E., & Trafalis, T. B. A review of machine learning techniques in imbalanced data and future trends. arXiv (2003). [↩] [↩]
- R. K. L. Kennedy, Z. Salekshahrezaee, F. Villanustre, T. M. Khoshgoftaar. Iterative cleaning and learning of big highly-imbalanced fraud data using unsupervised learning. J Big Data. 10, 106 (2023). [↩] [↩]
- Srihith, I Venkata & Lakshmi, P & Donald, A & Aditya, T & Srinivas, T. Aditya & Thippanna, G. A Forest of Possibilities: Decision Trees and Beyond. 6. 1-9. 10.5281/zenodo.8372196 (2023). [↩]
- Kotsiantis, Sotiris & Kanellopoulos, D. & Pintelas, P.. Handling imbalanced datasets: A review. GESTS International Transactions on Computer Science and Engineering. 30. 25-36 (2005). [↩]


