
Abstract
Background: Implicit bias refers to unconscious biases based on characteristics such as race or gender. Implicit bias influences interactions and decision-making and has far-reaching effects in the legal, healthcare, education, and employment sectors. Quantifying implicit bias and the impact of bias-reducing efforts is, hence, critical.
Hypothesis: Exposure to increased diversity and inclusivity during the formative years impacts bias patterns, and younger generations would have less bias.
Methods: An anonymous Qualtrics survey of self-reported biases was obtained from participants, followed by web-based administration of four Implicit Association Tests (IATs) from Harvard’s Project Implicit (Race-Black-White, Race-Asian-White, Female-Career, Female-Science). Responses were compared across three age groups (<40, 40-60, >60 years) using univariate and multivariate analysis (Pearson χ², regression) in SPSS and STATA.
Results: Of 107 respondents, 72% completed all surveys and IATs. Sex, education, and profession of the participants did not affect IAT outcomes. Most denied explicit biases, but implicit bias was present in all age groups against black-race, women-careers, and women-science. Younger cohorts (<40 years) showed significantly lower (p=0.03) implicit bias compared to older generations in Race-IAT. However, this improvement was not seen in the bias against women in careers and science.
Conclusions: A clear discordance was observed between explicit and implicit biases in all groups. Younger generations demonstrate less implicit race bias, but bias against women in careers and in science persisted in all groups. While efforts aimed against race bias have been partially effective, new approaches are needed to mitigate bias against women.
Introduction
Biases toward specific individuals or groups based on characteristics such as race, gender, class, religion, skin color, and social status influence decision-making across all areas of life and contribute to discrimination, ultimately undermining social equity. Biases are generally categorized as either implicit or explicit. Implicit biases are defined as “attitudes or internalized stereotypes that unconsciously affect our perceptions, actions, and decisions”1 In contrast, explicit biases refer to “preferences, beliefs, and attitudes of which people are generally consciously aware of, endorse, and can readily identify and express”2 Implicit biases can subconsciously influence judgment and decision-making, thereby contributing to social inequities and injustices.
Racial minorities and women have long faced systemic discrimination, with limited access to rights, education, professional advancement, and financial opportunities. Since the 1970s, the United States has undertaken concerted efforts to reduce bias through initiatives such as inclusive education programs, workplace anti-bias training, and public media campaigns. While these measures have contributed to a decline in explicit biases, their impact on implicit biases3 and, more importantly, on real-world legal4,5 health6,7 education and employment8,9 outcomes remain less clear.
The effectiveness of these large-scale social interventions remained difficult to assess until the development of Implicit Association Tests (IATs) in the late 1990s10,11. IATs could measure unconscious bias that could be quantified in population studies. IAT methodology leverages response time differences when participants categorize concepts and attributes. Faster associations between demographic groups and positive/negative attributes reveal implicit preferences that individuals may not consciously recognize or endorse. This technology enables objective assessment of unconscious attitudes across large populations and the evaluation of the effectiveness of social interventions.
Utilizing a web-based survey incorporating race and gender IATs developed by Harvard’s Project Implicit, this study seeks to answer the research question of whether diversity initiatives to reduce bias have been effective in changing bias formations across generational cohorts and whether they have resulted in measurable reductions in implicit race and gender biases in the younger generation. We hypothesized that younger adults would exhibit significantly less implicit bias compared to older cohorts, due to sustained exposure to diversity during their early formative years. Our findings confirmed a reduction in implicit race bias among the younger generation, however, surprisingly gender biases remained unchanged across the age groups.
Methods
Study Design
We employed a cross-sectional design examining implicit and explicit bias patterns across generational cohorts using web-based survey technology. The study utilized Qualtrics survey software, integrated with Harvard’s Project Implicit IAT technology, which enabled the simultaneous collection of secure, anonymous demographic information, explicit bias measures, and implicit attitude assessments. Four IATs (Race: Black-White; Race: Asian-White; Female-Career vs Family; Female-Science vs Liberal Arts) were incorporated into the survey using embedded JavaScript code. This specific JavaScript deployment for millisecond-level latency scoring required physical key presses (‘E’ and ‘I’), necessitating the exclusion of touch-only smartphone and tablet sessions and participants who accessed the tests via touchscreen.
Participants and Recruitment
The study was approved using the Human Participants Form (4) and Human Informed Consent Form of the International Science and Engineering Fair for all research involving human participants that does not take place at a Regulated Research institution. Participants were recruited through online platforms and social media networks. Of 107 initial respondents, 77 individuals (72%) successfully completed the survey and the IATs. The surveys included demographic information such as age, gender, education level, and profession. Participants were binned into three age groups reflecting their formative years-exposure to more diversity and inclusivity as follows: (a) <40 years cohort which reached maturity during widespread exposure to diversity and inclusivity measures and are in their early career, (b) the 40-60 years cohort as the demography which is in their mid-later career currently holding leadership and decision-making roles and (c) the >60 years as the cohort least exposed to diversity and inclusivity measures during their formative years.
Explicit Bias Measures
Prior to IAT administration, participants completed explicit preference measures using Likert-type scales. These self-reported attitudes provided comparison data for examining concordance between conscious preferences and unconscious associations. Questions paralleled IAT constructs, asking participants to rate their preferences between demographic groups across the same domains measured implicitly.
Implicit Association Tests
We administered four IATs from Harvard’s Project Implicit: the Race IAT (White-Black associations), the Asian IAT (White-Asian associations), the Gender-Career IAT (female-family vs. female-career associations), and the Gender-Science IAT (female-liberal arts vs. female-science associations).
Each IAT measures response times when participants categorize words or images representing demographic groups. Participants complete blocks of compatible trials (stereotype-consistent pairings, e.g., “math” paired with “male”) and incompatible trials (counter-stereotypic pairings, e.g., “math” paired with “female”). Faster responses during compatible trials indicate stronger implicit associations. D-scores for IATs calculated as standardized mean difference scores (d-values (mean reaction time of incongruent – mean reaction time of congruent) / pooled standard deviation), with positive d-score values indicate bias toward the first group (e.g., white preference in Race IAT), while negative values indicate bias toward the second group.
Statistical Analysis
Data analysis employed SPSS (v28.0.1.1) and STATA (v16.1) software packages. We performed one-way ANOVA with post-hoc testing (Tukey’s HSD) for continuous variables, linear regression with model fitting for d-value analysis, and Fisher’s exact tests for categorical associations between explicit and implicit bias patterns.
The magnitude of implicit bias across age groups was the primary analysis. In addition, we also examined the concordance patterns between explicit and implicit measures, determining whether explicit-implicit agreement rates differed significantly across age groups using Fisher’s exact tests. A concordance indicates an alignment or ‘agreement’ between conscious beliefs (explicit biases) and unconscious preferences (implicit associations), while discordance indicates a ‘disagreement’ between the two.
Significance was assessed at p ≤ 0.05 for all analyses, with Bonferroni corrections applied for multiple hypothesis testing to calculate adjusted p-values. To demonstrate practical relevance, effect sizes were rigorously reported. Cohen’s d was calculated for pairwise comparisons of continuous variable associations, and d values of 0.2, 0.5, and 0.8 represent small, medium, and large effects, respectively. Additionally, Eta squared (η2) was calculated for ANOVA models as the ratio of the sum of squares between groups to the total sum of squares, representing the proportion of variance in implicit bias explained by age cohort membership. d values of 0.2, 0.5, and 0.8 represent small, medium, and large effects, respectively. η2 values of 0.01 (1% of variance explained), 0.06 (6% of variance explained), and 0.14 (14% of variance explained) are considered as representing small, medium, and large effects, respectively
Manuscript editing: Grammarly was used solely for text processing to enhance clarity and readability.
Results
Survey respondents and demographics
| Demographic | Category | Responded N (%) | Completed N (%) |
| Age Group | <40 years | 40 (37.4%) | 33 (42.9%) |
| 40-60 years | 56 (52.3%) | 37 (48.1%) | |
| >60 years | 11 (10.3%) | 7 (9.1%) | |
| Total | 107 (100%) | 77 (100%) | |
| Gender | Female | 47 (43.9%) | 37 (48.1%) |
| Male | 58 (54.2%) | 39 (50.6%) | |
| Non-Binary | 1 (0.9%) | 1 (1.3%) | |
| Total | 107 (100%) | 77 (100%) |
107 subjects volunteered to participate in the survey and testing. However, 77 subjects (72%) successfully completed both the survey and all the IATS. 28% of subjects who could not complete the surveys or IATs in their entirety were due to accessing the surveys and IATs from touchscreen devices, which are incompatible with our specific JavaScript deployment for millisecond-level latency scoring that required physical key presses (‘E’ and ‘I’). These were excluded from all further analysis. A performed a Chi-square test of independence revealed that the difference in completion rates among age groups was not statistically significant (χ2 = 3.54, p=0.17), suggesting that the incomplete results did not induce a selection bias in the age groups. The final sample analyzed included participants across all three age groups: 33 adults <40 years (42.9%), 37 adults 40-60 years (48.1%), and 7 adults >60 years (9.1%). There were 37 females (48.1%), 39 males (50.6%), and 1 non-binary participant (1.3%) (Table 1). Subsequent analysis was performed across these age groups: young adults (<40 years), middle-aged adults (40-60 years), and older adults (>60 years).
Explicit bias was absent in most participants, and the patterns were similar across age groups
To determine if there were any generational differences in explicit attitudes towards race and gender, we categorized the explicit bias responses as neutral, pro-group1, or pro-group2 and compared them across the three age groups. Most participants across all three age groups reported minimal explicit biases. Overall, across all ages, 74.5% expressed no explicit preference between White and Black individuals, 23.4% expressed a preference for Whites, and 2.1% expressed a preference for Blacks. Importantly, there was no significant difference across age groups in explicit bias patterns (χ² = 3.24, p = 0.198). Similar patterns of no explicit preferences emerged for the other IATs – Asian vs. White, Female family vs. career, and Female Science vs. liberal arts-, nor were there any significant differences across the three age groups (Fig. 1).
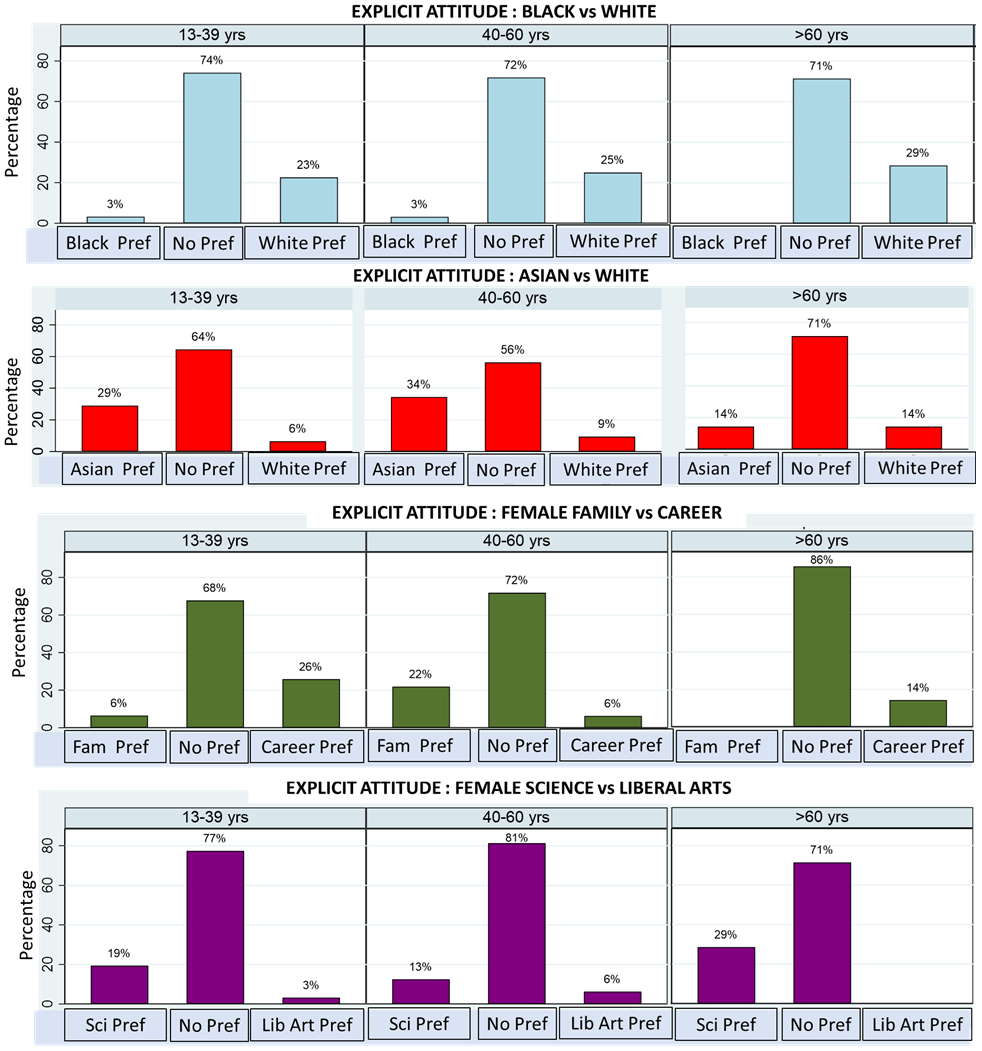
This displays the self-reported explicit attitudes from the survey, with the percentage of respondents on the y-axis. The n=33, 37, and 7 for the <40, 40-60, and >60 age groups, respectively.
Implicit bias was seen in all age groups, but with significant age differences
Racial bias
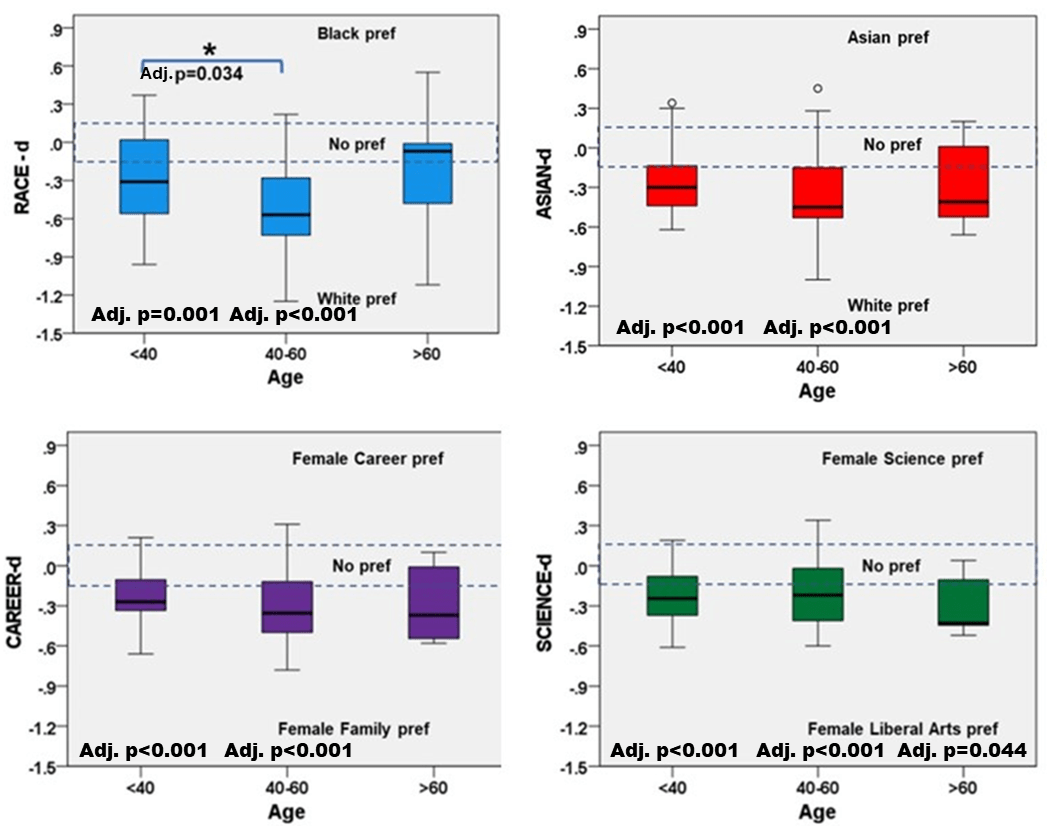
The measured implicit associations are represented in a box-and-whisker plots with the d-scores on the y-axis and the age groups on the x-axis. The median, interquartile range (box) and the ranges (whiskers) are shown. A d-score of 0 indicates neutrality, and a range of ±0.15 is considered as no bias. The intra-group adjusted p-values are represented below each group, if significant. The inter-group adjusted p-value was significant only for the Race IAT between the <40 and 40-60 age groups, as indicated.
Despite low self-reported explicit biases, measured implicit bias against Blacks and against Asians [negative Race d-scores, with d score of 0±0.15 being considered as no bias11] was significant in the <40 (Adj. p=0.001), and 40-60 (Adj. p<0.001) age groups (Fig. 2). The older >60 age group (n=7) had too few participants to obtain significance.
Strikingly, there was a significant difference in the implicit racial associations measured across age groups (Table 2). One-way ANOVA revealed significant between-group differences in Race IAT d-values (F(2,74) = 6.83, p = 0.002, η² = 0.16). Post-hoc analysis indicated that younger adults (<40 years, M = -0.32, SD = 0.41) showed a significantly less implicit bias against Blacks (a medium-large effect Cohen’s d=0.75) compared to middle-aged cohort (40-60 years, M = -0.61, SD = 0.38, adj. p = 0.034). Using Cohen’s U3 this translates to 77% of the middle-aged cohort exhibits higher implicit bias than the median of the younger cohort, highlighting a substantial generational divergence for implicit association for this domain. The >60 age group (n=7) showed minimal levels of implicit bias (M = -0.045, SD = 0.35), although the limited sample size and wide variation prevented meaningful statistical comparison for this group. Thus, despite a significant presence of racial implicit bias against Blacks, this was less in the younger age cohort as compared to the middle-aged cohort.
| IAT Domain | Age Group | Mean | SD | Cohen’s d | Bonferroni Adj. p |
| Race (B/W) | <40 | -0.269 | 0.379 | 0.712 | 0.001 |
| 40-59 | -0.527 | 0.382 | 1.382 | <.001 | |
| ≥60 | -0.231 | 0.544 | 0.425 | 0.91 | |
| Asian/White | <40 | -0.255 | 0.254 | 1.004 | <.001 |
| 40-59 | -0.383 | 0.32 | 1.196 | <.001 | |
| ≥60 | -0.271 | 0.339 | 0.801 | 0.235 | |
| Gender/Career | <40 | -0.234 | 0.2 | 1.168 | <.001 |
| 40-59 | -0.316 | 0.267 | 1.184 | <.001 | |
| ≥60 | -0.28 | 0.301 | 0.932 | 0.146 | |
| Gender/Science | <40 | -0.224 | 0.189 | 1.187 | <.001 |
| 40-59 | -0.209 | 0.252 | 0.831 | <.001 | |
| ≥60 | -0.287 | 0.224 | 1.283 | 0.044 |
Interestingly, while similar intra-age group associations were seen towards Asians as Blacks compared to Whites, the decrease in the younger generation (<40 years) was not seen in the attitudes towards Asians.
Gender bias
Despite low self-reported explicit gender-career and gender-science biases, measured implicit bias against female-career and female-science (negative d-scores, with d score of 0±0.15 being considered as no bias) was significant in the <40 (n=33; Adj. p<0.001 in both), 40-60 (n=37; Adj. p<0.001 in both), and >60 (n=7; Adj. p=not significant, and Adj. p=0.044 respectively) age groups (Fig. 2).
Unlike Race-bias patterns, the Gender-career IAT showed no significant differences across age cohorts (overall M = 0.28, SD = 0.44). While the younger (<40) cohort showed lower bias levels, the differences between age groups did not reach statistical significance (F (2,74) = 1.89, Adj. p = 0.474). A similar pattern was seen with the Gender-science IAT, with significant implicit bias associating females with the liberal arts over science (overall M = 0.41, SD = 0.48), though there were no statistical differences across the age cohorts.
Cross-domain bias correlations
To assess if there was a correlation between the presence of implicit bias across the different domains, we performed a correlation analysis that revealed significant positive associations between implicit bias measures across domains (Table 3). Individuals demonstrating strong racial bias tended to show similar patterns in gender domains, suggesting potential common underlying mechanisms of bias formation and maintenance, discussed in more detail under Discussion (Fig. 3).
| IAT Pair | Correlation (r) | r² | Adj. p-value |
| Race IAT – Asian IAT | 0.575 | 0.330 | <0.001 |
| Race IAT – Gender-Career IAT | 0.501 | 0.251 | <0.001 |
| Race IAT – Gender-Science IAT | 0.372 | 0.138 | 0.012 |
| Asian IAT – Gender-Career IAT | 0.906 | 0.820 | <0.001 |
| Asian IAT – Gender-Science IAT | 0.772 | 0.596 | <0.001 |
| Gender-Career IAT – Gender-Science IAT | 0.885 | 0.782 | <0.001 |
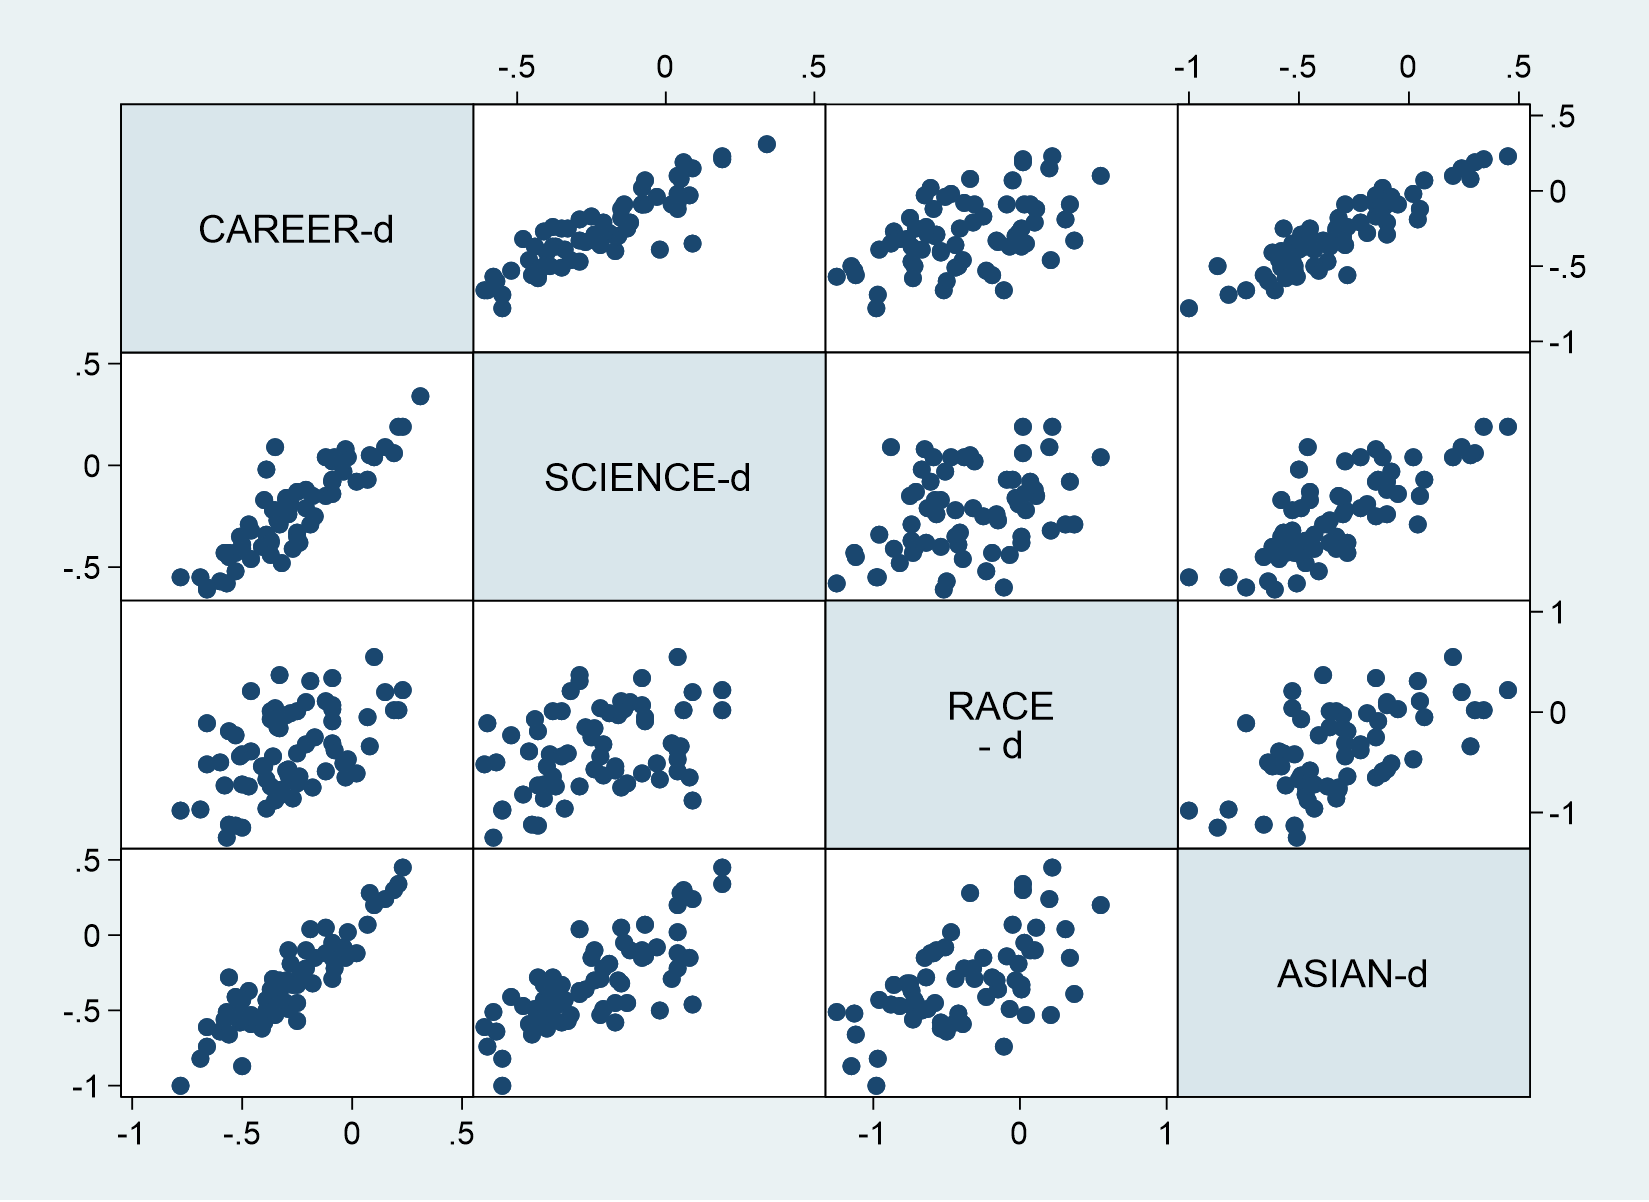
The Pearson Correlation between the pair-wise comparison is represented with the d-scores of the indicated IATs on the axes. The strengths and details of the correlations are shown in Table 3.
Explicit-Implicit bias concordance
Explicit biases are self-reported and can change much faster than a deeper ingrained change in attitudes that are measured by IATs. Concordance was defined as the alignment between a participant’s explicit self-assessment and their implicit IAT D-score. This analysis is critical because it identifies individuals who believe they are unbiased, but whose automatic mental associations reveal implicit associations. Understanding the prevalence of this ‘discordance’ across generations helps identify which age groups are most susceptible to ‘blind spots’ in their decision-making. To determine how closely explicit and implicit biases are correlated across age groups, we performed a concordance analysis between explicit and implicit bias patterns (Fig. 4). There was a significant concordance in the younger <40 years generation between explicit and implicit racial attitudes (κ = 0.67, Adj. p < 0.001), with 78% of participants showing consistent explicit-implicit patterns. No significant discordance was observed for any of the bias domains. In contrast, middle-aged 40-60 years generation displayed significant discordance for racial (Fisher’s exact test, Adj. p=0.023) (Fig. 4), and gender-career (Adj. p<0.001) bias. 60% of participants who reported no explicit bias displayed an implicit bias in preference for Whites and 45% showed bias against female-career and 52% showed a bias against female-science, while explicitly denying these biases. The older (>60 years) generation, despite a small n=7, also showed significant discordance for racial (Adj. p=0.031) and gender-career (Adj. p=0.05) bias, similar to the pattern seen in the middle-aged cohort, though due to the limited sample size, the results in the >60 years cohort should be considered exploratory than definitive.
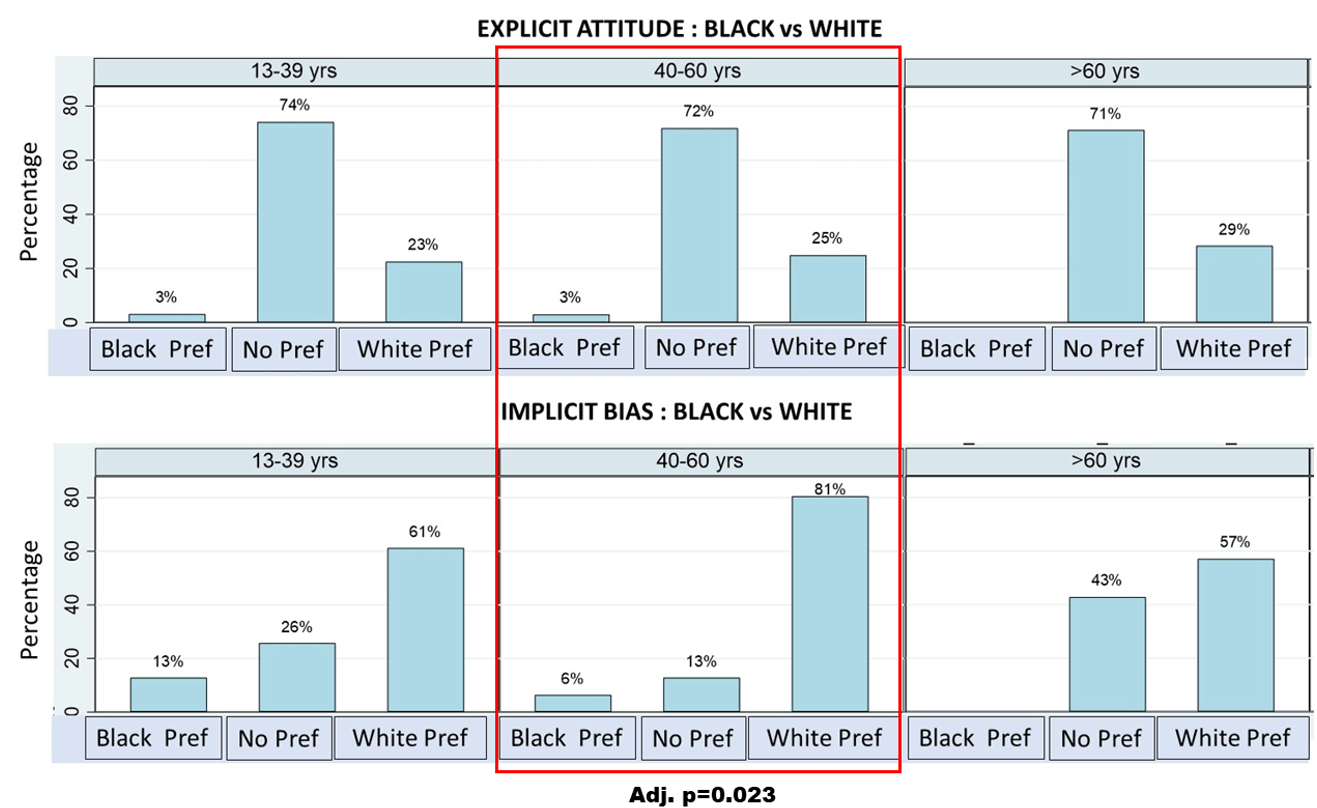
The top panel shows the percentage of participants in each age group who explicitly stated a preference. The bottom panel shows the percentage who demonstrated an implicit association on the IAT. The concordance analysis revealed a significant discordance between the explicit and implicit attitudes for the 40-60 age group (adjusted p-value is shown).
Multiple regression analysis
Multiple regression analysis revealed that of the many variables, including age, gender, education, and profession, the strongest predictor of racial implicit bias was age group (β = -0.34, Adj. p = 0.002), even after controlling for other demographic factors. Neither gender, education level, nor professional field significantly predicted implicit bias scores. We performed a Univariate General Linear Model (GLM) analysis (SPSS) to investigate the interaction between age groups and gender. The results showed that while the main effect of age remained significant, the interaction effect (Age × Gender) was not statistically significant (Adj p=0.839). Similar analyses for age-education (Adj. p=0.572) and age-profession (Adj. p=0.938) revealed no significant interaction effects.
Discussion
The results of this study demonstrated a decline in implicit bias among younger generations (<40 years). This is consistent with exposure to diversity initiatives during the formative years having a positive effect, though the causative effects or the effect of other socio-cultural factors cannot be ruled out due to the cross-sectional design of the study. Interestingly, this effect was limited to a reduction in racial but not gender bias.
Generational Shift in Racial Bias
Both younger (<40 years) and middle-aged (40-60 years) groups demonstrated significant implicit negative association towards Blacks that had large effect sizes. Despite the younger generation having a racial bias, the degree of bias based on implicit association was significantly lower with a moderate to large effect as compared to the middle-aged cohort, suggesting that changing diversity and inclusive environments, changing sociocultural environments in the last few decades, could have led to a positive change in attitudes. Interestingly, the younger generation demonstrated significant concordance (alignment) between explicit and implicit racial bias, suggesting a deeper assimilation of diversity and integration. In contrast, there was a striking discordance between explicit and implicit racial bias in older cohorts. These findings may reflect a process in which individuals whose formative years were in a less diverse, inclusive environment subsequently adopt new, consciously held values that have not been deeply integrated into automatic association, leading to discordance. This is an important finding as it identifies potential ‘blind spots’ wherein the individual may consciously think they are neutral, but the implicit association shows discordance (d-values of > 0.15, or < -0.15)12 This is consistent with aversive racism theories developed by Gaertner and Dovidio13
There was a similar implicit association against Asians as was seen in the Black-White association that was significant with a large effect size. Surprisingly, however, in contrast to the decrease bias seen in younger generations against Blacks as compared to middle-aged cohorts, the younger cohort did not show a decrease in the negative association in Asian-White testing. This suggests that the improvement in bias towards Blacks was not a generational shift in universal racial attitudes. This divergence is consistent with published reports regarding the effects of social initiatives being historically targeted towards lessening the Black-White divide and the perceived ‘model minority’ myth14,15.
Persistence of Gender Bias
The disparity between racial and gender bias was very interesting, and it confirms long-reported persistent bias in female-career and female-science associations16,17. Gender bias persisted in all age groups, while race bias declined in younger adults, indicating that gender-based implicit associations are remarkably resistant to generational shifts. This suggests that different types of bias may require distinct solutions. One explanation could be that representation alone does not change structural reality. While media and educational campaigns have worked to counter stereotypes in both domains, the reality of gender inequality may be a more powerful factor resisting change18, with women still seen primarily in caregiving roles and vastly underrepresented in STEM leadership roles. This bias against females in leadership roles is consistent with the reported “Congruity theory of prejudice” that proposes ingrained prejudice perceiving females less favorably in leadership roles but most strikingly, evaluating the same behavior less favorably when enacted by a female17,19 This persistence of structural gender segregation, despite increased female participation in the workforce, the disproportionate burden of domestic labor and caregiving, and the continued male-dominance of STEM fields, provides environmental and societal reinforcement of these stereotypes20 With gender acting as the ‘primary frame’ for social relations, and this frame of reference being reinforced in the home setting, this gendered reality and stereotypes are insulated from and resist diversity and inclusive measures and education much more than racial associations18,21
Bias Correlation
Our data demonstrated strong correlations between the various implicit association domains. While these could arise from multiple sociocultural and environmental factors22 our findings are also consistent with a ‘generalized prejudice’ model23 with common though specific processes24 Furthermore, the high correlation between the gender-Career and gender-Science in our data also supports the ‘Bias of Crowds’ model25 suggesting that highly synchronized associations could reflect shared environmental and sociocultural aspects, rather than a single common bias mechanism.
Implications for Policy and Practice
The practical implications of this study are that older generations, who hold most leadership and policy-making positions, show persistently implicit negative associations that could translate to unconscious bias. To promote equity, this will require targeted interventions26 In the legal system, a majority of older (>40 years) individuals who believe they are unbiased still hold implicit racial and gender biases, which could negatively influence impartiality. These study findings reinforce arguments for procedural reforms to mitigate implicit bias, such as simplifying jury instructions and implementing data-driven approaches to sentencing27,28 In the employment arena, implicit race and gender bias in decision-making can affect outcomes in interviews for jobs and promotions for older individuals. Structured practices, including anonymized resume reviews and standardized interview questions, could help in reducing the influence of implicit bias9,29
The predictive value of IAT has engendered active academic debate30,31 While meta-analyses have shown that implicit associations can predict discriminatory actions and small effects on IATs having large societal effects32,33,34 critics argue that the effect sizes are modest and that IAT scores should not be viewed as direct proxies for individual discriminatory actions and stable individual traits, but rather as indicators of situations and the social, environmental, and cultural contexts people live in35,36,37 However, within the ‘aversive racism framework, these associations are viewed as critical components of the decision-making environment13 Even among highly trained individuals who consciously endorse egalitarianism, deeply ingrained associations may influence outcomes in professional and legal contexts where standardized protocols are not applicable4,28
Limitations and Future Directions
This study has some limitations. 1. Since the study design was cross-sectional, it can only demonstrate correlation, not establish causality. A longitudinal study tracking a large number of individuals over decades would be definitive, but it would be limited by the expense. Without measures of exposure to diversity, period and cohort compositions, and longitudinal follow-ups, the exact driver of the observed reduction in younger generations would remain correlative. 2. The sample size was modest, with a convenience sampling approach. The smaller sample size (n=7) in the oldest cohort (>60 years) limited statistical power, and the results in this group should be considered exploratory. 3. Recruiting via social media and messaging platforms likely introduces a sampling bias toward users of those platforms, and any generalization to the population at large needs to be taken into account in the context of this limitation. Future research should identify which interventions most effectively reduce bias, along with a longitudinal study to effectively track and mitigate the untoward effects of implicit bias in law and policy, and more broadly in society.
Acknowledgements
I thank all the participants who took the time to complete the surveys. I am also grateful for Vamsi Yechoor’s guidance in designing the survey in Qualtrics. I am thankful to the judges for their constructive comments on my Pittsburgh Regional Science & Engineering Fair (PRSEF, 2023) poster, to my parents, and to the teachers at Shadyside Academy for their mentoring and guidance.
References
- Shah, H.S. & Bohlen, J. Implicit Bias. in StatPearls (Treasure Island (FL), 2025). [↩]
- Vela, M.B., Erondu, A.I., Smith, N.A., Peek, M.E., Woodruff, J.N. & Chin, M.H. Eliminating Explicit and Implicit Biases in Health Care: Evidence and Research Needs. Annu Rev Public Health 43, 477-501 (2022). [↩]
- Jost, J.T., Rudman, L.A., Blair, I.V., Carney, D.R., Dasgupta, N., Glaser, J. & Hardin, C.D. The Existence of Implicit Bias Is Beyond Reasonable Doubt: A Refutation of Ideological and Methodological Objections and Executive Summary of Ten Studies that No Manager Should Ignore. Research in Organizational Behavior 29, 39-69 (2009) [↩]
- Kang, J. & et al. Implicit Bias in the Courtroom. UCLA Law Review 59, 1124-1186 (2012) [↩] [↩]
- Levinson, J.D. Forgotten Racial Equality: Implicit Bias, Decisionmaking, and Misremembering. Duke Law Journal 57, 345-424 (2007), [↩]
- Hall, W.J. & et al. Implicit Racial or Ethnic Bias among Health Care Professionals and Its Influence on Health Care Outcomes. American Journal of Public Health 105, e60-e76 (2015) [↩]
- Institute of, M. Unequal Treatment: Confronting Racial and Ethnic Disparities in Health Care, (National Academies Press, 2003), [↩]
- Moss-Racusin, C.A. & et al. Science Faculty’s Subtle Gender Biases Favor Male Students. Proceedings of the National Academy of Sciences 109, 16474-16479 (2012) [↩]
- Bertrand, M. & Mullainathan, S. Are Emily and Greg More Employable than Lakisha and Jamal? A Field Experiment on Labor Market Discrimination. American Economic Review 94, 991-1013 (2004) [↩] [↩]
- Greenwald, A.G., McGhee, D.E. & Schwartz, J.L. Measuring individual differences in implicit cognition: the implicit association test. J Pers Soc Psychol 74, 1464-1480 (1998) [↩]
- Greenwald, A.G., Nosek, B.A. & Banaji, M.R. Understanding and using the implicit association test: I. An improved scoring algorithm. J Pers Soc Psychol 85, 197-216 (2003) [↩] [↩]
- Greenwald, A.G., Nosek, B.A. & Banaji, M.R. Understanding and using the implicit association test: I. An improved scoring algorithm. J Pers Soc Psychol 85, 197-216 (2003). [↩]
- Dovidio, J.F. & Gaertner, S.L. Aversive Racism. in Advances in Experimental Social Psychology, Vol. 36 (ed. Zanna, M.P.) 1-52 (Academic Press, 2004). [↩] [↩]
- Gee, G.C., Ro, A., Shariff-Marco, S. & Chae, D. Racial discrimination and health among Asian Americans: evidence, assessment, and directions for future research. Epidemiol Rev 31, 130-151 (2009) [↩]
- Chou, R.S., & Feagin, J.R. Myth of the Model Minority: Asian Americans Facing Racism, (Routledge, 2015) [↩]
- Moss-Racusin, C.A. & et al. Science Faculty’s Subtle Gender Biases Favor Male Students. Proceedings of the National Academy of Sciences 109, 16474-16479 (2012) [↩]
- Eagly, A.H. & Karau, S.J. Role congruity theory of prejudice toward female leaders. Psychol Rev 109, 573-598 (2002) [↩] [↩]
- Ridgeway, C.L. Framed by Gender: How Gender Inequality Persists in the Modern World, (Oxford University Press, 2011) [↩] [↩]
- Eagly, A.H. & Karau, S.J. Role congruity theory of prejudice toward female leaders. Psychol Rev 109, 573-598 (2002). [↩]
- Nosek, B.A., Smyth, F.L., Sriram, N., Lindner, N.M., Devos, T., Ayala, A., Bar-Anan, Y., Bergh, R., Cai, H., Gonsalkorale, K., Kesebir, S., Maliszewski, N., Neto, F., Olli, E., Park, J., Schnabel, K., Shiomura, K., Tulbure, B.T., Wiers, R.W., Somogyi, M., Akrami, N., Ekehammar, B., Vianello, M., Banaji, M.R. & Greenwald, A.G. National differences in gender-science stereotypes predict national sex differences in science and math achievement. Proc Natl Acad Sci U S A 106, 10593-10597 (2009). [↩]
- Heilman, M.E. Gender Stereotypes and Workplace Bias. in Research in Organizational Behavior, Vol. 32 113-135 (2012). [↩]
- Fiske, S.T., Cuddy, A.J., Peter, G. & Xu, J. “A model of (often mixed) stereotype content: Competence and warmth respectively follow from perceived status and competition”: Correction to Fiske et al. (2002). J Pers Soc Psychol 126, 412 (2024), [↩]
- Akrami, N., Ekehammar, B. & Bergh, R. Generalized prejudice: common and specific components. Psychol Sci 22, 57-59 (2011) [↩]
- Amodio, D.M. The neuroscience of prejudice and stereotyping. Nat Rev Neurosci 15, 670-682 (2014). [↩]
- Payne BK, V.H., Lundberg KB. The bias of crowds: how implicit bias bridges personal and systemic prejudice. Psychol. Inq 28, 233-248 (2017), [↩]
- Paluck, E.L. & Green, D.P. Prejudice Reduction: What Works? A Review and Assessment of Research and Practice. Annual Review of Psychology 60, 339-367 (2009). [↩]
- Levinson, J.D. Forgotten Racial Equality: Implicit Bias, Decisionmaking, and Misremembering. Duke Law Journal 57, 345-424 (2007) [↩]
- Rachlinski, J.J., Johnson, S.L., Wistrich, A.J. & Guthrie, C. Does Unconscious Racial Bias Affect Trial Judges? Notre Dame Law Review 84, 1195-1246 (2009). [↩] [↩]
- Kalev, A., Dobbin, F. & Kelly, E. Best Practices or Best Guesses? Assessing the Efficacy of Corporate Affirmative Action and Diversity Policies. American Sociological Review 71, 589-617 (2006). [↩]
- Blanton, H. & Jaccard, J. Arbitrary metrics in psychology. Am Psychol 61, 27-41 (2006) [↩]
- Greenwald, A.G., Nosek, B.A. & Sriram, N. Consequential validity of the implicit association test: comment on Blanton and Jaccard (2006). Am Psychol 61, 56-61; discussion 62-71 (2006). [↩]
- Greenwald, A.G., Poehlman, T.A., Uhlmann, E.L. & Banaji, M.R. Understanding and using the Implicit Association Test: III. Meta-analysis of predictive validity. J Pers Soc Psychol 97, 17-41 (2009) [↩]
- Greenwald, A.G., Nosek, B.A., Banaji, M.R. & et al. Best Research Practices for Using the Implicit Association Test. Behavior Research Methods 54, 1161-1180 (2022) [↩]
- Greenwald, A.G., Banaji, M.R. & Nosek, B.A. Statistically Small Effects of the Implicit Association Test Can Have Societally Large Effects. Journal of Personality and Social Psychology 108, 553-561 (2015), [↩]
- Oswald, F.L., Mitchell, G., Blanton, H., Jaccard, J. & Tetlock, P.E. Using the IAT to predict ethnic and racial discrimination: small effect sizes of unknown societal significance. J Pers Soc Psychol 108, 562-571 (2015) [↩]
- Oswald, F.L., Mitchell, G., Blanton, H., Jaccard, J. & Tetlock, P.E. Predicting ethnic and racial discrimination: a meta-analysis of IAT criterion studies. J Pers Soc Psychol 105, 171-192 (2013) [↩]
- Payne, B.K., Vuletich, H. & Lundberg, K.B. Critique of the Bias-of-Crowds Model Simply Restates the Model: Reply to Connor and Evers (2020). Perspect Psychol Sci 17, 606-610 (2022). [↩]


