
Varrun Athis Raijh1, Darrell Robinson2
1 Lawrence E. Elkins High School, Texas, USA
2 State University of New York at Binghamton, Binghamton, New York
Abstract
Anterior cruciate ligament (ACL) injuries are among the most severe and career-altering injuries in competitive basketball. However, prior video-based ACL studies often suffer from limited model interpretability, subclinical performance, and constrained real-world applicability due to reliance on laboratory-controlled data. This study examines whether biomechanical and contextual features extracted from publicly available footage are associated with ACL injury-side classification using interpretable machine learning models. A total of 36 events were analyzed, including 13 right-leg injuries, 13 left-leg injuries, and 10 control events. Markerless pose estimation was used to extract lower-limb joint angles and contact-related features, combined with publicly available data on both offensive and defensive players. Multivariate analysis of variance (MANOVA) revealed statistically significant multivariate effects for right-leg (p = 0.0075) and left-leg (p = 0.0004) injury classifications. Four models, the Logistic Regression, Support Vector Machine, Decision Tree, and Random Forest were evaluated using three-fold cross-validation. Random Forest and Logistic Regression achieved the most consistent performance, with the Support Vector and Decision Tree models showing more variance in results. Feature importance analysis identified leg angles and opponent contact variables as key factors, with patterns differing between left- and right-leg injuries. Rather than attempting injury prediction, this study focuses on post-hoc classification to better understand biomechanical patterns at the moment of injury.
Introduction
In sports, injuries can be detrimental as they potentially could ruin a player’s career and cost their team millions of dollars. Anterior cruciate ligament (ACL) injuries are a major cause of long-term morbidity in basketball players, often requiring surgical reconstruction and prolonged rehabilitation1,2,3. Despite advances in conditioning and injury prevention programs, ACL injury rates in professional basketball remain high. Many of the current forms of ACL injury treatment are invasive or ineffective as they result in post-traumatic osteoarthritis thus prevention is crucial to ensure a successful career for athletes4,5,6. Currently, body mass index (BMI), knee morphology, tibial plateau subchondral bone geometry, and athlete biomechanics have all been shown to be potential factors in influencing likelihood of ACL injury7,8. Unfortunately, many of these factors are limited in their scope, specificity, and sensitivity when predicting ACL injuries, and therefore cannot be used as individual tools when assessing the likelihood of ACL injury7,9. Consequently, with the rapid development of Artificial Intelligence (AI), there is growing interest in AI models to improve the understanding and prevention of these injuries.
Machine learning (ML) is a subset of AI that focuses on allowing machines to learn from data and improve their performance on specific tasks without being explicitly programmed. There is a lack of highly predictive ML models for ACL injuries based on video analysis particularly for clinical use due to the challenges in standardizing data collection, poor model interpretability, and barriers that decrease integration of AI-driven insights into insight for real-world coaching and clinical practice10,11. Recent studies applying AI and computer vision to ACL injury analysis have reported statistically significant results; however, most fail to reach clinically reliable thresholds (AUC < 0.80) and suffer from limited interpretability12,13. Third, many studies depend on highly controlled laboratory data or curated camera setups, reducing generalizability to real‑world settings where only single‑view broadcast footage is available14.
Some AI models that analyze video footage of ACL injuries strictly use advanced deep learning architecture from models like Convolutional Neural Networks (CNNs), Long Short Term Memory models (LSTMs), or Recurrent Neural Networks (RNNs). In some studies, LSTMs, CNNs, and RNNs have difficulty capturing long-term motion dynamics, potential issues with noisy or variable video data, complexity in design, and parameter adjustment, and potential for gradient problems with long sequences. Furthermore, these models struggle with the scale and complexity of large datasets and they do not account for other critical factors like the specific type of injury or the biomechanics involved15.
Classical machine learning models such as Support Vector Machines (SVMs), Logistic Regression (LR), Decision Trees (DT), and even Random Forests (RF) can be deemed inaccurate, but they still provide benefits for research. SVMs are effective for classification tasks, such as categorizing athletes into high-risk or low-risk groups based on various data inputs, including biomechanical data derived from video. They perform well on smaller, high dimensional datasets. RFs are ensemble methods (tree-based solutions) commonly used for injury risk prediction, particularly when integrating multimodal data sources. They have been reported as high-performing methods in several studies due to their ability to handle non-linear data and reduce overfitting. LRs is a valuable tool for analyzing data from ACl sports injury video footage primarily because it predicts a binary outcome (injury/no injury) and offers clear, interpretable results regarding specific risk factors. DTs are a valuable tool for analyzing data from ACL sports injury video footage due to their high interpretability, ability to handle diverse data types without extensive preprocessing, and effectiveness in developing clear clinical decision rules for injury prevention16,17.
This study was designed explicitly to address many of these limitations. To improve interpretability, we prioritize classical machine learning classifiers that allow transparent feature attribution and direct biomechanical interpretation. To promote robust and fair evaluation, models are assessed using fixed train–test splits with cross‑validation and standard deviation reporting. To enhance real‑world applicability, all analyses are conducted on publicly available NBA broadcast footage and include matched non‑injury control events drawn from similar in‑game contexts.
This research study aims to use publicly broadcasted video footage to manually measure the geometry and angles of NBA ACL injuries with the help of markerless pose estimation from motion analysis AI and to create classical machine learning models from a deep learning architecture (Convolutional Neural Networks from the Kinetic Lab App) that could meet the clinical reliable thresholds. This research study aims to potentially identify statistically significant precursors to ACL injury that can help athletes, coaches, physical trainers, rehabilitation specialists, and clinical professionals understand, prevent, and heal ACL injuries in basketball players and other athletes.
Methods
Dataset Collection
For this observational study, male NBA professional players diagnosed as having ACL injuries were selected. There were 36 videos and at least 36 video frames that were utilized and the video footage was taken starting from the 2009 – 2010 season all the way to the 2024 – 2025 NBA season. Videos were included only if the injury moment was clearly visible and excluded if occlusion or camera motion prevented reliable joint angle measurement. There were 36 NBA players analyzed where 13 NBA players injured their right leg ACL and 13 NBA players injured their left leg ACL. Control events were selected from game footage in which players executed similar movements without sustaining injury. There were 27 events where there was no defender or opposing player making contact. 12 events dealt with point guards (1), 7 events dealt with shooting guards (2), 7 events dealt with small forwards (3), 6 events dealt with power forwards, and 4 events dealt with centers (5). Supplementary player information, including height (for both player and defender), weight (for both player and defender), and games played, was obtained from Basketball Reference and official NBA databases18,19.
The videos were all footage of NBA broadcasted games with multiple-camera or multiple angle view (Camera 1 for overall court and Camera 2 for tight action). We used the Kinetic Lab App to measure the geometry and angles of the legs of the injured NBA players as well as the defenders or players making opposing contact with the injured NBA player. The pre-processing video techniques that we utilized was zooming in and out (spatial transformation) to enhance body edges and changing the speed (temporal transformation) of the videos (e.g, 1.5x).
Artificial Intelligence and Markerless Pose Estimation
The Kinetic Lab App uses markerless pose estimation combined with convolutional neural network architecture to analyze video footage and images. Markerless pose estimation is effective because it automatically detects and tracks key body joints and their angular measurements from standard 2D video, enabling kinematic analysis of athlete movement without expensive equipment. By tracking these points, the app can provide detailed insights into an athlete’s technique, help optimize performance, and contribute to injury prevention20. Lower-limb joint angles were measured from the medial aspect of the knee to reduce camera-angle confounding.
This is a part of the Natural Motion Capture, which can be particularly beneficial and applied to pediatric or clinical populations. With the Kinetic Lab App, data (images of videos) can be collected easily and re-analyzed later with updated algorithms to increase the longevity and versatility of collected datasets21.
Markerless pose estimate artificial intelligence utilizes video quality enhancement indirectly by providing structural and temporal data for advanced post-processing instead of direct pixel-level quality improvements (e.g., super-resolution, denoising). This provides more context-aware manipulation of the footage in numerous applications22.
The Kinetic Lab App was utilized to pinpoint the exact moment in time the NBA player was injured in the video footage20. The standard settings in the Kinetic Lab App were applied to analyze the video footage, which were the calibration length being 1 millimeter, the target scale being 1, the target contrast being 0.53, and the video speed being 1x. The modes of Measure, Geometry, Measure Angle, and Any, in that particular order, were utilized to measure the angle of the inside part of both of the legs of the injured player. The same method was used for measuring the angle of the inside part of the legs for the defender or opposing player, particularly at the point of contact.
Machine Learning Models
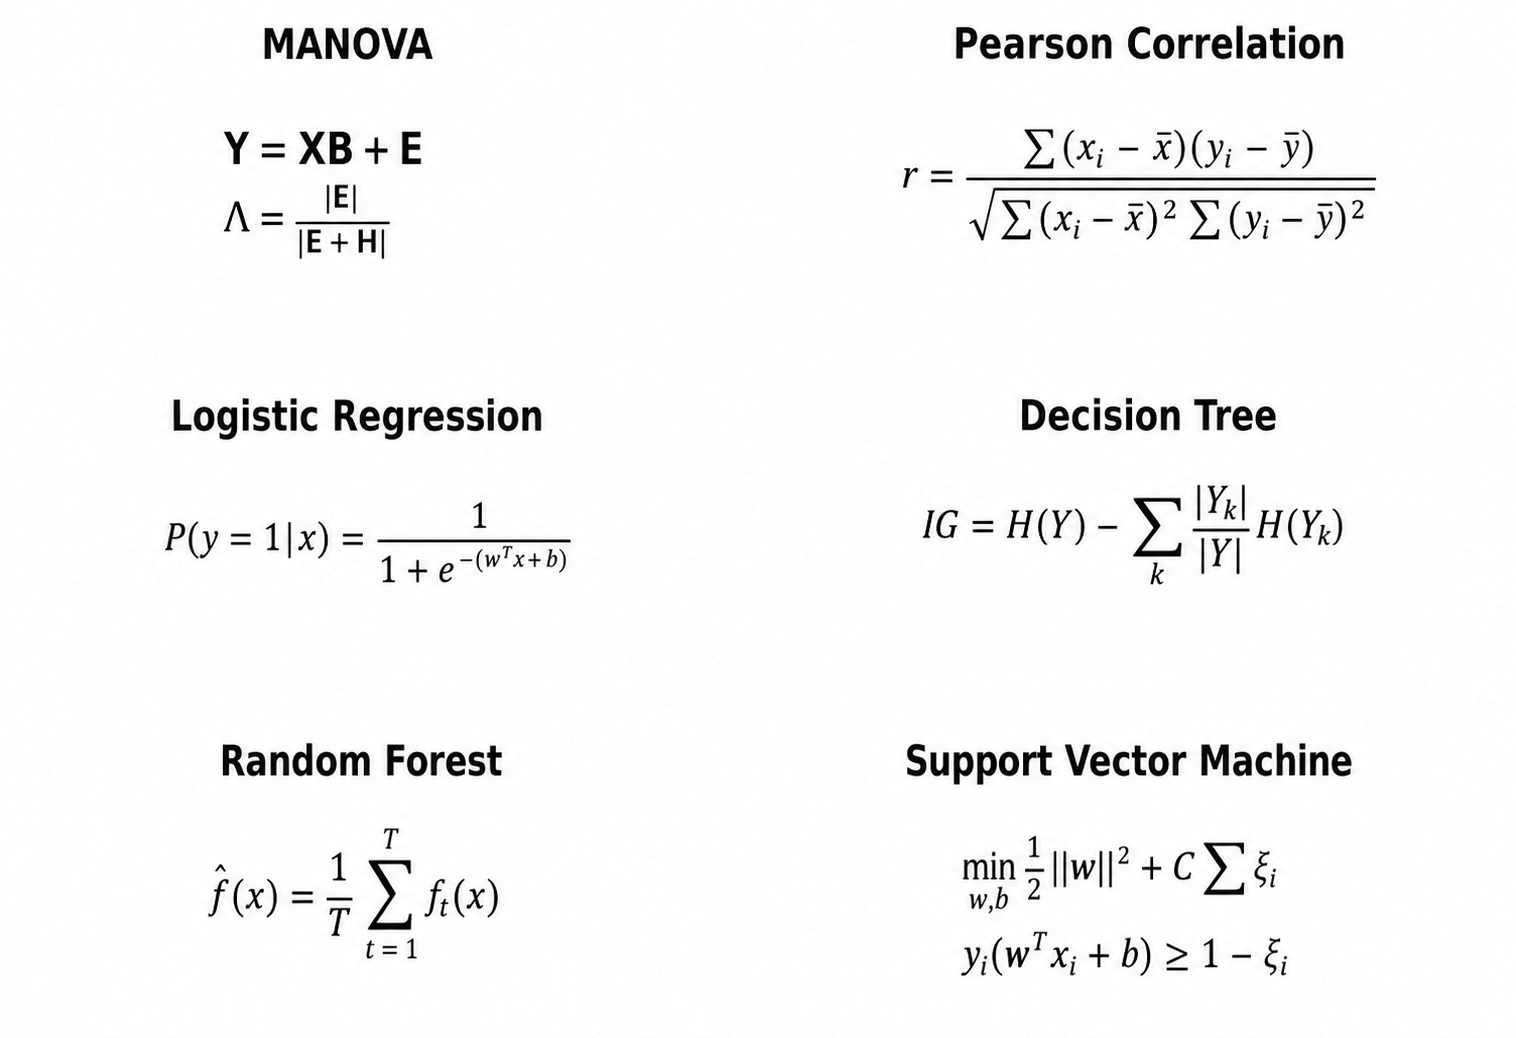
Four classical machine learning models were created in Python(scikit-learn): the Support Vector Machine (SVMs), Logistic Regression (LRs), Decision Tree (DTs), and the Random Forest (RFs). Only contextual and biomechanical features (joint angles, opponent contact variables, anthropometrics) were used. A randomized search with 3-fold cross validation to tune the hyperparameters for each of the models was utilized to prevent overfitting through evaluating model performance on unseen validation folds with sampling different hyperparameter combinations and models. The accuracy, precision, recall, and ROC-AUC metrics with standard deviation for each of the models was measured. The data splits used to visualize the predictive capability of the models was 70%:30% training to testing data. We conducted a Pearson Correlation test and a Multivariate Analysis of Variance (MANOVA) to find any statistical significance within the relationships of the dataset17,23.
We created the classical machine learning models in Python, which were the Support Vector Machine (SVMs), Logistic Regression (LRs), Decision Tree (DTs), and the Random Forest (RFs). The data splits that we used for the models were 80%:20% and 70%:30% training to testing data. The values or choices selected for each of the model hyperparameters were the default options.
Support Vector Machines (SVM) Hyperparameters
- The ‘c’ regularization parameter controls the trade-off between achieving a low training error and a low testing error that generalizes well. A small c regularization value provides more regularization to help prevent overfitting. The regularization parameter ‘c’ was 1.0.
- The kernel is a mathematical function that cleverly maps data into a higher-dimensional space to predict or turn non-linearly separable data into linear separable data without actually transforming the data points. This helps the SVM to find complex decision boundaries. The kernel was ‘linear’ to help find a simple linear hyperplane.
- The gamma hyperparameter helps to define the influence radius of a single training example on the decision boundary. This controls how the SVM perceives similarity between data points. Gamma was set to auto for automatic value selection.
- The ‘tol’ or tolerance in SVM defines the stopping criterion for the iterative optimization algorithm used to train the model. It helps the model to stop working when the model’s improvement on the objective function becomes less than the tolerance value. The tol was 0.001.
- The ‘max_iter’ hyperparameter specifies the hard limit of the maximum number of iterations that the optimization solver will run to fit the model. The max_iter was -1, which means there was no hard limit on iterations within the solver.
- The ‘decision_function_shape’ hyperparameter helps to determine the format of the output of the ‘decision_function’ method for multi-class classification. The ‘decision_function_shape’ was ‘over’ or one-vs-rest and it produces an array of decision value (scores), where one value is tied to each class and the class with the highest score is the estimated prediction.
- The ‘verbose’ hyperparameter controls the amount of logging output that is generated during the operation of the SVM. It helps with monitoring the training process of the SVM and it displays numerical values or status messages. The ‘verbose’ was 0, where no output is generated during the operation of the SVM.
Logistic Regression Hyperparameters
- The ‘penalty’ hyperparameter adds a term to the cost function that will penalize large model weights by adding a certain factor of their magnitude to the model. The penalty option was ‘l2’, so the square of the magnitude was added. This helps the model to be smoother and less sensitive to noisy features.
- The ‘c’ hyperparameter is the inverse of regularization strength, to help the model from overfitting to the training data. The value is 1.0 and there is a moderate amount of regularization being applied.
- The ‘solver’ hyperparameter specifies the optimization algorithm to find the best-fit parameters or coefficients that minimize the loss function. This helps to choose how the model learns from the data. The option selected was ‘lbfgs’ (Limited-Memory Broyden-Fletcher-Goldfarb-Shanno). This optimization can balance speed and memory, handle L1/L2 regularization and multi-class problems well.
- The ‘max_iter’ sets the maximum number of iterations for the solver to converge. The value was 100.
- The ‘fit_intercept’ specifies if a constant, or bias, should be added to the decision function. The option was true.
- The ‘tol’ or tolerance hyperparameter determines the threshold for convergence of the optimization algorithm used to fit the model. The value was 0.0001. The optimization process will stop when the difference between the objective function value (e.g., the loss function value) in the iteration and the current iteration is less than 0.0001.
- The ‘dual’ hyperparameter was False. This helps the optimization algorithm to solve the standard, primal form of the logistic regression problem.
Decision Tree Hyperparameters
- The ‘criterion’ hyperparameter measures the quality of a split or decides how to best partition data at each node. The criterion used was the default option, Gini.
- The ‘splitter’ hyperparameter selects the strategy used to choose the split at each node. The option of best was used. The algorithm chooses the most effective feature and threshold for the split at each node.
- The ‘max_depth’ hyperparameter controls the maximum number of levels (or splits) the tree is allowed to grow, directly influencing model complexity to balance bias (underfitting) and variance (overfitting). The ‘max_depth’ was the option of None. This allows nodes to expand until all leaves are pure (contain only one class of samples) or until they contain fewer than min_samples_split samples, leading to a fully grown, potentially overfit tree.
- The ‘min_samples_split’ hyperparameter defines the minimum number of samples (data points) required in a node for that node to be eligible for splitting further. The ‘min_samples_split’ value was 2.
- The ‘min_samples_leaf’ hyperparameter refers to the minimum number of samples that is required to be at a leaf node. It helps to control the size of the leaf nodes and prevent the model from overfitting to the training data. The ‘min_samples_leaf’ hyperparameter is the value of 1.
- The ‘max_features’ hyperparameter helps to control the number of features considered when looking for the best split at each node in the tree. The option None was used. If the option was None, the algorithm considers all features when searching for the best split.
- The ‘random_state’ hyperparameter helps to control the randomness involved in the algorithm’s training process. The option None was used. The Decision Tree was built using a different, random selection of features at each node split during the fitting process.
- The ‘min_impurity_decrease’ hyperparameter defines the minimum decrease in the impurity that is required for a node to be split. A node will be split if the split results in a decrease in impurity greater than or equal to this value. This hyperparameter was the value of 0.0.
Random Forest Hyperparameters
- The ‘n_estimators’ determine the number of individual decision trees in the forest (commonly 100-1000). The value was 100. Each of the 100 trees is trained on a random subset of the original training data and considers a random subset of features at each split. The trees are decorrelated and the errors are independent of each other.
- The ‘max_features’ determines the number of random features to consider at each node split. The option was sqrt. It further helps to decorrelate the individual trees in the model.
- The ‘max_depth’ limits the maximum levels each tree can grow to prevent overfitting. The option was none so this means each individual decision tree within the random forest is allowed to grow as deep as possible and capture complex patterns.
- The ‘min_samples_split’ determines the minimum number of samples required to split an internal node. The value was 2.
- The ‘min_samples_leaf’ determines the minimum number of samples that must be present in a leaf node. The value was 1. This allows the individual trees the maximum freedom to grow since the ensemble process of the random forest can manage overfitting.
- The ‘bootstrap’ is sampling with replacement. The algorithm will randomly select data points from the original dataset and then it will be put back into the pool of available data. The data point can be selected again for the same tree. The option was true, so bootstrapping takes place.
Results
Dataset Overview
A total of 36 video events were analyzed, including 18 ACL injury events and 18 non-injury control events. Among injury cases, 13 involved right-leg ACL injuries and 13 involved left-leg ACL injuries. Each event contributed a single representative video frame for analysis. All machine learning models were evaluated using 3-fold cross-validation, and performance metrics are reported as mean ± standard deviation. Three-fold cross-validation was selected to balance robustness of performance estimation with class representation stability given the limited sample size.
MANOVA and Correlation Analysis
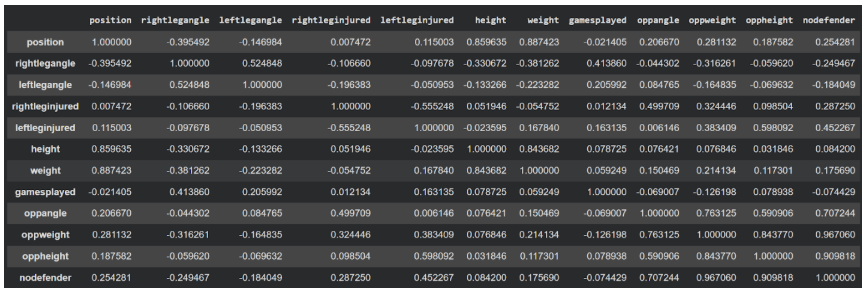
A multivariate analysis of variance (MANOVA) was conducted to assess whether a grouped set of biomechanical and contextual variables (leg angles, opponent contact characteristics, anthropometric measures, and gameplay context) was associated with ACL injury status. When modeling right-leg ACL injury status as the dependent variable, the multivariate effect was statistically significant (p = 0.0075), indicating that the combined predictor set explained a meaningful proportion of variance in injury classification. A separate MANOVA using left-leg ACL injury status as the dependent variable revealed an even stronger multivariate association (p = 0.0004), also demonstrating statistical significance. The Pearson correlation analysis (Fig. 2) revealed generally weak to moderate pairwise associations among individual variables. Moderate positive correlations were observed between left-leg injury status and opponent weight and defender status, as well as between right-leg injury status and opponent leg angle. No single variable demonstrated a strong univariate association, motivating the use of multivariate machine learning models17,23.
Cross Validated Model Performance
Right-Leg ACL Injury Classification
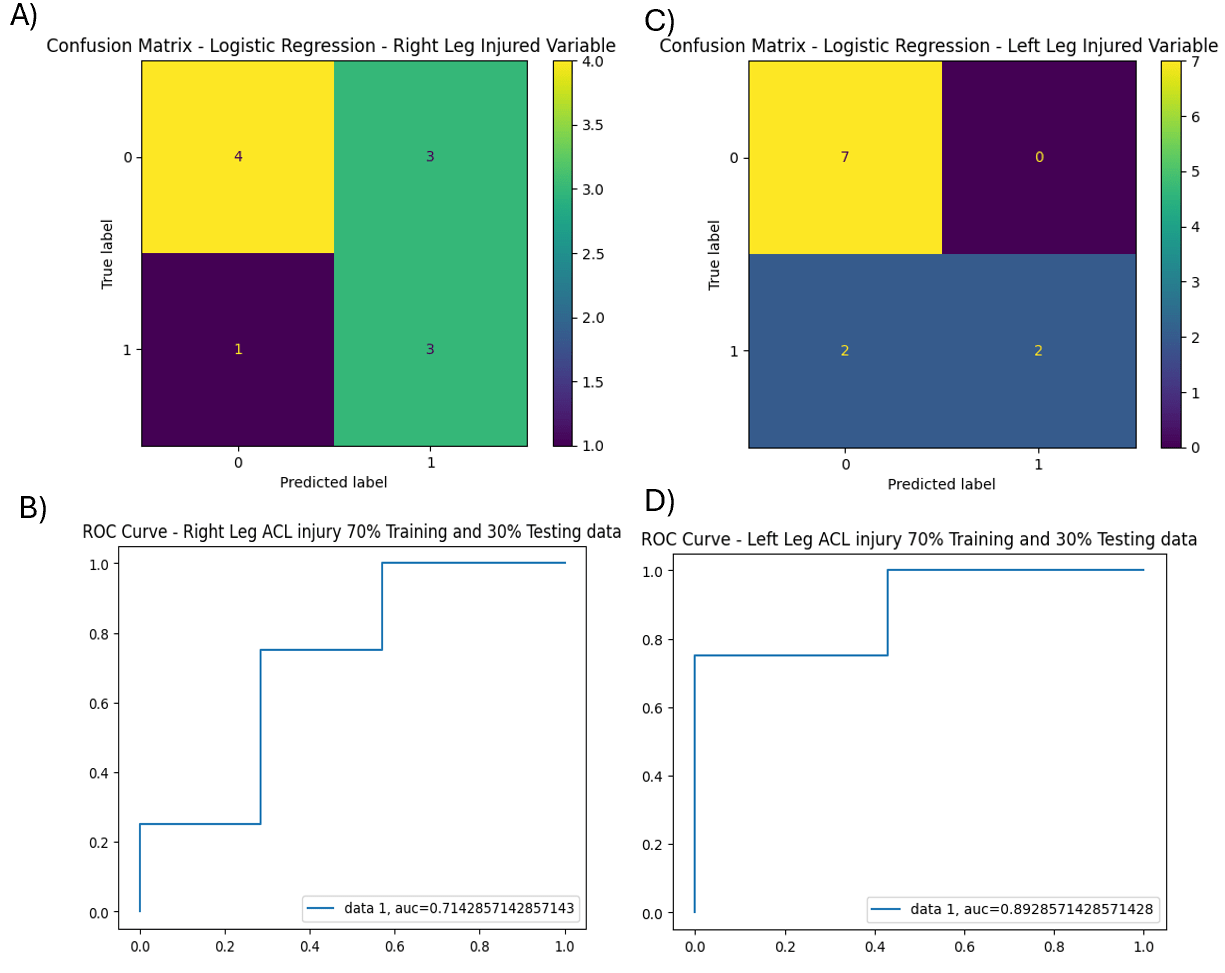
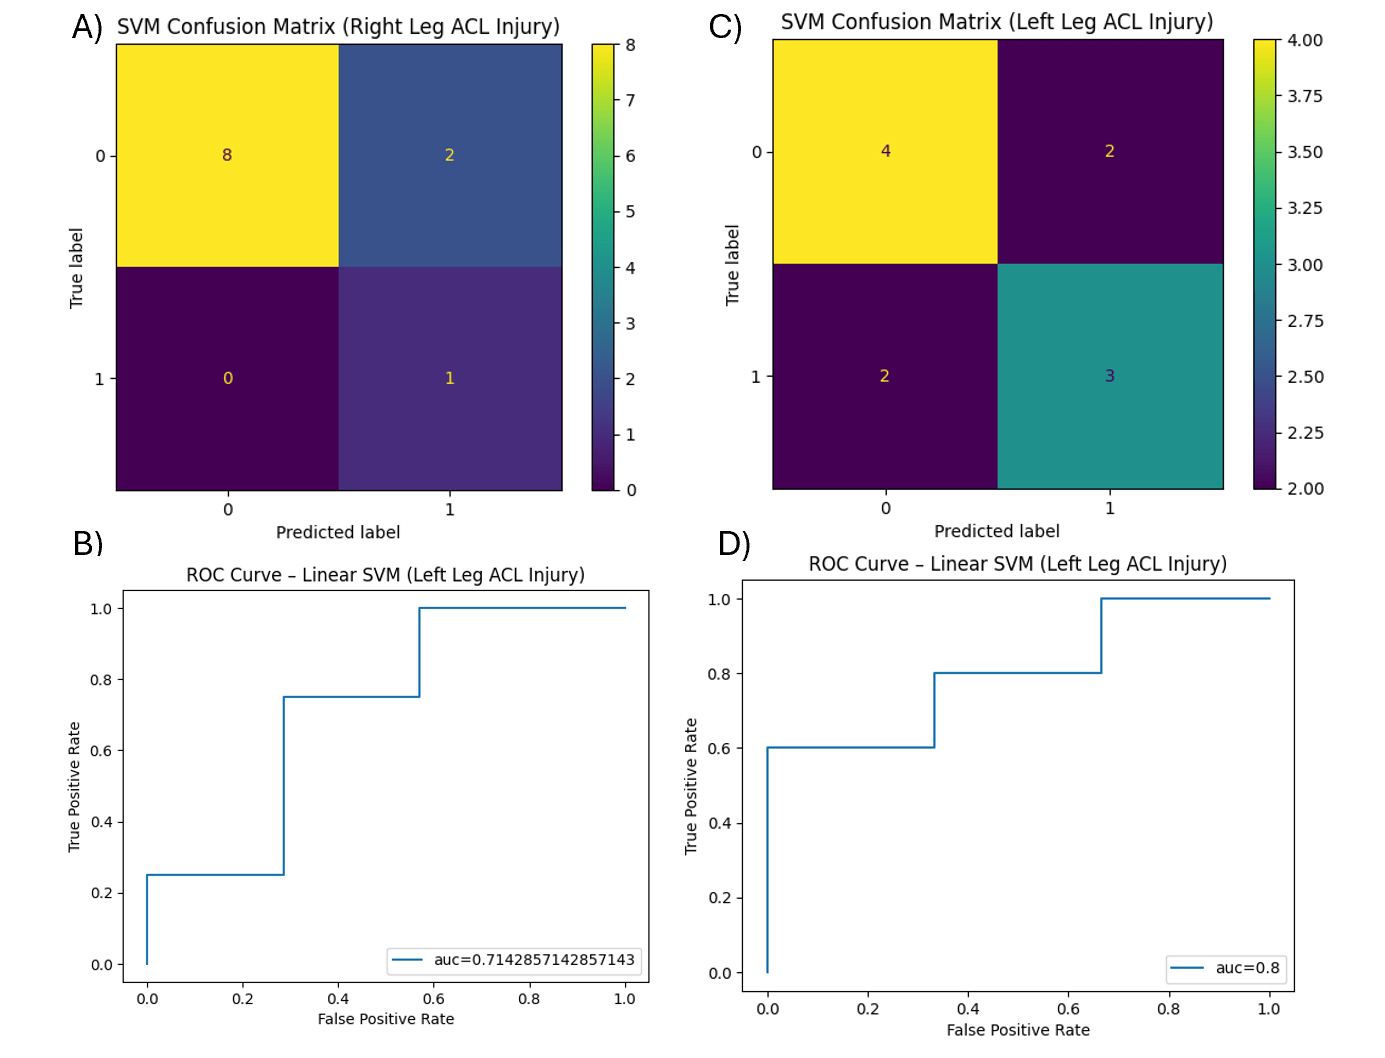
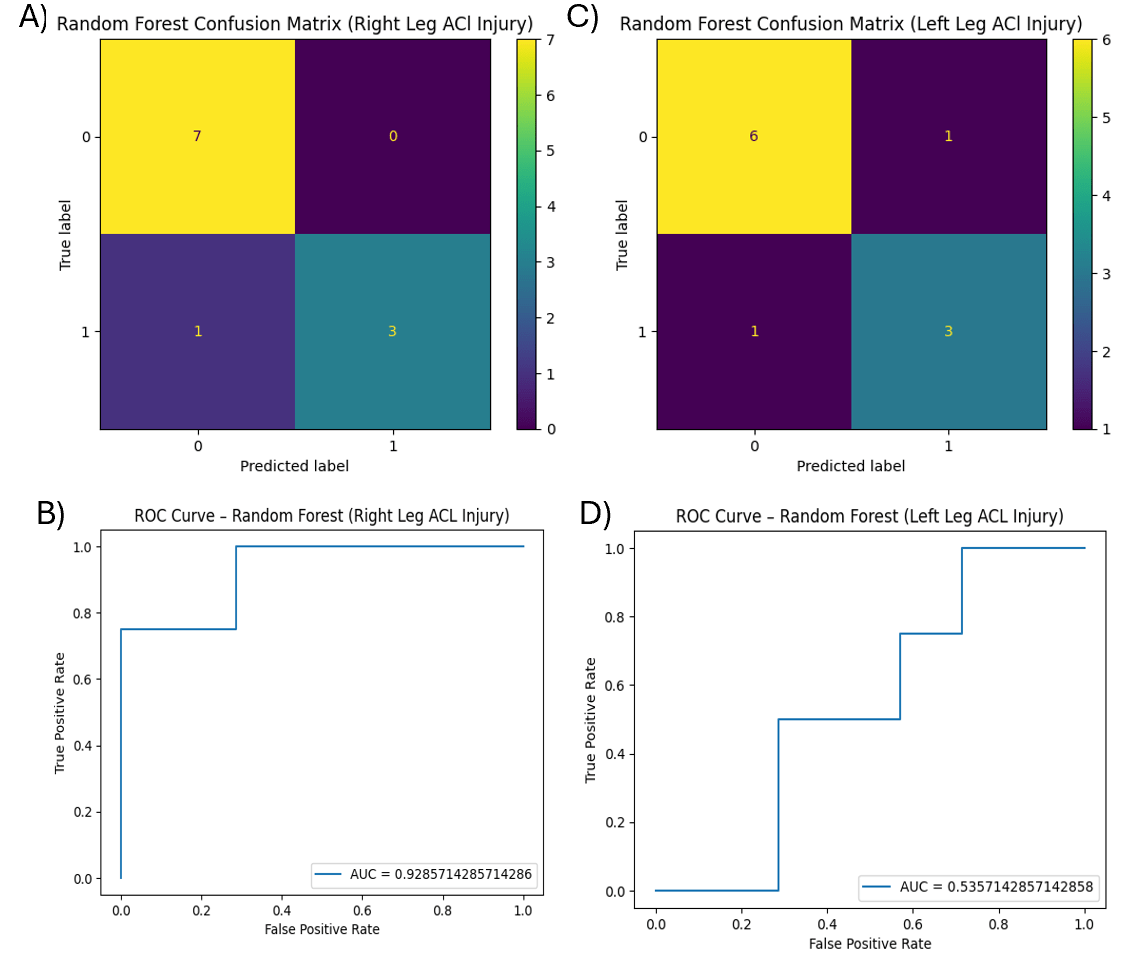
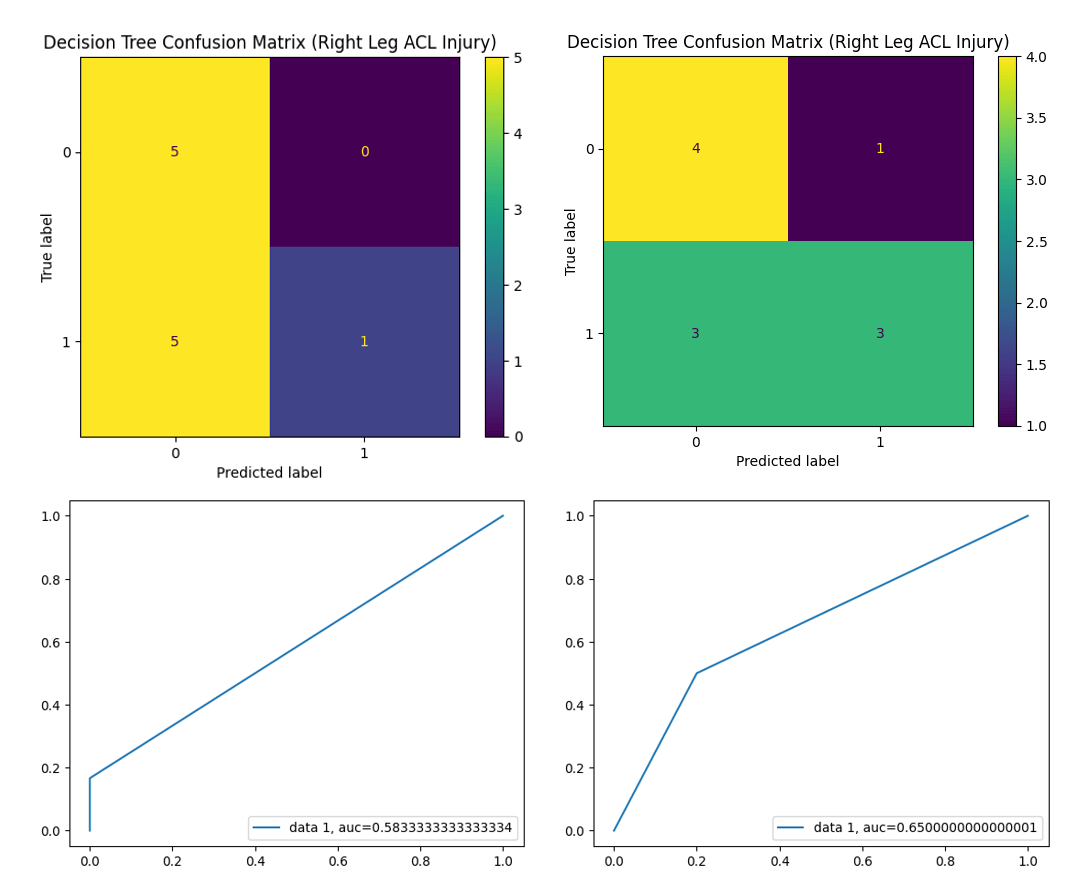
Cross-validated classification performance for right-leg ACL injury status is summarized in Fig. 3. Logistic Regression and Random Forest possessed the best performance overall with the highest accuracy, precision, and AUC whilst having lower variance. The Logistic Regression achieved a mean AUC of 0.85 ± 0.05, while Random Forest achieved a mean AUC of 0.79 ± 0.12. Support Vector Machine and Decision Tree models demonstrated lower and more variable performance across fold.
Left-Leg ACL Injury Classification
Performance for left-leg ACL injury classification is summarized in Fig. 4. Random Forest achieved the highest mean accuracy (0.83 ± 0.06) and AUC (0.85 ± 0.05), followed by Logistic Regression (AUC = 0.83 ± 0.19). Decision Tree and Support Vector Machine models exhibited greater variability in recall and F1 scores.
Representative-Single Split performance
To visualize classifier behavior and class-specific error patterns, representative confusion matrices and ROC curves from a single 70/30 train–test split are shown in Figures 3–6. Confusion matrices illustrate true positive, true negative, false positive, and false negative classifications for each model and injury outcome. ROC curves demonstrate the tradeoff between sensitivity and specificity across classification thresholds.
Logistic Regression Model
Support Vector Machine Model (SVM)
Random Forest
Decision Tree
Feature Importance Metrics
Feature importance analysis (Figure 7) revealed which variables were most characteristic and could be best utilized to classify ACL injuries.
Right Leg ACL Injury
The top five most important features for the Right Leg ACL being injured on average were (1) The angle of contact from the opposing player, (2) the Left leg angle of the injured player, (3) The Right leg angle of the injured player, (4) the opponent weight and (5) the number of games played (Figure 7a)
Left Leg ACL Injury
The top five most important features for the Left Leg ACL being injured on average were the (1) The opponent height ,(2) the Angle of Contact From the Opposing Player, (3) Left Leg Angle of the Injured Player, (4) the opponent weight and (5) the number of games played (Figure 7b.)
Discussion
Objective
This study examined whether biomechanical and contextual features extracted from broadcast basketball footage are jointly associated with ACL injury-side classification using interpretable machine learning models. Rather than attempting injury prediction, this work focuses on post-hoc classification of injury events to characterize biomechanical patterns present at the time of injury.
Statistical Context and Multivariate findings
The MANOVA results provide important statistical context for the machine learning findings. Significant multivariate effects were observed for both right-leg (p = 0.0075) and left-leg (p = 0.0004) injury classifications, indicating that lower-limb joint angles, opponent contact characteristics, and player context variables collectively differentiate injury and non-injury cases. The stronger significance observed for left-leg injuries suggests a more pronounced multivariate separation. This interpretation is consistent with the weak univariate correlations observed in Figure 2, which suggest that individual variables alone are insufficient to explain injury occurrence17,23.
Model Performance Interpretation
Across both injury-side classifications, Random Forest models demonstrated the most consistent and robust performance, achieving high mean AUC values with comparatively lower variability across cross-validation folds (Tables. 1–2). Specifically, the Random Forest outperformed all the models in every metric when predicting left leg ACL injuries, and only slightly lagged behind the Logistic Regression model in accuracy of predicting right leg ACL injuries (it still performed well when predicting right leg ACL injuries). This is expected given that Random Forest is an ensemble method that aggregates multiple decision trees trained on bootstrapped samples, thereby reducing variance and improving robustness in small, heterogeneous datasets. The significant multivariate effects observed in the MANOVA further suggest that ACL injury events arise from joint interactions among the variables, a structure well suited to ensemble-based classifiers. Logistic Regression also performed well, exhibiting stable classification performance across folds and offering the advantage of interpretability through its linear structure. Decision Tree and Support Vector Machine models showed greater variability across cross-validation folds, reflecting increased sensitivity to training–validation sample composition in the limited dataset. The Logistic Regression model could better classify right leg ACL injuries whilst all other three models performed better at classifying left leg ACL injuries (Figs. 3-4)17,22,23.
Feature Importance and Biomechanical Interpretation
Feature importance analysis derived from the Random Forest models (Figure 7) provides additional insights into factors associated with ACL injury-side classification. Notably, differences were observed between injury-side classifications. In the left-leg injury model, opponent variables, particularly opponent height and weight, ranked higher in feature importance, whereas in the right-leg injury model, lower-limb joint angles and contact angles were more dominant. One potential explanation for this difference relates to player handedness and driving direction. Because the majority of basketball players are right-handed (approximately 94.9%), offensive movements frequently involve drives toward the right side of the body. In such scenarios, defenders attempting to cut off the drive may initiate contact on the left side of the offensive player’s body, while the right leg is positioned farther from the defender. This could plausibly increase the influence of opponent size and contact-related variables on left-leg injury events, while right-leg injuries may be more strongly associated with the athlete’s own lower-limb positioning and joint angles at the time of movement. Although this relationship is associative, the ability of Random Forest feature importance to uncover such mechanisms highlights the value of interpretable ensemble methods for exploring complex, context-dependent injury mechanisms in real-world sports settings17,22.
Implications and Significance
These findings contribute to the growing body of video-based ACL injury research by demonstrating that meaningful biomechanical patterns can be extracted from realistic broadcast footage using interpretable machine learning models. Unlike prior studies that rely on laboratory motion capture systems or deep learning architectures, this work emphasizes transparency, robustness, and real-world applicability. The results suggest that ensemble and linear machine learning models can serve as valuable analytical tools for exploring injury mechanisms in competitive sports environments, with potential relevance for coaching, performance analysis, and injury prevention research.
Limitations
Despite the insights discerned from the study, several limitations should be acknowledged. These include the modest sample size and the camera-angle confounding due to the limited footage publicly available. Furthermore, the study only incorporated the inner knee join angle and did not incorporate biometric factors such as the foot angle or the hip alignment. Additionally, the post-hoc study design does not allow for inferences regarding injury risk prior to injury occurrence, and feature importance results represent associative patterns rather than causal relationships22.
Some future directions with the research is to include incorporating biomechanical features such as measurements (e.g., foot angle, torso rotations, hip alignment), nutritional regimen data, workout exercise data, and experimenting with more advanced architectures (e.g., LSTMs, RNNs, CNNs). Furthermore, increasing the size of our dataset by examining more NBA footage or extending the scope of the study to all professional basketball players may provide more insightful results. The same model workflow could analyze various extended frames of the video. Additionally, applying this workflow to analyze video footage of other knee-related injuries (e.g., torn meniscus, tear of medial collateral ligament (MCL), tear of lateral collateral ligament (LCL), posterior cruciate ligament (PCL) tear, dislocated kneecap, patellar tendon tears, patellar fracture). Practice and workout footage of the athletes could also be analyzed to find out if their exercise regimens and exercise movements could be causing ACL injury potential. Video footage that might have some other advantageous angles (e.g., camera angles that are behind the NBA players) could be requested from the NBA. Some imaging resolution and image contrast techniques can be implemented in Python include Brightness and Contrast Adjustment, Gaussian blur noise reduction, sharpening, Contrast Limited Adaptive Histogram Equalization (CLAHE), and the’ basics’ framework built on top of PyTorch/TensorFlow. All of these strategies and approaches could be used for sharper biomechanical data analysis.
Closing Perspective
Despite its limitations, this study demonstrates that interpretable machine learning applied to real-world sports footage can yield meaningful insights into ACL injury events. This work provides a foundation for future research seeking to bridge sports analytics and biomechanical injury science.
References
- J. Taborri, L. Molinaro, A. Santospagnuolo, M. Vetrano, M.C. Vulpiani, S. Rossi. Machine-Learning Approach to Measure the Anterior Cruciate Ligament Injury Risk in Female Basketball Players. Sensors. Vol. 21, (9):3141, 2021, https://pubmed.ncbi.nlm.nih.gov/33946515/. [↩]
- C.V. Andreoli, B.C. Chiaramonti, E. Biruel, A.C. Pochini, B. Ejnisman, M. Cohen. Epidemiology of sports injuries in basketball: integrative systematic review. BMJ Open Sport Exerc Med. Vol. 4, e000468, 2018, https://pubmed.ncbi.nlm.nih.gov/30687514/. [↩]
- G.D. Myer, K.R. Ford, J.L. Brent, T.E. Hewett. Differential neuromuscular training effects on ACL injury risk factors in “high-risk” versus “low-risk” athletes. BMC Musculoskelet. Disord. Vol. 8, 8:39, 2007, https://pubmed.ncbi.nlm.nih.gov/17488502/. [↩]
- L.J. Wang, N. Zeng, Z.P. Yan, J.T. Li, G.X. Ni. Post-traumatic osteoarthritis following ACL injury. Arthritis Res Ther. Mar Vol. 24, 22(1):57, 2020, https://pubmed.ncbi.nlm.nih.gov/32209130/. [↩]
- P. Neuman, M. Englund, I. Kostogiannis, T. Friden, H. Roos, L.E. Dahlberg. Prevalence of tibiofemoral osteoarthritis 15 years after nonoperative treatment of anterior cruciate ligament injury: a prospective cohort study. Am J Sports Med. Vol. 36, 1717–1725, 2008, https://pubmed.ncbi.nlm.nih.gov/18483197/. [↩]
- Tamimi I, Ballesteros J, Lara AP, et al. A Prediction Model for Primary Anterior Cruciate Ligament Injury Using Artificial Intelligence. Orthopaedic Journal of Sports Medicine. Vol. 9 , (9), 2021, https://pubmed.ncbi.nlm.nih.gov/34568504/. [↩]
- K.M. Bojicic, M.L. Beaulieu, D.Y. Imaizumi Krieger, J.A. Ashton-Miller, E.M. Wojtys. Association Between Lateral Posterior Tibial Slope, Body Mass Index, and ACL Injury Risk. Orthopaedic Journal of Sports Medicine. Vol. 5, (2), 2017, https://pubmed.ncbi.nlm.nih.gov/28255568/. [↩] [↩]
- A. Pareek, D.H. Ro, J. Karlsson, R.K. Martin. Machine learning/artificial intelligence in sports medicine: state of the art and future directions. Journal of ISAKOS, Vol. 9, Issue 4, 635 – 644, 2024, https://pubmed.ncbi.nlm.nih.gov/38336099/. [↩]
- C. Leckey, N. Van Dyk, C. Doherty, A. Lawlor, E. Delahunt. Machine learning approaches to injury risk prediction in sport: a scoping review with evidence synthesis. Br J Sports Med. Vol. 59, (7), 491-500, 2025, https://pubmed.ncbi.nlm.nih.gov/39613453/. [↩]
- L. Guo, Z. Cui, W.P. Loh, S. Shaharudin. Prediction of ACL injury incidence and analysis of key features in basketball players based on multi-algorithm models. Peer J Life and Environment. Vol. 13, e20141. https://pmc.ncbi.nlm.nih.gov/articles/PMC12533536/. [↩]
- A. Gokeler, A. Grassi, R. Hoogeslag, A Van Houten, T. Lehman, C. Bolling, M. Buckthorpe, G. Norte, A. Benjaminse, P. Heuvelmans, S. Di Paolo, I. Tak, F.D. Villa. Return to sports after ACL injury 5 years from now: 10 things we must do. J Exp Orthop. Vol. 9, (1):73, 2022, https://pubmed.ncbi.nlm.nih.gov/35907095/. [↩]
- Y. Yang, F. Mohammadzadeh, M. Khishe, N.A. Ahmed, M.M. Moseh Abualhaj M.M, T.M. Ghazal. Deep learning for sports motion recognition with a high precision framework for performance enhancement. Nature Science Reports, Vol. 15, 2025, https://pubmed.ncbi.nlm.nih.gov/41198767/. [↩]
- A. Wilson, A. CORR Synthesis: Can Decision Tree Learning Advance Orthopaedic Surgery Research? Clinical Orthopaedics and Related Research, Vol. 12. 2023, https://pmc.ncbi.nlm.nih.gov/articles/PMC10642865/. [↩] [↩]
- J. Yuan, Q. Zeng, J. Li, Z. Cong, & Y. Zhang. Machine learning applications in sports injury prediction. Science Progress, Vol. 108, (4). https://doi.org/10.1177/00368504251385956. [↩]
- S. Edriss, C. Romagnoli, L. Caprioli, V. Bonaiuto, E. Padua, G. Annino. Commercial Vision Sensors and AI-Based Pose Estimation Frameworks for Motion Analysis in Sports and Exercises: A Mini Review, Frontiers in Physiology, 2025, https://www.frontiersin.org/journals/physiology/articles/10.3389/fphys.2025.1649330/full. [↩]
- L. Wade, L. Needham, P. McGuigan, J. Bilzon. Applications and limitations of current markerless motion capture methods for clinical gait biomechanics. Peer J Life & Environment, Vol. 10, 2022, https://pubmed.ncbi.nlm.nih.gov/35237469/. [↩]
- M. Dunn, A. Kennerley, K. Webster, K. Middleton & J. Wheat. Application of video interpolation to markerless movement analysis, ISEA, 2022, https://docs.lib.purdue.edu/cgi/viewcontent.cgi?article=1026&context=resec-isea. [↩] [↩] [↩] [↩] [↩] [↩]
- Sports References LLC & Sports Radar. Basketball Statistics & History of every Team & NBA and WNBA players. Basketball. 2024, https://www.basketball-reference.com/. [↩]
- The National Basketball Association. The official site of the NBA for the latest NBA scores, Stats & News. The NBA. 2024, https://nba.com/. [↩]
- KineticLab. (n.d.). AI powered video analysis for movement. KineticLab. 2024, https://home.mykineticlab.com/. [↩] [↩]
- S. Chen, W. Gou, & R. Gao. Gait differences after ACL reconstruction versus healthy controls: A three-level meta-analysis of kinematics, kinetics, and spatiotemporal parameters. Annals of Medicine, Vol. 57, (1), 2025, https://pubmed.ncbi.nlm.nih.gov/41403072/. [↩]
- Y. Kamatsuki, M.S. Qvale, K. Steffen, A. Wangensteen, T. Krosshaug. Anatomic risk factors for initial and secondary noncontact anterior cruciate ligament injury. American Journal of Sports Medicine, Vol. 53, (1), 123–131, 2025, https://pubmed.ncbi.nlm.nih.gov/39555633/. [↩] [↩] [↩] [↩]
- A. Sundberg, J. Hogberg, F. Tosarelli, M. Buckthorpe, F.D. Villa, M. Hagglund, K. Samuelsson, E.H. Senorski. Sport-specific injury mechanisms and situational patterns of ACL injuries. Sports Medicine, Vol. 55, (10), 2489–2527, https://pubmed.ncbi.nlm.nih.gov/40690162/. [↩] [↩] [↩] [↩]


