
Abstract
Ninhydrin (2,2-dihydroxyindane-1,3-dione) is a well-known chemical mainly used to detect ammonia or primary and secondary amines. This C9H6O4 of ninhydrin reacts with an amino acid, or eccrine component in the fingerprint deposit, and gives out a dark purple product, which is termed Ruhemann’s purple. It is commonly used in forensic scenes to detect fingerprints. This paper will evaluate how different concentrations of the ninhydrin solution affect the clarity of the product given off by using different concentrations, which are 0.5% (w/v), 1.0% (w/v), and 2.0% (w/v). A survey is being made for participants to vote on which of Ruhenmann’s purples is clearest from the image of fingerprints after 20 minutes or 10 hours and 20 minutes. Moreover, the color intensity is measured by using color display value (RGB). All datasets from the survey and the RGB value show a trend of 1.0% (w/v) > 2.0% (w/v) > 0.5% (w/v). The data set from the 1.0% (w/v) concentration gives off the darkest purple and the clearest whirl of the fingerprint. Based on these results, it provides a conclusion that the 1.0% (w/v) ninhydrin solution is a better and more accurate fingerprint detection agent in the field of forensic chemistry to develop the clearest Ruhemann’s purple.
Keywords: Ninhydrin, latent fingerprint detectors, forensic science, Ruhemann’s purple, color analysis, low resource settings
Introduction
Finding an individual’s fingerprints in crime scenes is incredibly important as it can link people to forensic places. Recent technology is also currently improving on the methodology to try to explore the best result1. Some of the common approaches in developing fingerprints are Powder, Cyanoacrylate esters, and ninhydrin2. A fingerprint is formed the second a person touches a surface, leaving an invisible mark on the material3. The ninhydrin solution is the most widely used chemical reagent for the detection of latent fingermarks on porous surfaces such as paper and cardboard. It was first discovered in 1910 by the chemist Siegfried Ruhemann and was then used in many scenarios for biochemical and medical test methods4. It is made of a mixture of zinc and cadmium complexes, which indicate robust luminescence properties that can be exploited for the development of ninhydrin-based fingermarks5. These chemical reactions and luminescence-based readouts provide important selectivity for forensic science applications and protein analysis. The ninhydrin solution worked to detect the presence of amino groups in an amino acid reacted with ninhydrin, which involved oxidate deamination. This property of giving off color can cause the ninhydrin solution to also function as an amino acid detector, as it would appear in different colors after reacting with different amino acids. For example, a yellow color will appear with the presence of proline and hydroxyproline6. The properties of ninhydrin crystals made it a very useful chemical product in the forensic field. Moreover, since amino acids are stable, the ninhydrin solution can help detect the remaining amino acids on surfaces after decades, showing its effectiveness in the field.
The concentration of the ninhydrin solution is rather important, as the conditions in crime scenes vary and are uncontrolled. The amount of amino acid residue is unknown. Since different concentrations of the ninhydrin solution will have different effects on the appearance of Ruhemann’s purple, which are the color intensity and the clarity of the fingerprint, investigating which concentration will produce the clearest product will be crucial for the field. The most used concentration for the ninhydrin solution ranges from 0.5% to 2%, with the composition of additional solvents such as ethanol, potassium acetate, acetic acid, and hydrindantin, depending on each experiment7,4,8. Crown et al demonstrated that a 0.5% solution of ninhydrin in acetone or diethyl ether can be used4. Jasuja, Om Prakash, et al. preferred a 1% concentration to visualize the fingerprints due to the standard concentration range7. Staub et al proved that 0.2% is the optimal concentration. Their experiment also used other concentrations, such as 0.3% (w/v) 0.5% (w/v) 1.0% (w/v) 1.5% (w/v) 2.0% (w/v) 2.5% (w/v)8. This directly impacts the reaction rate and the result. Furthermore, ninhydrin crystals are important as the normal dust and powder method is not as effective as the ninhydrin solution when testing porous surfaces. The clarity matters a lot in forensics, since the details can greatly affect the identification and the comparison during investigation. Having a concentration that is too low will cause the fingerprint to appear faint or not appear at all, while too high a concentration will cause overdevelopment and blurriness9. Experimentally determining the best concentration of the ninhydrin solution can help detect fingerprints in forensic scenes. Identifying the optimal concentration can improve the reliability of fingerprint developments and provide investigators with a more effective method at latent fingerprints.
Conducting the experiment in a low resource setting is important as not every country can access the tools for the method. This setting usually refers to low-to-middle-income countries or developing countries, restricting their access to technologies. It could be because of the country’s geographical and environmental factors or human resource limitations10. Using a lower technical budget is also a more preferable way compared to high technological methods, and is essential in the forensic field11. Low-resource settings research allows countries that can’t access the resources, as high technology methods require expensive equipment12, to better allow the generalizability, since the availability of reactants or solvents varies in different areas of the world.
This research aimed to determine which concentration is the best for detection, based on the comparison of color intensity and the clarity of the fingerprints. Given the various approaches that exist in ninhydrin detection in fingerprints on different methodologies, solvent availability, environment variations, and product concentrations, this paper focused on the approach that could be used in low-resource settings areas. This investigates on how different concentrations of ninhydrin solution prepared in ethanol could affect the clarity and color intensity of latent fingerprints on printing paper.
Hypothesis
It is hypothesized that the concentration of 2.0% (w/v) compared to the two other concentrations, 0.5% and 1.0%, would have the highest intensity and the clearness, as it contains more ninhydrin (C9H6O4) to react with the amino acid. Ways of evaluating include observing the whirl, conducting a survey based on the images, and testing color display values.
Methods
Materials
Different concentration of ninhydrin solution is prepared by mixing 0.5 grams of ninhydrin crystals with 100 mL of ethanol for 0.5% (w/v) concentration; 1 gram of ninhydrin crystals with 100 mL of ethanol for 1.0% (w/v) concentration; and 2 grams of ninhydrin crystals for 2.0% (w/v) concentration. The concentration was calculated by dividing the amount of solute by the volume of the solution. For 0.5% (w/v), it yields 0.5 grams over 100 mL for the concentration, and vice versa for the other two concentrations. The 2% (w/v) was the positive control, as it was the known known standard that is most commonly used according to Staub et al8. It was used as the highest concentration condition to compare the effect of different concentrations on reaction intensity. Ethanol is being chosen as the solvent for the ninhydrin solution as it has been proven as the first preference for multiple paper surfaces13. The surface for this experiment is the normal A4 printing paper, as it is effective in carrying out the reaction.
Procedure
To construct the procedure for the clarity and reaction time section, clean tissue paper was used to wipe the A4 paper to remove all the amino acids remaining. Fingerprint was pressed firmly onto the surface of the clean paper by a single participant using three fingers for three seconds6, then removed without smearing the paper. It is proven that the physical factors, such as pressure and duration of applying fingerprints, could influence the transfer of fingerprints; a single participant could ensure that those factors are as consistent as possible14,7.As the inhalation of the ninhydrin solution may cause central nervous system effects and skin irritation, the experiment was conducted solely under a fume hood with protective equipment under standard lab practices. The ninhydrin solution was transferred to a spraying bottle for application. The surface of the A4 paper was sprayed using the spray bottle. The distance between the spray and the paper was 15 cm and was parallel2. The ninhydrin was sprayed by pressing the spraying bottle five times for each trial. Given that ninhydrin requires time to react with the amino acid residue on the fingerprint, the whirl and the coloration were first recorded after 20 minutes, and an image was taken for further evaluation. The chosen time point is proven as the experiment is taken at room temperature around 23 degrees celsius, and it usually takes around 23 minutes for ninhydrin to react with amino acid in this condition15. Similar to Erin Lange and Felicity Carlysle-Davies who used a 70 degrees Celsius humidity chamber, the method was modified for waiting additional 10 hours6. This method was attempted, but did not work in this case, as elevated temperature may also cause significant background discoloration in some cases9, but the 10 hour waiting period was performed as an alternative method. Therefore, the experiment was conducted at room temperature for the full development of fingerprints. The fingerprints were compared on paper to see which one has a darker purple color and which is the most detailed.
To add a layperson’s perspective, 35 people were surveyed to determine which fingerprint they believed was the clearest from looking at the image of the three trials of different concentrations from 2 timings. The negative control, or the fingerprint with no ninhydrin solution, was not photographed, as it showed no coloration. The observer chose the clearest image out of the three concentrations based on the image. The color display value was produced by uploading the image of the fingerprints into the online RGB value detector technology. The RGB value was measured in bits, referring to bit depth or color depth, showing how many possible levels of color can be represented for each of the three main colors. This allowed the maximum coloration of the fingerprint to be found. Twenty points were selected from the darkest part of the fingerprint, and then all of the numbers from red, green, and blue were added together. The smaller the final value was, the darker Ruheman’s purple was, which could be more easily observed. The final data was calculated from the mean values of those 20 points.
Scientific Analysis
The resulting data was analyzed in three ways. First, the fingerprint from 20 minutes after and 10 hours and 20 minutes was analyzed based on the clarity of the whirl and the completeness of the fingerprint from the 2 test groups. A qualitative analysis was performed. The darker the purple or the more complete the whirl, the more successful the concentration of the ninhydrin solution was. Later on, the images of the three concentrations from the 2 test groups were given out to people to get surveyed. The color display value was also being measured as another aspect to determine the clarity. The values for three different concentrations were compared separately for the 2 test groups to determine the best concentration across all three methods. Moreover, a chi-square analysis was performed to see if the survey answers’ distributions were statistically significant.
Results
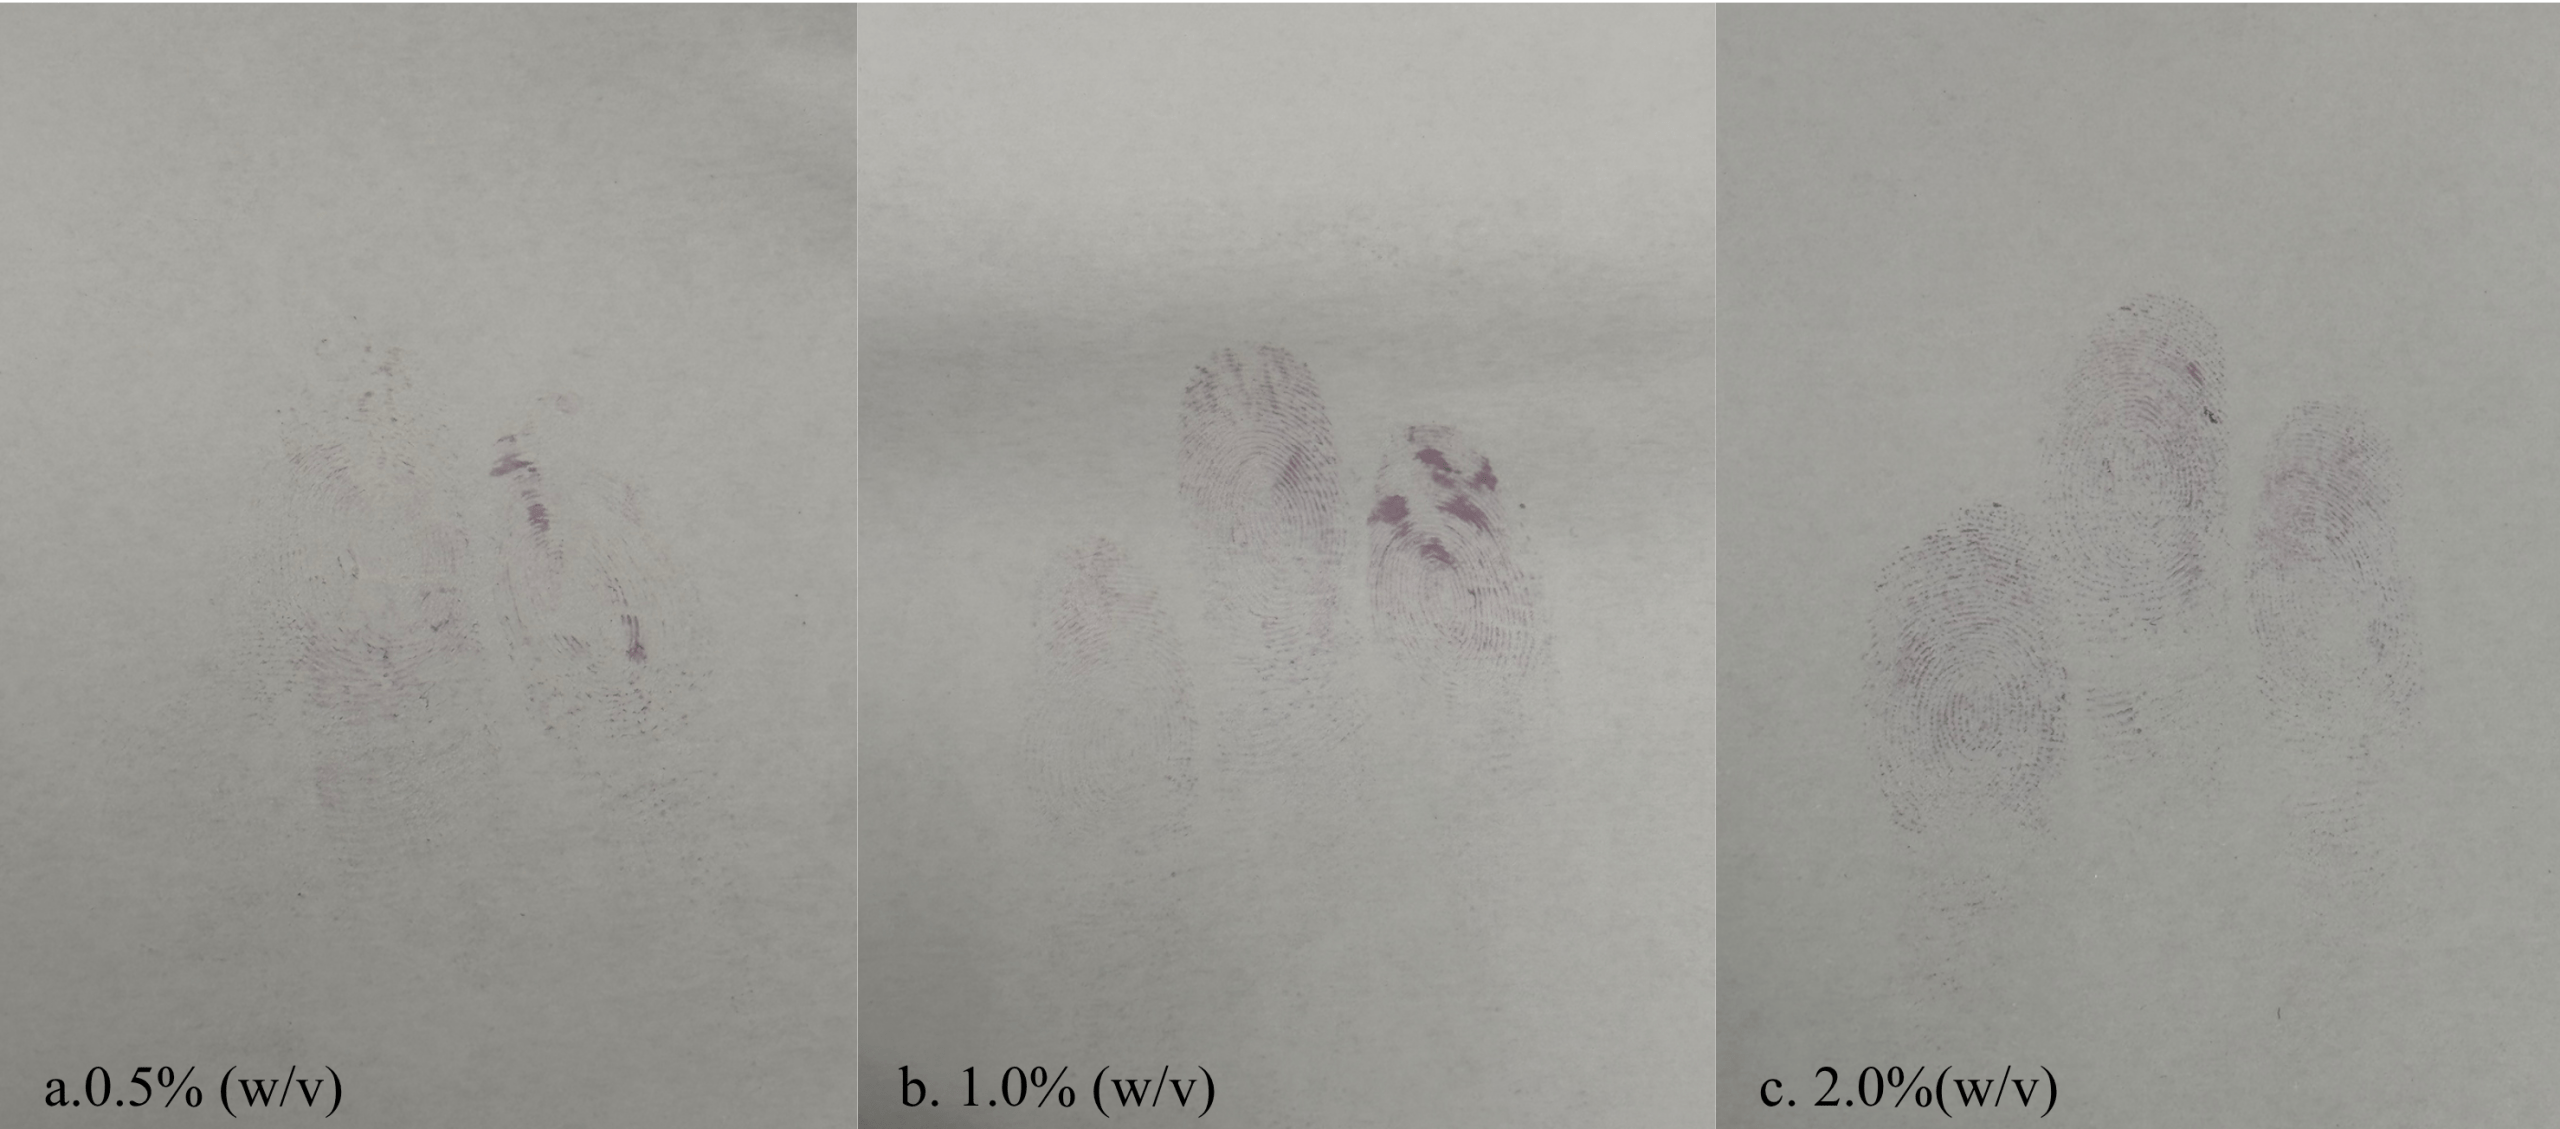
Using qualitative analysis, fingerprints from 1% (w/v) concentration developed after 20 minutes of the reaction show the clearest fingerprint pattern (Figure 1b). It clearly shows the lines and patterns as a whole. Similarly, the clarity of the fingerprint for 2.0% is close to 1.0%, as the participants’ fingerprints are whirls (Figure 1c). The pattern from the 2.0% concentration is more pronounced than the 0.5% concentration, as the whirl is clearer, although the lines are not fully created, and there are many dots. On the other hand, the fingerprint pattern from the 0.5% concentration trial has poor clarity as the color barely shows. Moreover, the lines, which are the pattern in the whirl, did not show up. There is no complete fingerprint circle that can be extrapolated.
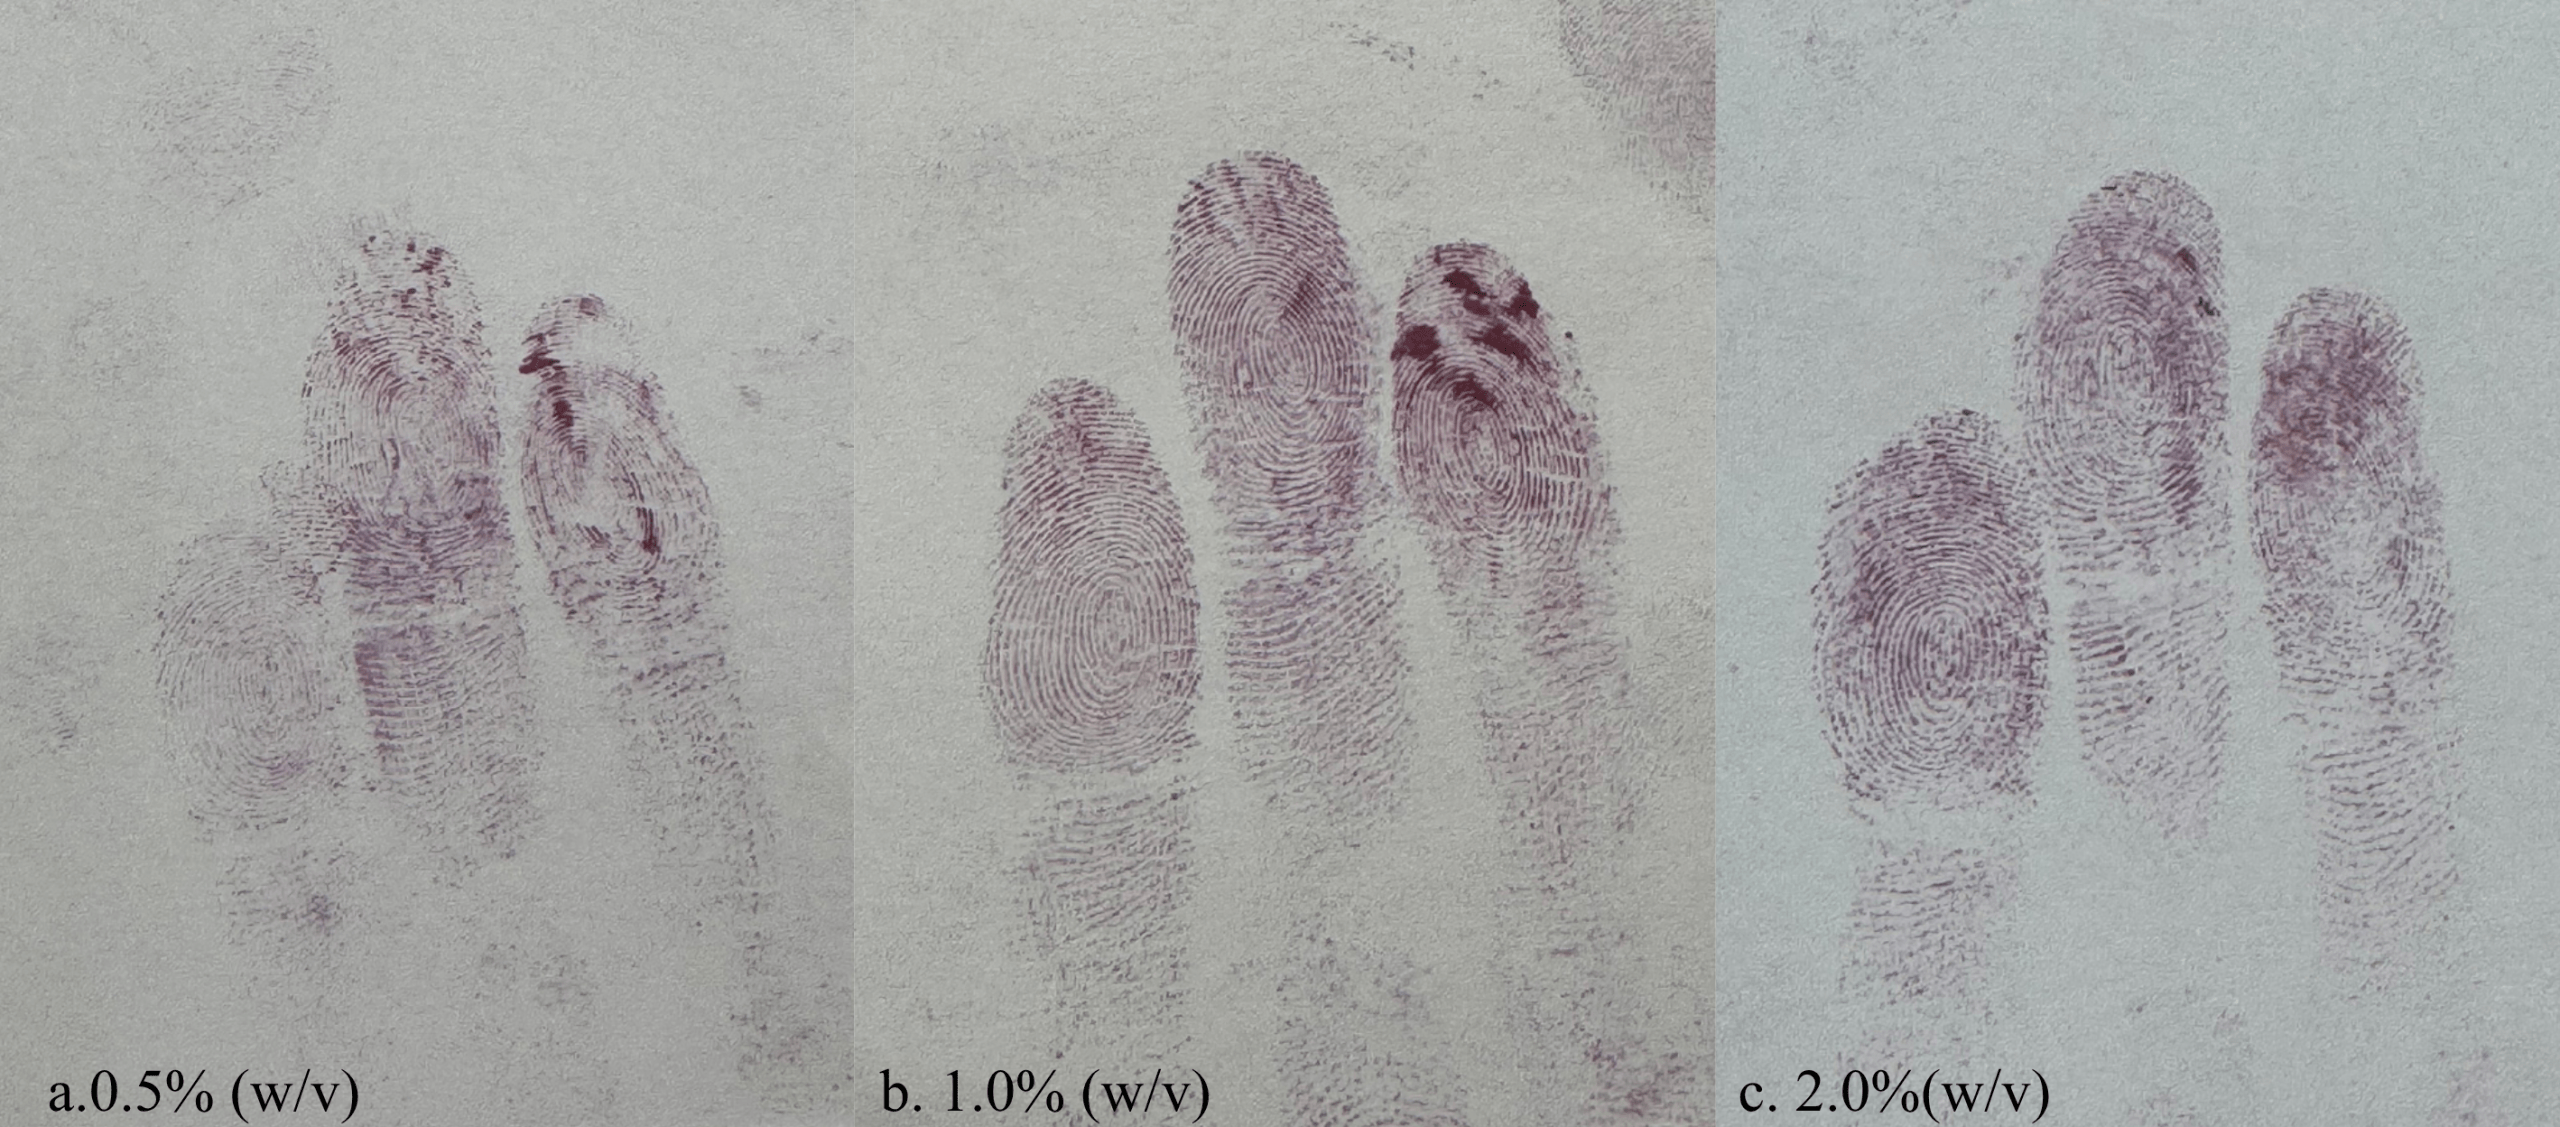
After letting the ninhydrin solution fully react with the amino acids in the fingerprints, which is after 10 hours and 20 minutes, Figure 2 also indicates that the 1.0% concentration resulted in the brightest fingerprints. The image of the 0.5% trials shows incomplete fingerprints, where there are segmented breaks in the whirl, and so does the 2.0% concentration trial (Figures 2a and 2c). The 1.0% concentration trial reveals the clearest image, including clear lines and circles in the whirl pattern (Figure 2b).
| Concentration of Ninhydrin Solution %(w/v) | RGB, in bits, (SD) |
| 0.5% | 153 (SD 7.65) |
| 1.0% | 111 (SD 5.55) |
| 2.0% | 118 (SD 5.9) |
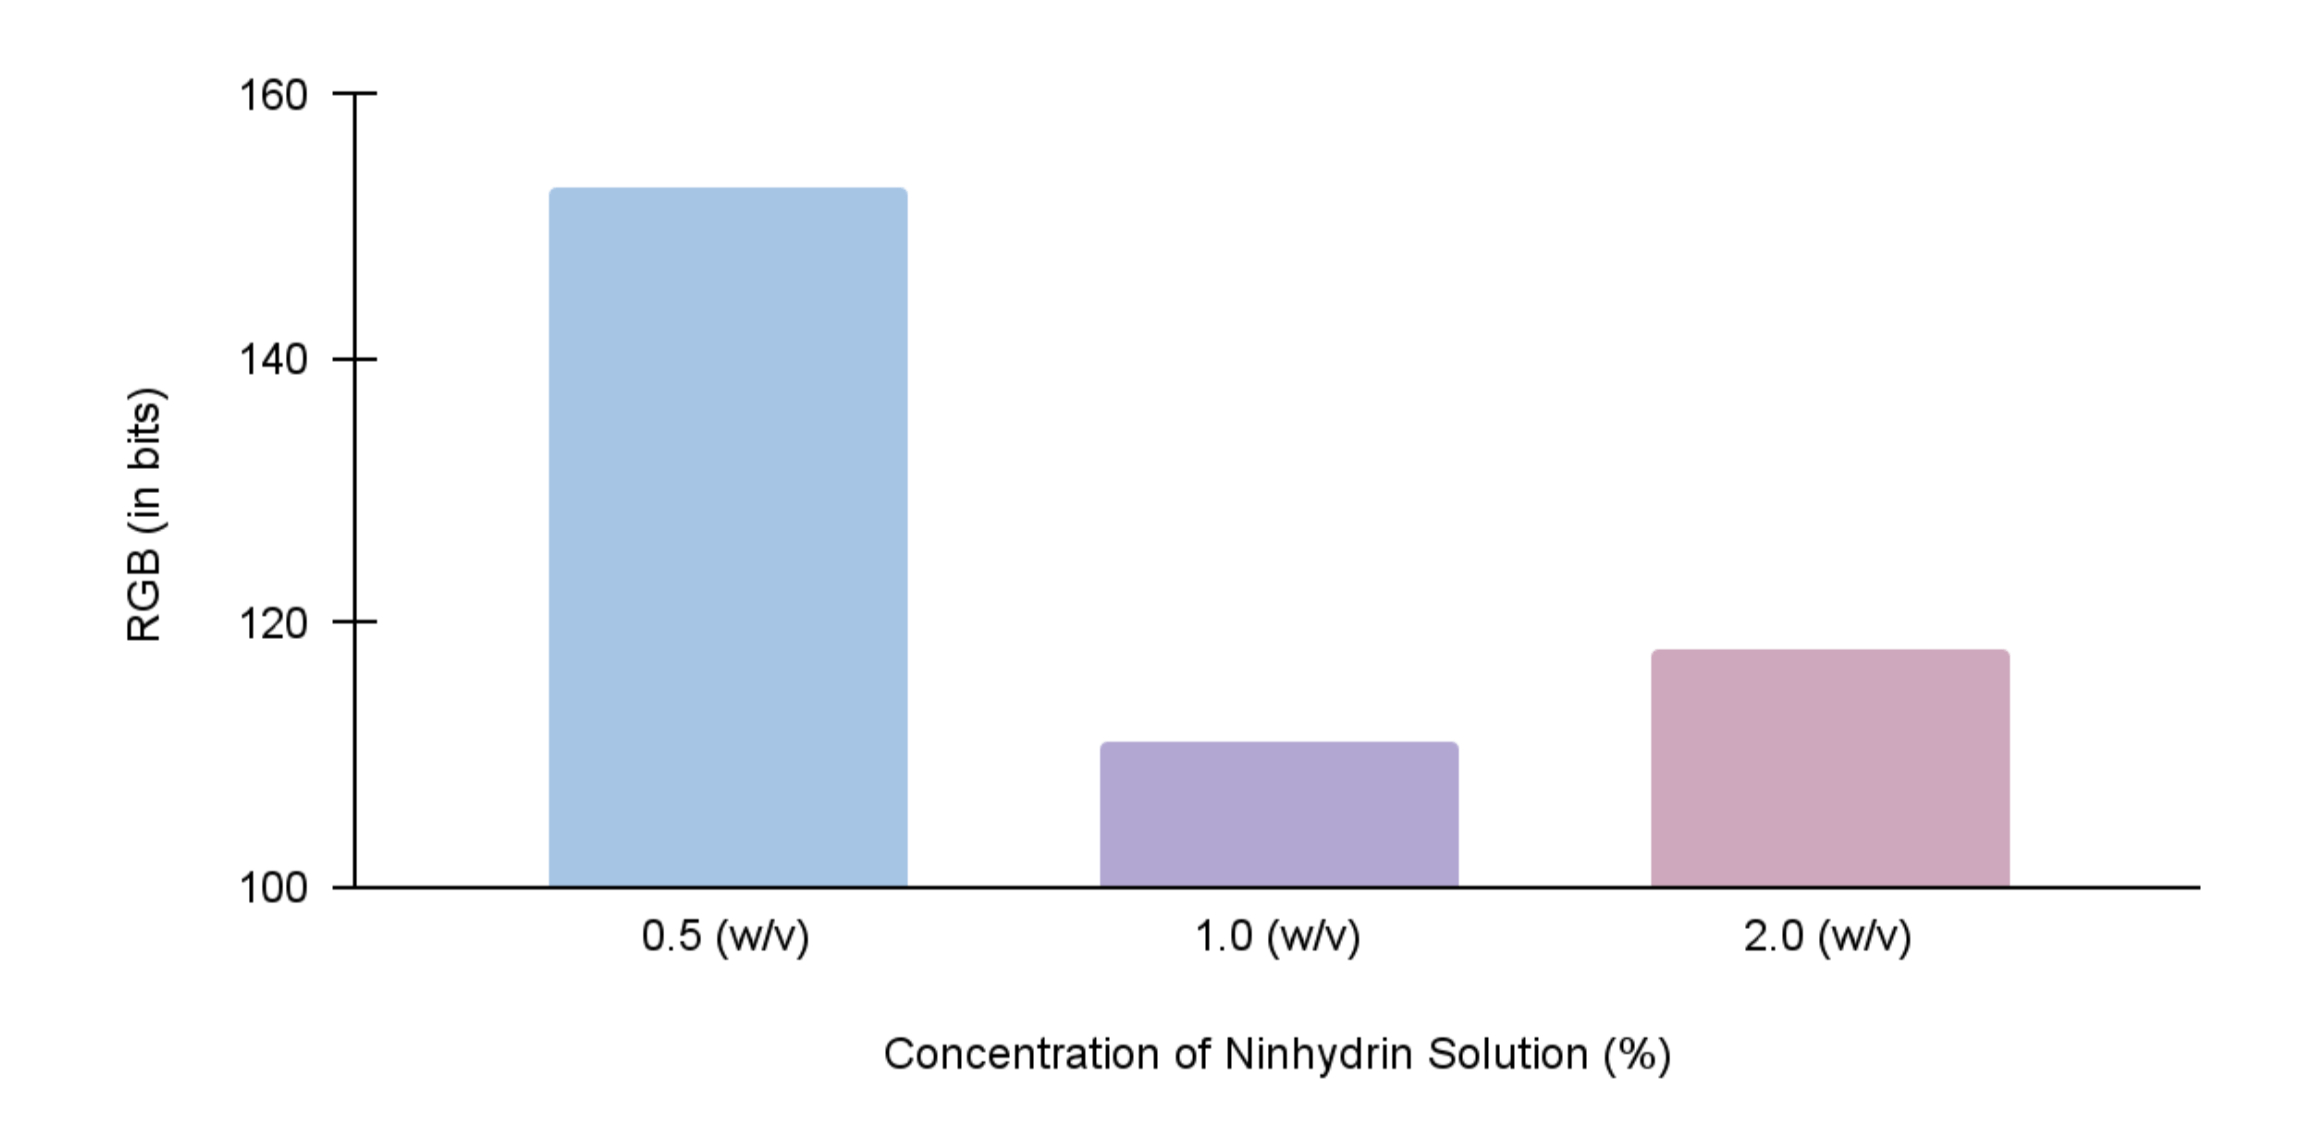
The RGB values for different concentrations, which are 0.5%, 1.0%, and 2.0%, with the additional 5 percent standard deviation, show the data of 153 (SD 7.65), 111 (SD 5.55), 118 (SD 5.9). Table 1 and Figure 3 depict these results.
| Concentration of Ninhydrin Solution %(w/v) | Votes (per person) |
| 0.5% | 0 |
| 1.0% | 19 |
| 2.0% | 16 |
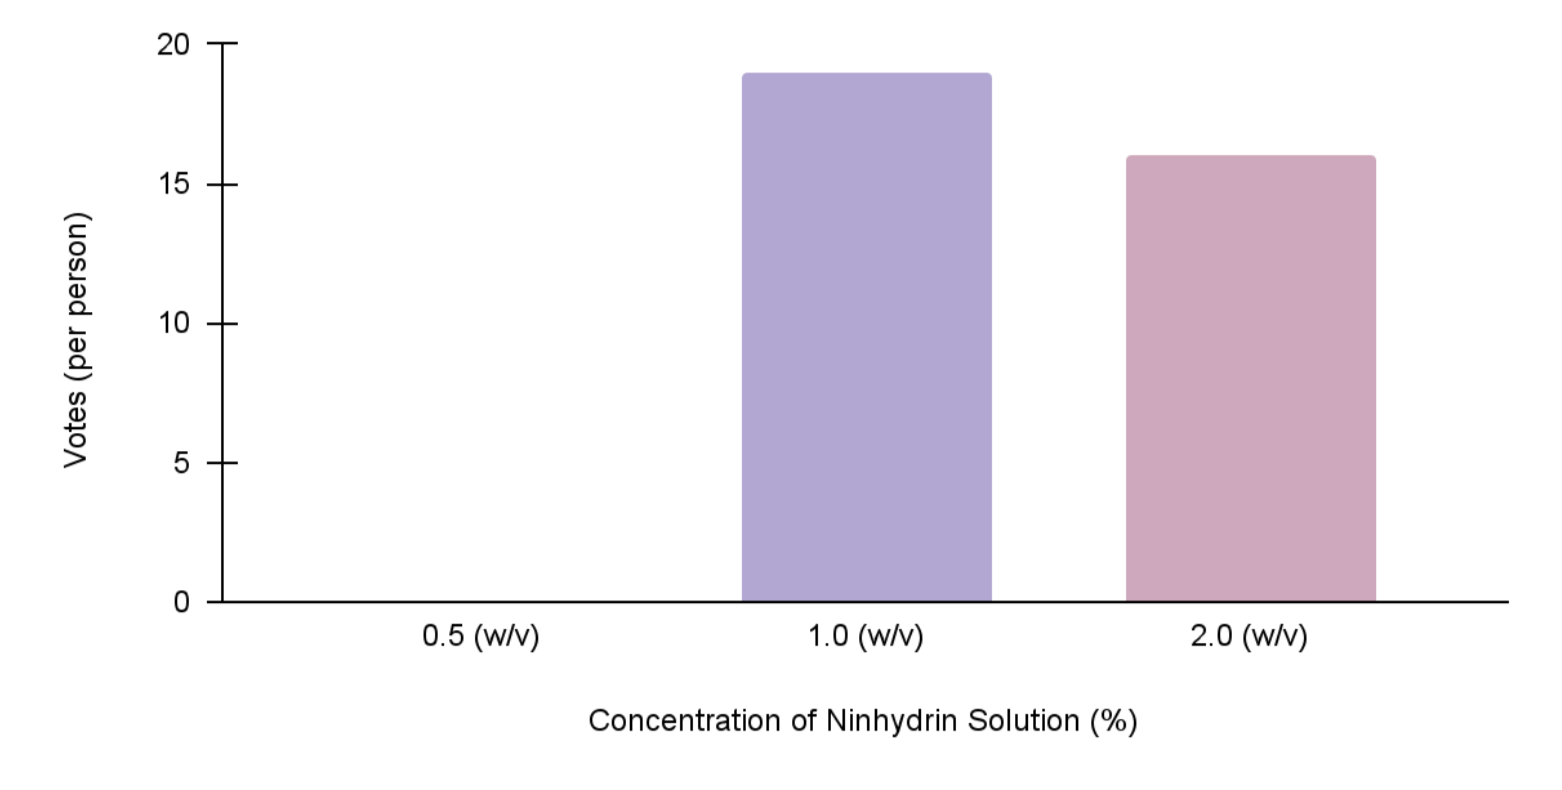
The survey for fingerprint images after 20 minutes demonstrates that most participants believed that the 1.0% concentration creates the clearest image among all three, which received 19 votes (Table 2 and Figure 4). The 2.0% concentration is very close, which gets 16 votes. On the other hand, the 0.5% concentration trial got no votes. The 0.5% percent was picked in 0% of evaluators; 1% concentration was picked in 54.29% of evaluators; 2% concentration was picked in 45.72% of evaluators. The person’s chi-square value is calculated to be 46.23, with 2 degrees of freedom, and a p-value smaller than 0.001.
| Concentration of Ninhydrin Solution | Votes (per person) |
| 0.5% | 0 |
| 1.0% | 28 |
| 2.0% | 7 |
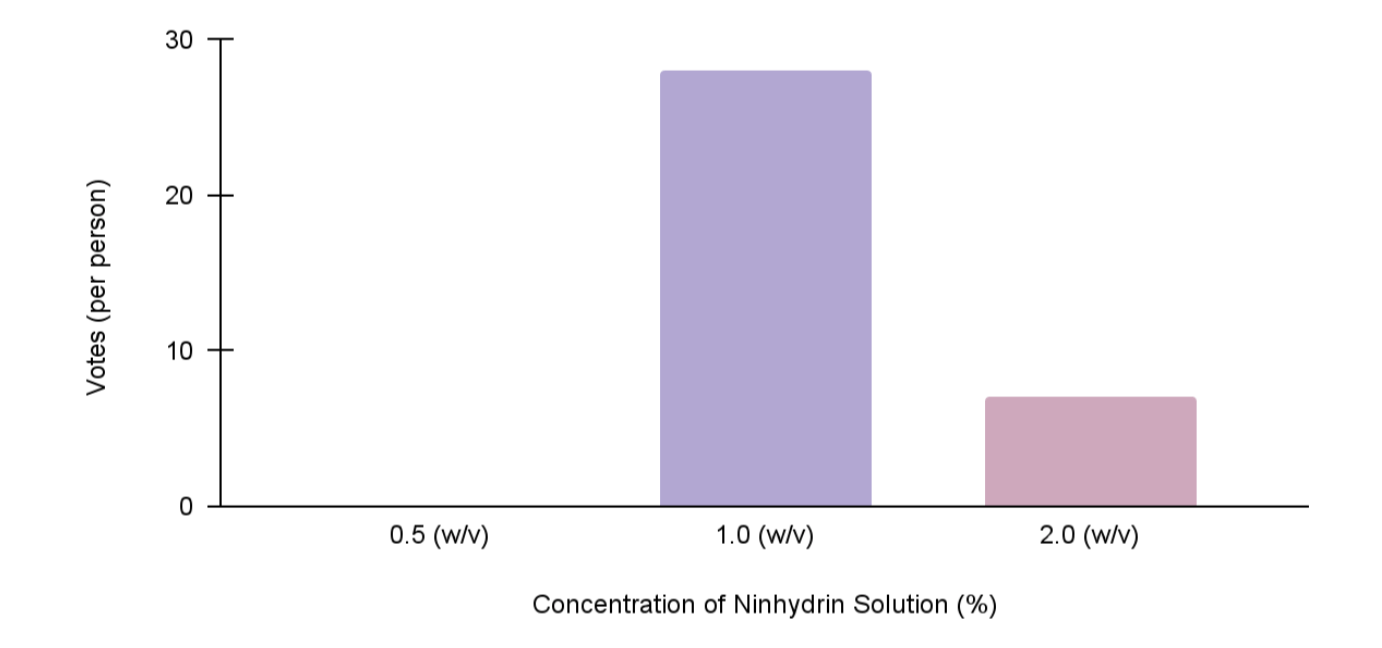
From the survey after 10 hours and 20 minutes, the fingerprint created from the 1.0% concentration trial also gets the most votes at a count of 28 (Table 3 and Figure 5). It received 80 percent of the votes from evaluators. The 2.0% concentration fingerprints images received 7 votes, which placed it second for receiving 20 percent of the votes from evaluators. The 0.5% also received 0 percent of the votes. The chi- square value calculated is 46.23, with a degree of freedom of 2 and a p-value smaller than 0.001. When comparing the results of the survey after 20 minutes and 10 hours and 20 minutes, the p-value is 0.99.
Discussion
The purple color shown in the data set is also called Ruhemann’s purple. This process begins when the amino acid is converted into an aldehyde, while simultaneously releasing carbon dioxide and ammonia. The product, diketohydrin, is formed when the ammonia reacts with another molecule of ninhydrin, which is where the dark purple color first appears5.
The results of this study indicate that the hypothesis for the experiment was rejected based on qualitative analysis, RGB values, and survey results. The data here shows that the intensity level decreased in the order of 1.0% > 2.0% > 0.5% when testing them individually, whereas it was hypothesized that it would follow the order of 2.0% > 1.0% > 0.5%. The. By looking at the data, it is evident that 2.0% ninhydrin solution does not have a greater intensity or clearness but has a slightly lower intensity and clearness instead. From the clarity analysis of the images, the best concentration that can be used to observe the clarity of the fingerprints is 1.0%, followed by 2.0% and 0.5%.
The 1.0% concentration solution creates the lowest RGB values, which means it creates a darker color of Ruhemann’s purple, as the lower the RGB values, the darker the color. The darker the color, the easier it is to observe the fingerprint pattern, as higher contrast is preferred;16, therefore, the fingerprint will be clearer for the 1.0% trial image. This data matches the qualitative analysis, as it can also be concluded that the 1.0% concentration creates the clearest image. The 0.5% concentration image has the highest RGB bits among all three, showing that the color is the lightest; therefore, it is harder to see the pattern of the fingerprints. The 2.0% concentration solution creates an RGB value smaller than 0.5% but higher than 1.0%, showing it is clearer than the 0.5% trial but contains a lighter color than the 1.0%. As the standard deviation for 1.0% and 2.0% concentration overlaps, the data for both should be considered equal without seeing either one as superior in clarity.
As it is difficult to observe the clarity with bare eyes, 35 people were surveyed for both sets of pictures, from 20 minutes and 10 hours and 20 minutes. The results indicate that after fully reacting, the 1.0% concentration of the ninhydrin solution creates the clearest image compared to the 2.0% and 0.5% concentration trials. The 0.5% trial got 0 votes, as the RGB value is the highest and hardest to observe. To conclude, after surveying 35 participants, the best concentration is the 1.0%, as it is better to observe the values. The ninhydrin solution with 1.0% concentration creates the clearest image, followed by 2.0% and 0.5% concentration, which was especially evident after 10hr 20 minutes. However, since the votes after 20 minutes do not have significant differences, it is not an absolute that 1% concentration is greater than 2%, but rather have a similar impact on the same paper surfaces. The 0.5% concentration trial got no vote, indicating this one is the least clear of all three images. Originally, the clarity of the 1.0% and 2.0% trials was very close, with only 3 votes apart. After 10 more hours, the pattern in the 1.0% concentration trial image is clearer than in the 2.0% trials, making them 21 votes apart. This indicates that the clarity increased significantly after hours of full reaction. Based on the chi-square analysis, the results from both time points are statistically significant. The trial on 20 minutes has a chi-square value greater than the critical value, demonstrating that the distribution of answers was significantly different, rather than just by chance. Similarly, the chi-square value for images after 10 hours and 20 minutes had a chi-square value greater than the critical value, proving the significance of the data. When comparing the data between the results of the survey after 20 minutes and after 10 hours and 20 minutes, the value shows no statistical difference. This indicates that the trend is consistent over time, and there is no significant difference in the effect of ninhydrin concentration over an extended period of time.
As the experiment only addresses fingerprints on paper, the result does not apply to all materials. The conclusions may not apply to other surfaces like cardboard, glass, or metal. Future studies could expand on this by testing a wider range of materials to better reflect actual forensic scenarios.
Since ninhydrin is the primary reactant responsible for developing fingerprints, variations in the amount applied can significantly impact the intensity of the results. Although the ninhydrin solution was consistently sprayed 5 times per trial, differences in spray pressure or angle may have led to inaccuracy in the clarity and color intensity. Moreover, as only 35 participants were surveyed, the limited sample size may have introduced bias or reduced the reliability of the results. The exposure of the taken photos of the fingerprints is also one of the limitations presented in this study. Even though all app settings were constant, the distance between the phone, paper, and the light is a factor that could cause inaccuracy when using the Enhanced Pixel Examination to test the RGB value and during the observation stage. Given that the experiment was conducted in a low-resource setting, multiple trials were difficult to achieve. Since the composition of every person’s amino acid on their fingerprint is different, the amount of Ruhenmann’s purples shown might also be different17. Using a single participant limits the generalization of the findings due to lack of variability of amino acid compositions18. People have different metabolisms, diets, and physiological states that can affect the amino acid residue on their fingerprints. Males and females also have different amino acid content17. A larger sample size is necessary to determine whether these observation results are consistent and reliable across larger populations. A single participant restricts the ability to generalize the result of this study and may also affect the magnitude of the observed outcome. Although the different composition of amino acids of each individual is only slightly different, this small difference could have caused a difference in the intensity of the ninhydrin reaction. This means that the result from this study may not show the full range of results that can be seen in a larger pool of test groups and introduces a bias affecting the generalization of the result19. Future studies could reduce these uncertainties by increasing the number of trials, testing multiple participants’ fingerprints, and standardizing environmental conditions more strictly.
The result of this study provides a better understanding of the chemical implications in forensic chemistry, specifically, how varying ninhydrin solution concentrations affect fingerprint visualization. The results identify the concentration that produces the clearest fingerprints, which can help optimize real-world forensic protocols. The conclusion also matched the real-world detection of fingerprints. During a detection in forensic scenes, the concentration of the ninhydrin used in the field is usually 0.5% to 2.0%, which is between 0.5% (w/v) and 2.0% (w/v) used in this experiment.
Since this study only focuses on the paper surface in the low-resource settings, more studies on different surfaces can be influential to the field in areas where materials are hard to get. There should also be different chemicals of fingerprint detection being tested on which chemical is the best option in limited settings. Some other methods of application can also be investigated in the future. Some use ninhydrin in powder form, which might have a different effect and reaction rate from liquid-based when applying to papers20.
Conclusion
The survey result and the observation showed that the 1.0% and 2.0%’s data are very close after 20 minutes and could not decide the best fit, making 0.5% suboptional for paper surfaces. After 10 hours and 20 minutes, however, the clarity of 1.0% had been proven to increase significantly and stand out from other concentrations. Utilizing ninhydrin in ethanol in low-resource settings is a valid approach.
References
- Jonnalagadda, Varsha Sri, et al. “A Study on Advancements in Forensic Fingerprints.” Current Forensic Science, vol. 3, no. 1, Jan. 2025, p. E26664844338150. www.benthamdirect.com, https://doi.org/10.2174/0126664844338150241202060301. [↩]
- Gomes, Francisco M., et al. “Study of Latent Fingerprints – A Review.” Forensic Chemistry, vol. 35, Sept. 2023, p. 100525. ScienceDirect, https://doi.org/10.1016/j.forc.2023.100525. [↩] [↩]
- Yousif, Eamd, et al. “The Discovery of Forensics Chemistry Latent Fingerprints: An Article Review.” Indonesian Journal of Chemical Education, vol. 1, no. 1, July 2024, pp. 7–13. jurnal.uny.ac.id, https://doi.org/10.21831/ijce.v1i1.72678. [↩]
- Crown, David. “The Development of Latent Fingerprints with Ninhydrin.” Journal of Criminal Law and Criminology, vol. 60, no. 2, Jan. 1969, p. 258, https://scholarlycommons.law.northwestern.edu/jclc/vol60/iss2/17. [↩] [↩] [↩]
- Almog, J. “FINGERPRINTS (DACTYLOSCOPY) | Visualization.” Encyclopedia of Forensic Sciences, Elsevier, 2000, pp. 890–900. DOI.org (Crossref), https://doi.org/10.1006/rwfs.2000.0518. [↩] [↩]
- Lange, Erin, and Felicity Carlysle-Davies. “Presumptive Drug Identification by Ninhydrin Fingerprint Analysis.” Forensic Chemistry, vol. 40, Sept. 2024, p. 100597. DOI.org (Crossref), https://doi.org/10.1016/j.forc.2024.100597. [↩] [↩] [↩]
- Jasuja, Om Prakash, et al. “Dynamics of Latent Fingerprints: The Effect of Physical Factors on Quality of Ninhydrin Developed Prints — A Preliminary Study.” Science & Justice, vol. 49, no. 1, Mar. 2009, pp. 8–11. ScienceDirect, https://doi.org/10.1016/j.scijus.2008.08.001. [↩] [↩] [↩]
- Stauß, Amelie Charlotte et al. “The Ninhydrin Reaction Revisited: Optimisation and Application for Quantification of Free Amino Acids.” Molecules (Basel, Switzerland) vol. 29,14 3262. 10 Jul. 2024, doi:10.3390/molecules29143262 [↩] [↩] [↩]
- Wang, Meng, et al. “Fluorescent Nanomaterials for the Development of Latent Fingerprints in Forensic Sciences.” Advanced Functional Materials, vol. 27, no. 14, Apr. 2017, p. 1606243. PubMed Central, https://doi.org/10.1002/adfm.201606243. [↩] [↩]
- van Zyl, Chanel, et al. “Unravelling ‘Low-Resource Settings’: A Systematic Scoping Review with Qualitative Content Analysis.” BMJ Global Health, vol. 6, no. 6, June 2021, p. e005190. PubMed Central, https://doi.org/10.1136/bmjgh-2021-005190. [↩]
- Vestad, Maja. “The Persistent Attractions of Low-Tech: Challenging the Efficiency Paradigm of Forensic Technology.” International Journal of Police Science & Management, vol. 26, no. 2, June 2024, pp. 292–301. DOI.org (Crossref), https://doi.org/10.1177/14613557241231164. [↩]
- Wu, Andrew G., et al. “Enhancing Healthcare Equity by Using Open-Source Pediatric Medical Devices in Low Resource Settings: An Exploratory International Survey of Pediatric Clinicians.” PLOS One, vol. 20, no. 10, Oct. 2025, p. e0334108. PubMed Central, https://doi.org/10.1371/journal.pone.0334108. [↩]
- Magro, Louise, et al. “Chemical Enhancement of Fingerprints on Various Porous and Non-Porous Surfaces.” Indian Journal of Forensic Medicine & Toxicology, vol. 9, no. 1, 2015, p. 225. DOI.org (Crossref), https://doi.org/10.5958/0973-9130.2015.00054.7. [↩]
- Fieldhouse, Sarah J. “An Investigation into the Effects of Force Applied during Deposition on Latent Fingermarks and Inked Fingerprints Using a Variable Force Fingerprint Sampler.” Journal of Forensic Sciences, vol. 60, no. 2, Mar. 2015, pp. 422–27. PubMed, https://doi.org/10.1111/1556-4029.12661. [↩]
- Kamble, Dinesh, et al. “Effect of Temperature on Development of Latent Fingerprints by Ninhydrin Method.” Research Gate, Oct. 2020. [↩]
- Bumbrah, Gurvinder Singh, et al. “Emerging Latent Fingerprint Technologies: A Review.” Research and Reports in Forensic Medical Science, vol. 6, Aug. 2016, pp. 39–50. www.dovepress.com, https://doi.org/10.2147/RRFMS.S94192. [↩]
- Brunelle, Erica, et al. “New Horizons for Ninhydrin: Colorimetric Determination of Gender from Fingerprints.” Analytical Chemistry, vol. 88, no. 4, Feb. 2016, pp. 2413–20. PubMed, https://doi.org/10.1021/acs.analchem.5b04473. [↩] [↩]
- van Helmond, Ward, et al. “Chemical Profiling of Fingerprints Using Mass Spectrometry.” Forensic Chemistry, vol. 16, Dec. 2019, p. 100183. ScienceDirect, https://doi.org/10.1016/j.forc.2019.100183. [↩]
- Croxton, Ruth S., et al. “Variation in Amino Acid and Lipid Composition of Latent Fingerprints.” Forensic Science International, vol. 199, no. 1, June 2010, pp. 93–102. ScienceDirect, https://doi.org/10.1016/j.forsciint.2010.03.019. [↩]
- Yu, Yung‐Chien, et al. “Solvent‐free Method for Developing Latent Fingerprints by Applying Superfine Ninhydrin Powder.” Journal of Forensic Sciences, vol. 70, no. 6, Nov. 2025, pp. 2492–501. DOI.org (Crossref), https://doi.org/10.1111/1556-4029.70141. [↩]

 and Family-Integrated Care (FIC): Global Trends and Local Provider Awareness in Fresno County, California")
