
Abstract
Accurate prediction of near-term flares may help guide treatment decisions in systemic lupus erythematosus (SLE). However, recent FLAME models achieved only moderate predictive performance using clinical and social variables. The ability of gene-expression data alone to predict flares remains unclear. In this exploratory study, whole-blood gene-expression data were evaluated to predict flares within 90 days in pediatric patients with SLE. Data from GSE65391, consisting of longitudinal pediatric SLE samples, were analyzed. A machine learning pipeline incorporating logistic regression and XGBoost was developed, along with baseline comparators, including a prevalence baseline and a SLEDAI-only model. Flares were defined as a ≥4-point increase in the Systemic Lupus Erythematosus Disease Activity Index 2000 (SLEDAI-2K). Subject-level grouped nested cross-validation was used, with all model selection performed within training folds to prevent data leakage. Precision-recall area under the curve (PR-AUC) was the primary evaluation metric. XGBoost slightly outperformed logistic regression (PR-AUC 0.25 vs. 0.21; prevalence = 0.17), although overall performance remained modest. The SLEDAI-only model showed similar performance to XGBoost. Permutation testing produced near-random performance, with PR-AUC values overlapping observed results, indicating that the predictive signal was weak and not consistently distinguishable from random variation. Overall, these findings suggest that gene-expression data alone may be insufficient for predicting near-term flares in pediatric SLE and may not provide meaningful predictive value beyond existing clinical measures. This limitation may reflect class imbalance and biological heterogeneity of SLE. Future work will likely require larger datasets, patient stratification, and integration of multiple data modalities to improve predictive performance.
Keywords: pediatric systemic lupus erythematosus, SLE, gene expression, flare prediction, machine learning, logistic regression, XGBoost
Introduction
Systemic lupus erythematosus (SLE) is a chronic autoimmune disease characterized by autoantibody production and immune complex formation, leading to inflammation and damage across multiple organs1. In the United States, more than 200,000 individuals are affected by SLE2, and approximately 10% of individuals with SLE are diagnosed during childhood3. Disease activity in SLE is commonly measured using standardized clinical indices such as the Systemic Lupus Erythematosus Disease Activity Index 2000 (SLEDAI-2K), a validated measure of disease activity4. Flare definitions have varied across clinical studies, and no universally accepted definition exists5. In prior studies, including the present one, flare has been operationally defined as an increase of 4 or more points in SLEDAI-2K6.
Flares contribute to subsequent organ damage accrual in SLE7. In one recent cohort study, organ damage most commonly involved the neuropsychiatric system, followed by the renal system8. This is particularly relevant in pediatric SLE, where disease onset in childhood has been associated with greater disease severity compared with adult-onset disease9. In a retrospective cohort of childhood-onset systemic lupus erythematosus, 29.9% of patients developed irreversible organ damage over a median follow-up of 4.7 years10. Therefore, preventing flares is an important goal of treatment. However, even among patients who achieve a low disease activity state, flares occurred during follow-up, demonstrating that flares may still occur despite disease control11.
Prior studies have identified both clinical and serologic factors associated with flare. Severe flare has been linked to younger age, higher baseline disease activity, and prior lupus nephritis12. Flare has also been associated with anti–double-stranded DNA (anti-dsDNA) positivity and low complement levels13,14. Although these factors may help identify patients at higher overall risk, they may not be sufficient to determine whether an individual patient is in an immediate pre-flare state.
Accurate prediction of near-term flares may inform clinical decision-making, including whether to escalate, taper, or maintain therapy. Corticosteroids are commonly used in SLE; however, prolonged oral use is associated with increased clinical burden, including higher rates of adverse events15. In pediatric patients, glucocorticoid toxicity can adversely affect blood pressure, body mass index (BMI), sleep, and growth16, and greater exposure has been associated with organ damage accrual in childhood-onset SLE17. Treatment response is also variable; for example, in a randomized trial in pediatric SLE, belimumab, an FDA-approved therapy for pediatric SLE, demonstrated only modest improvement in response rates compared with placebo (52.8% vs. 43.6%)18. Therefore, improved prediction of near-term flare risk could support more personalized treatment strategies.
Building on this need, a recent FLAME study developed two models for predicting flares within 90 days: a clinical-only model and a model combining clinical and social variables. These models achieved receiver operating characteristic–area under the curve (ROC-AUC) values of 0.67 and 0.66, respectively19. ROC-AUC measures a model’s ability to discriminate between classes across all possible classification thresholds. These results indicate moderate discriminative performance, highlighting the need for improved predictive accuracy.
Gene-expression studies have advanced understanding of the underlying biological mechanisms of systemic lupus erythematosus (SLE). Distinct transcriptomic patterns have been associated with different disease states, including flare and remission20, supporting a molecular basis for differences in disease activity. In addition, SLE is biologically heterogeneous, with identifiable molecular subtypes and endotypes21,22. Single-cell RNA sequencing studies have further characterized these molecular subtypes by revealing cell type–specific transcriptional changes in SLE23. These subtypes have been shown to exhibit distinct gene-expression profiles across patients, reflecting variability in underlying disease mechanisms21,22. Consistent with this heterogeneity, recent clustering analyses have also identified distinct clinical phenotypes of severe flares in SLE, further highlighting the variability in disease manifestations across patients24. Notably, an exploratory longitudinal study identified differential gene-expression patterns associated with lupus flare, suggesting that molecular changes may precede clinical exacerbation25. Building on prior findings that gene-expression patterns are associated with disease states in SLE, the present study evaluated whether these molecular signals could also be used to predict near-term flares in pediatric SLE and compared performance with a prevalence baseline, a SLEDAI-only model, and two models from the FLAME study.
Methods
Software and Computational Environment
All analyses were performed in a Google Colab environment using Python 3.12.13. The following package versions were used: NumPy 2.0.2, pandas 2.2.2, matplotlib 3.9.2, scikit-learn 1.5.2, XGBoost 2.1.1, SHAP 0.46.0, and Optuna 4.0.0. Additional dependencies included requests 2.32.4, pyarrow 17.0.0, and openpyxl 3.1.5. GEO data processing was performed using GEOparse 2.0.4. To ensure reproducibility, all experiments were conducted with a fixed random seed (42), and model training was performed using deterministic configurations where applicable.
Code Availability
All code used to generate the results of this study, including supplementary materials, is publicly available at: https://github.com/aaronc09/pediatric-lupus-flare-prediction-gene-expression-ml
Model Development and Comparator Models
Two machine learning models were evaluated: logistic regression with L2 regularization and XGBoost. These models were selected to capture both linear and non-linear patterns in the data and to align with prior work using a 90-day prediction window, such as in the FLAME study. In addition to the gene-expression models, two comparator models were included: a prevalence-based classifier and a SLEDAI-only model. The prevalence-based classifier makes predictions based only on the overall frequency of flares in the dataset and serves as a minimal baseline for comparison. The SLEDAI-only model uses logistic regression with current disease activity (SLEDAI score) as the sole predictor. This approach was chosen because SLEDAI is a widely used clinical measure of disease activity and provides a simple and interpretable reference model. Since only a single clinical variable was used, more complex non-linear models were not expected to provide additional benefit. Together, these comparators allow assessment of whether gene-expression–based models offer predictive value beyond both a naive baseline and a commonly used clinical measure.
Data Source and Preprocessing
Gene-expression and clinical metadata were obtained from the publicly available GSE65391 dataset from the Gene Expression Omnibus (GEO). The dataset contains whole-blood microarray profiles generated using the Illumina HumanHT-12 platform (GPL10558) and includes longitudinal samples from pediatric lupus patients. Preprocessed expression data were downloaded and parsed using the GEOparse Python package. Expression values were extracted from SOFT-formatted files and merged with corresponding clinical metadata using unique sample identifiers. Information from the sample metadata fields (e.g., disease status, clinical variables) was extracted and organized into structured variables, including disease status, SLEDAI scores, and time-related clinical variables. Only samples from subjects labeled as SLE were included in the analysis, and healthy control samples were excluded before model training. Longitudinal visit data were organized by patient using reported time since diagnosis. For each patient, visits were ordered chronologically and paired such that each visit was linked to the subsequent visit within the same individual. Only visit pairs with an interval of 90 days or less were retained. A binary outcome label was assigned to each visit. A visit was labeled as pre-flare if the subsequent visit within 90 days showed an increase in SLEDAI score of at least 4 points. All remaining visits were labeled as non-pre-flare.
After preprocessing, the dataset included approximately 440 samples from 104 unique patients, with a pre-flare prevalence of approximately 17%. The average number of days between visits was 52.2 days, with a range of 7 to 90 days and a median of 54 days.
Gene-expression values were used as provided in the GEO series matrix files, which had been preprocessed and normalized by the original study authors. No additional normalization was applied. Probe-level measurements were used without collapsing to gene-level values. Probe annotations were mapped to gene symbols using the Illumina GPL10558 annotation file. Missing data were minimal and were handled by excluding incomplete samples during preprocessing. Batch-effect correction was not performed because consistent batch variables were not available.
Machine Learning Pipeline
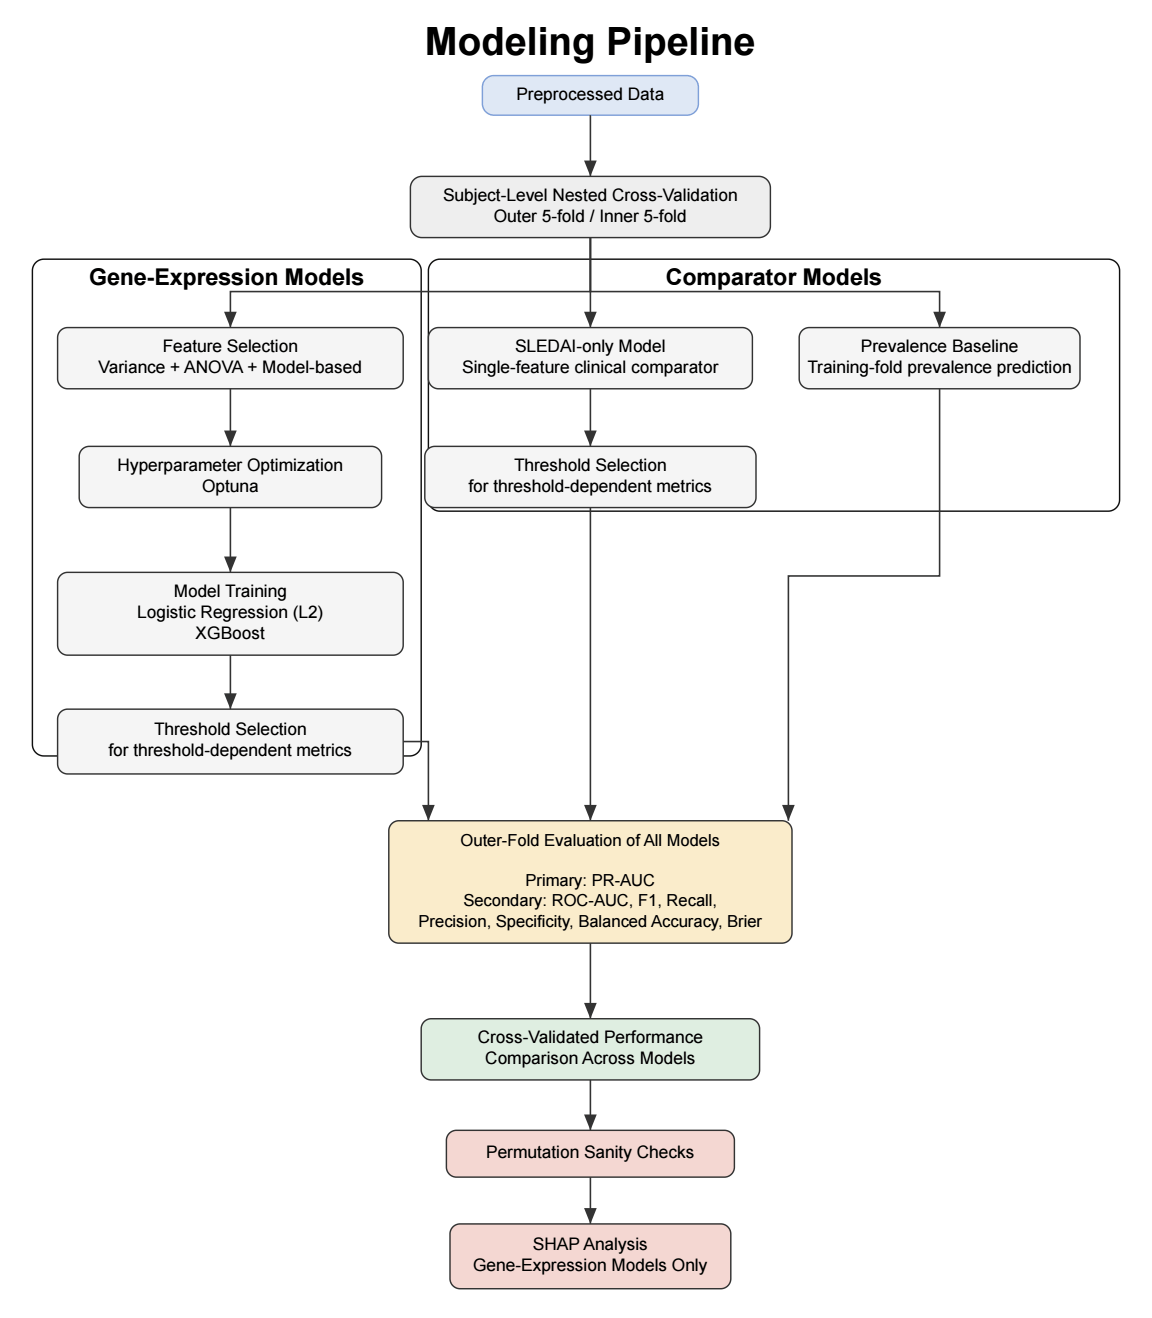
To ensure robust evaluation and prevent data leakage, subject-level grouped nested cross-validation was performed. The dataset was partitioned into five outer folds. Each fold was used once as the outer test set (20%), with the remaining folds forming the corresponding outer training set (80%), resulting in five distinct train–test splits. Stratified group splitting was used to preserve class balance while ensuring that samples from the same subject did not appear in both sets. Within each outer training set, five-fold inner cross-validation was performed for feature selection, hyperparameter optimization, and threshold selection. All preprocessing steps were conducted exclusively within the inner training folds to prevent data leakage. After inner cross-validation, optimal hyperparameters and classification thresholds were selected, and final models were trained on the full outer training set before being evaluated on the held-out outer test set. This framework also enabled comparison of the gene-expression models with both a prevalence-based baseline and a clinical comparator based on current disease activity (SLEDAI) alone.
Feature Selection
Given the high dimensionality of the dataset (43,799 gene-expression probes per sample), feature selection was performed to reduce dimensionality and mitigate overfitting. All feature selection steps were conducted exclusively within training folds to prevent data leakage. A three-step pipeline was applied. First, features with near-zero variance (<10⁻⁵) were removed, as they show little variation across samples and are unlikely to be informative for prediction. Second, the top k = 300 probes were selected using ANOVA F-statistics. The value of k was chosen empirically from a tested range of 200 to 1000 to balance signal retention and noise reduction while maximizing precision-recall area under the curve (PR-AUC). Third, model-based feature selection was performed using L1 regularization for logistic regression and feature importance–based selection for XGBoost. The number of features retained after sequential variance filtering, ANOVA-based selection, and model-based selection varied across cross-validation folds. On average, logistic regression retained 13.6 ± 8.1 features, whereas XGBoost retained 36.0 ± 18.2 features.
Hyperparameter Optimization
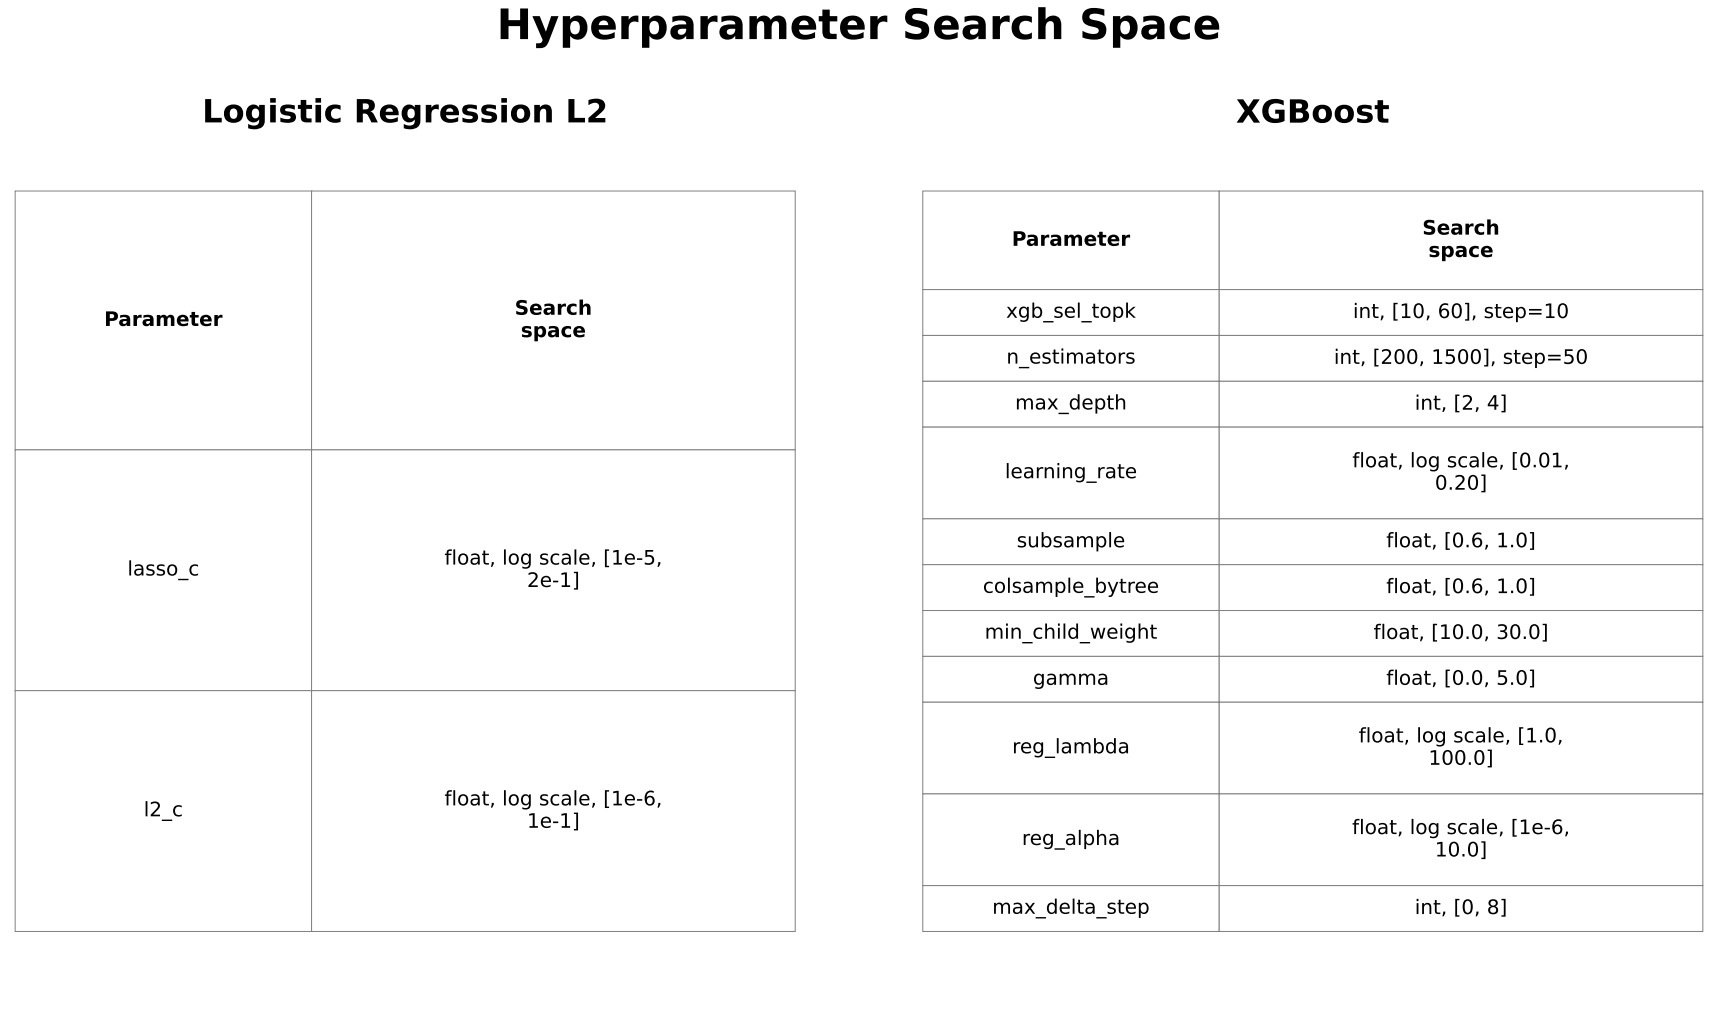
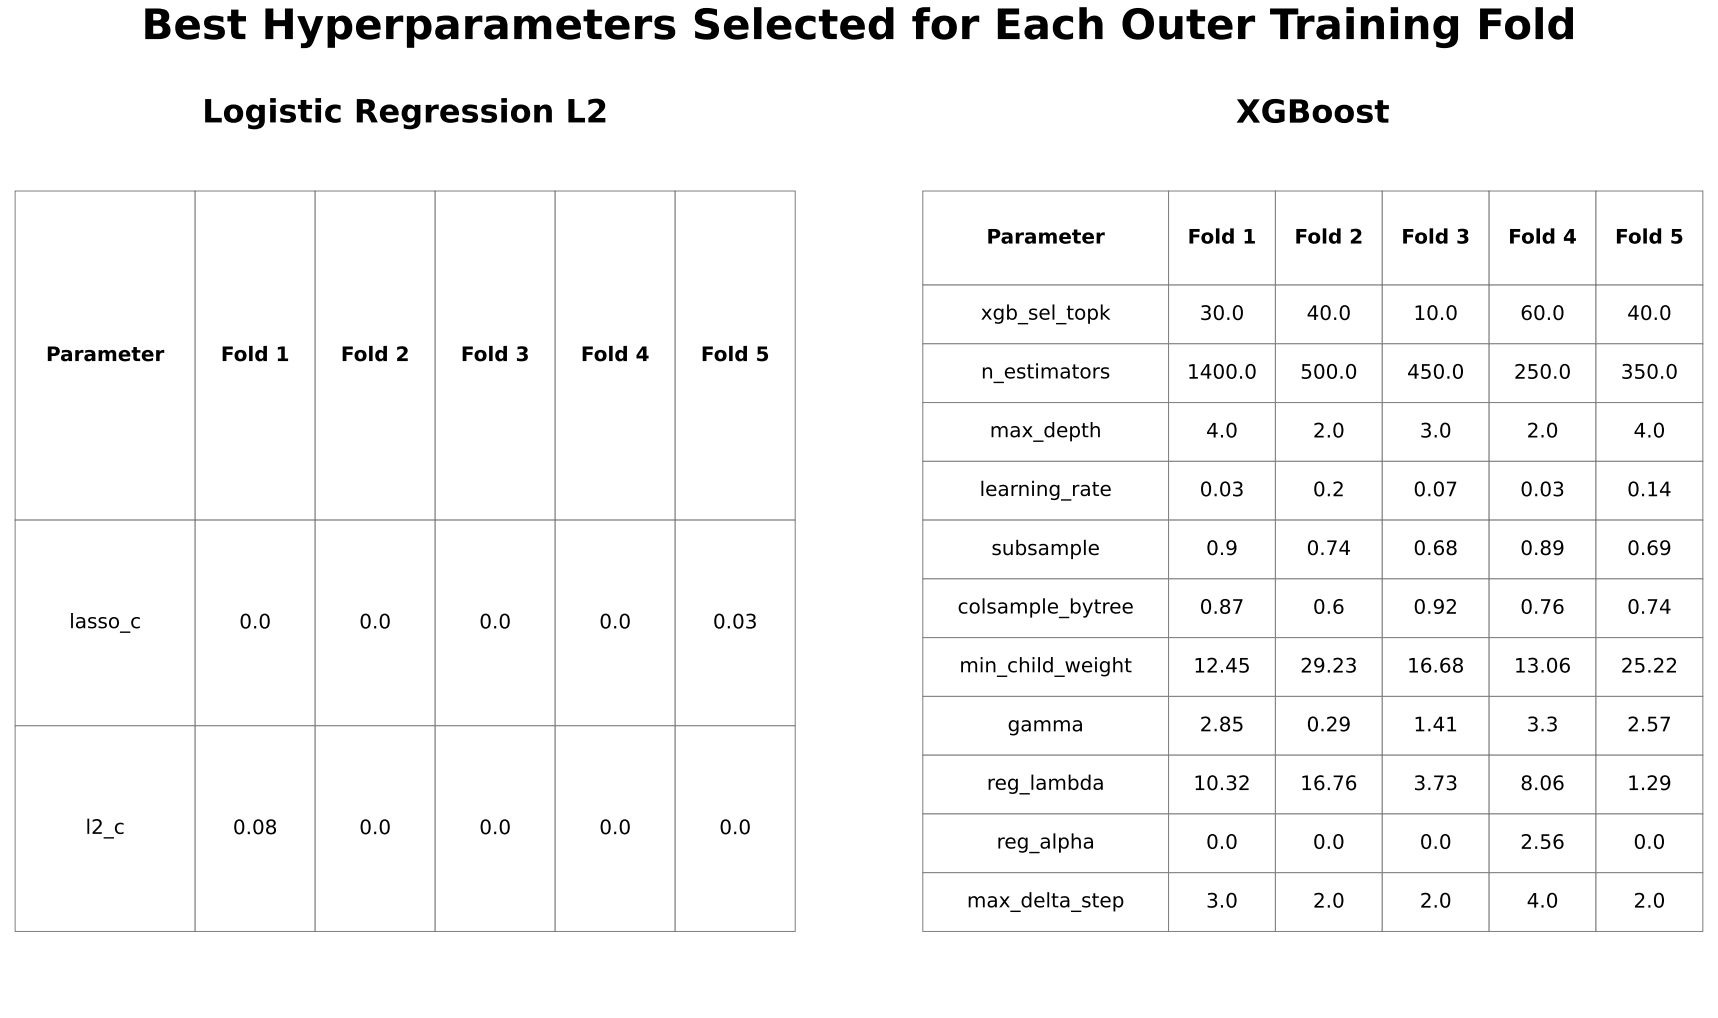
Hyperparameters were optimized using Optuna to maximize PR-AUC based on inner cross-validation predictions. Optuna is an automated tool that enables efficient and systematic exploration of hyperparameter values, reducing the need for manual tuning. Search spaces were iteratively refined to ensure adequate coverage while avoiding consistent selection of boundary values. Maximum tree depth for XGBoost was constrained to 2 to 4 to reduce overfitting in high-dimensional data.
Scaling
Feature scaling by standardization was applied for logistic regression but not for XGBoost, as tree-based models are generally invariant to feature scaling.
Threshold Selection
Classification thresholds were determined from inner-fold predictions to maximize the F1 score for secondary classification metrics, while PR-AUC was evaluated independently of threshold selection.
Model Evaluation
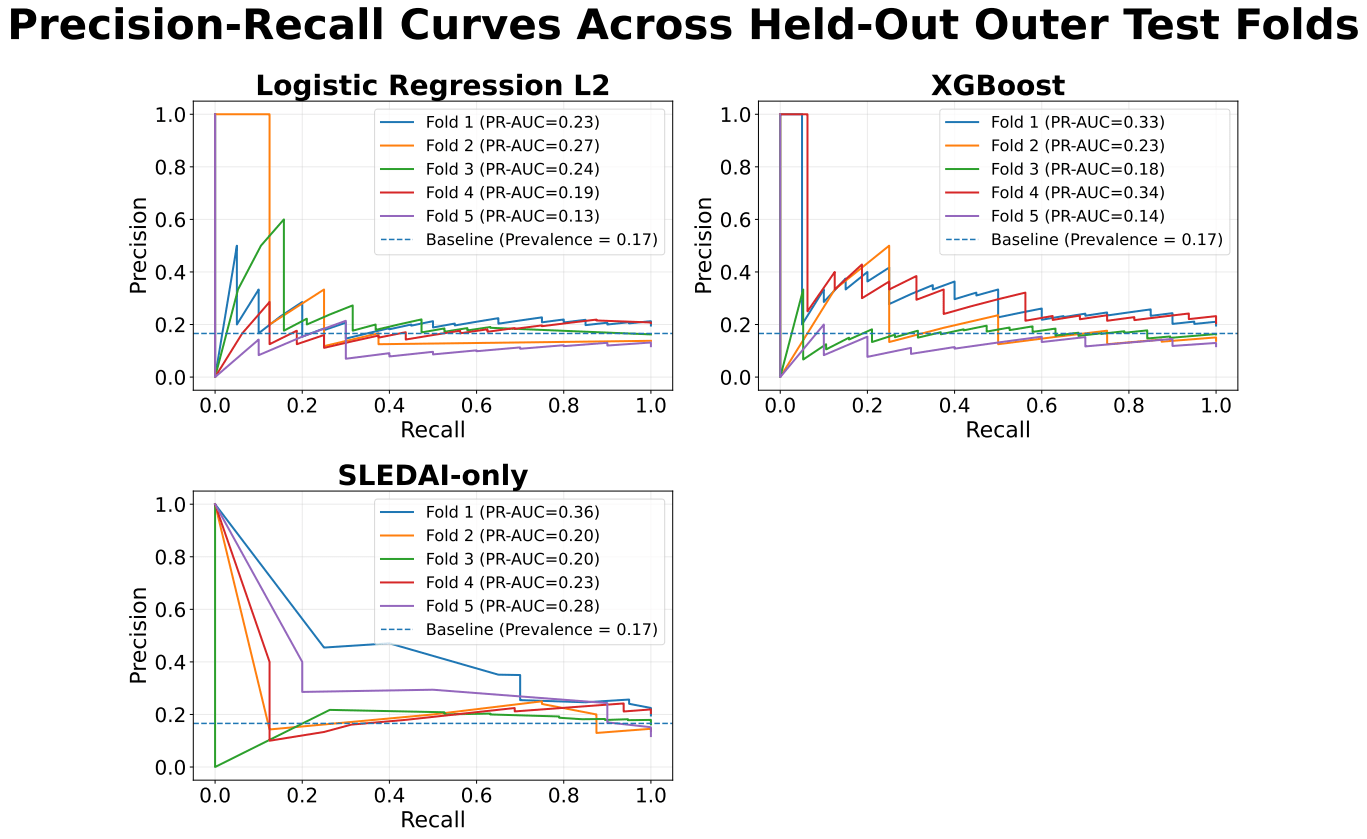
Precision-recall area under the curve (PR-AUC) was selected as the primary evaluation metric because it evaluates model performance across all classification thresholds, emphasizes performance on the positive (pre-flare) class, and captures the trade-off between precision and recall. In settings with class imbalance or low prevalence, PR-AUC provides a more informative assessment of model performance than receiver operating characteristic-area under the curve (ROC-AUC)26. Secondary metrics included ROC-AUC, F1 score, precision, recall, specificity, balanced accuracy, and Brier score to provide a broader assessment of performance. Performance was compared with both the prevalence baseline and the SLEDAI-only model to assess whether gene-expression features provided additional predictive value beyond simple clinical information.
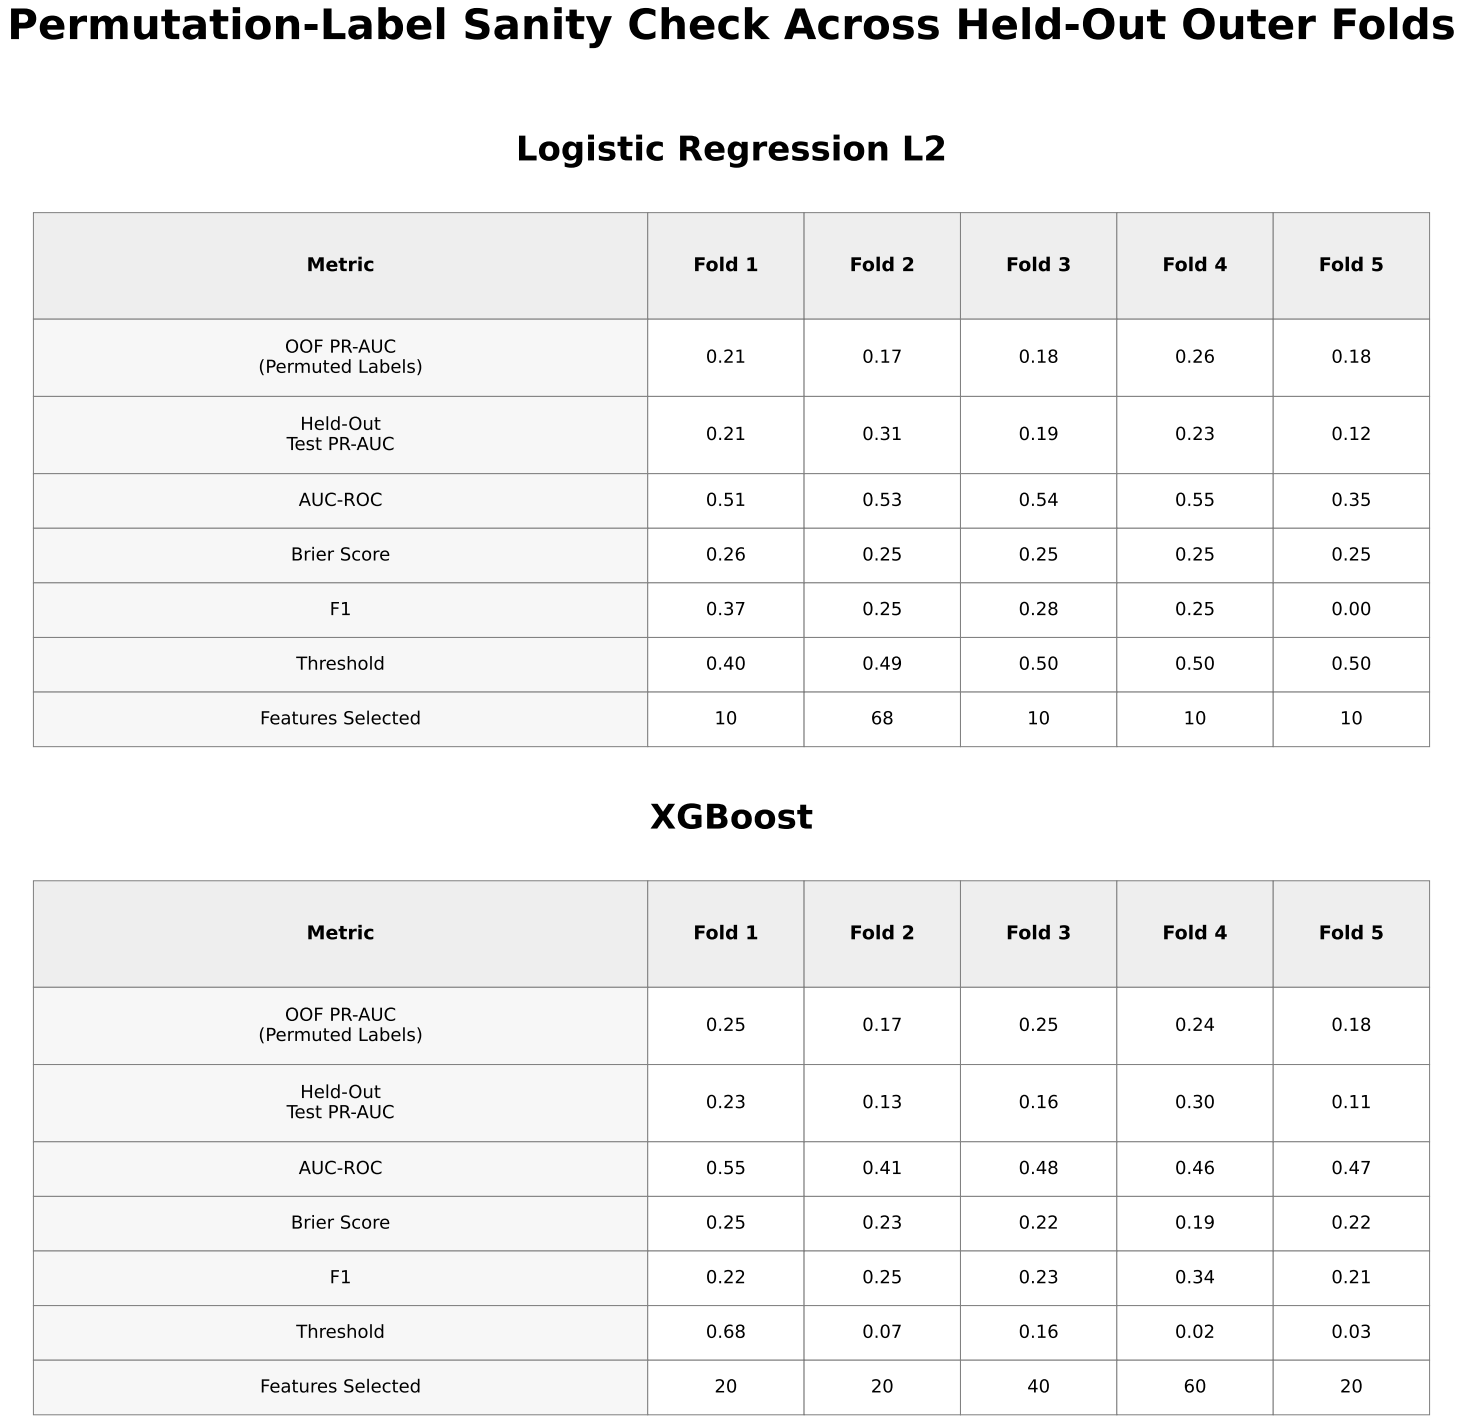
Permutation-Based Sanity Check
Permutation-label testing was performed to evaluate whether observed performance exceeded random expectations.
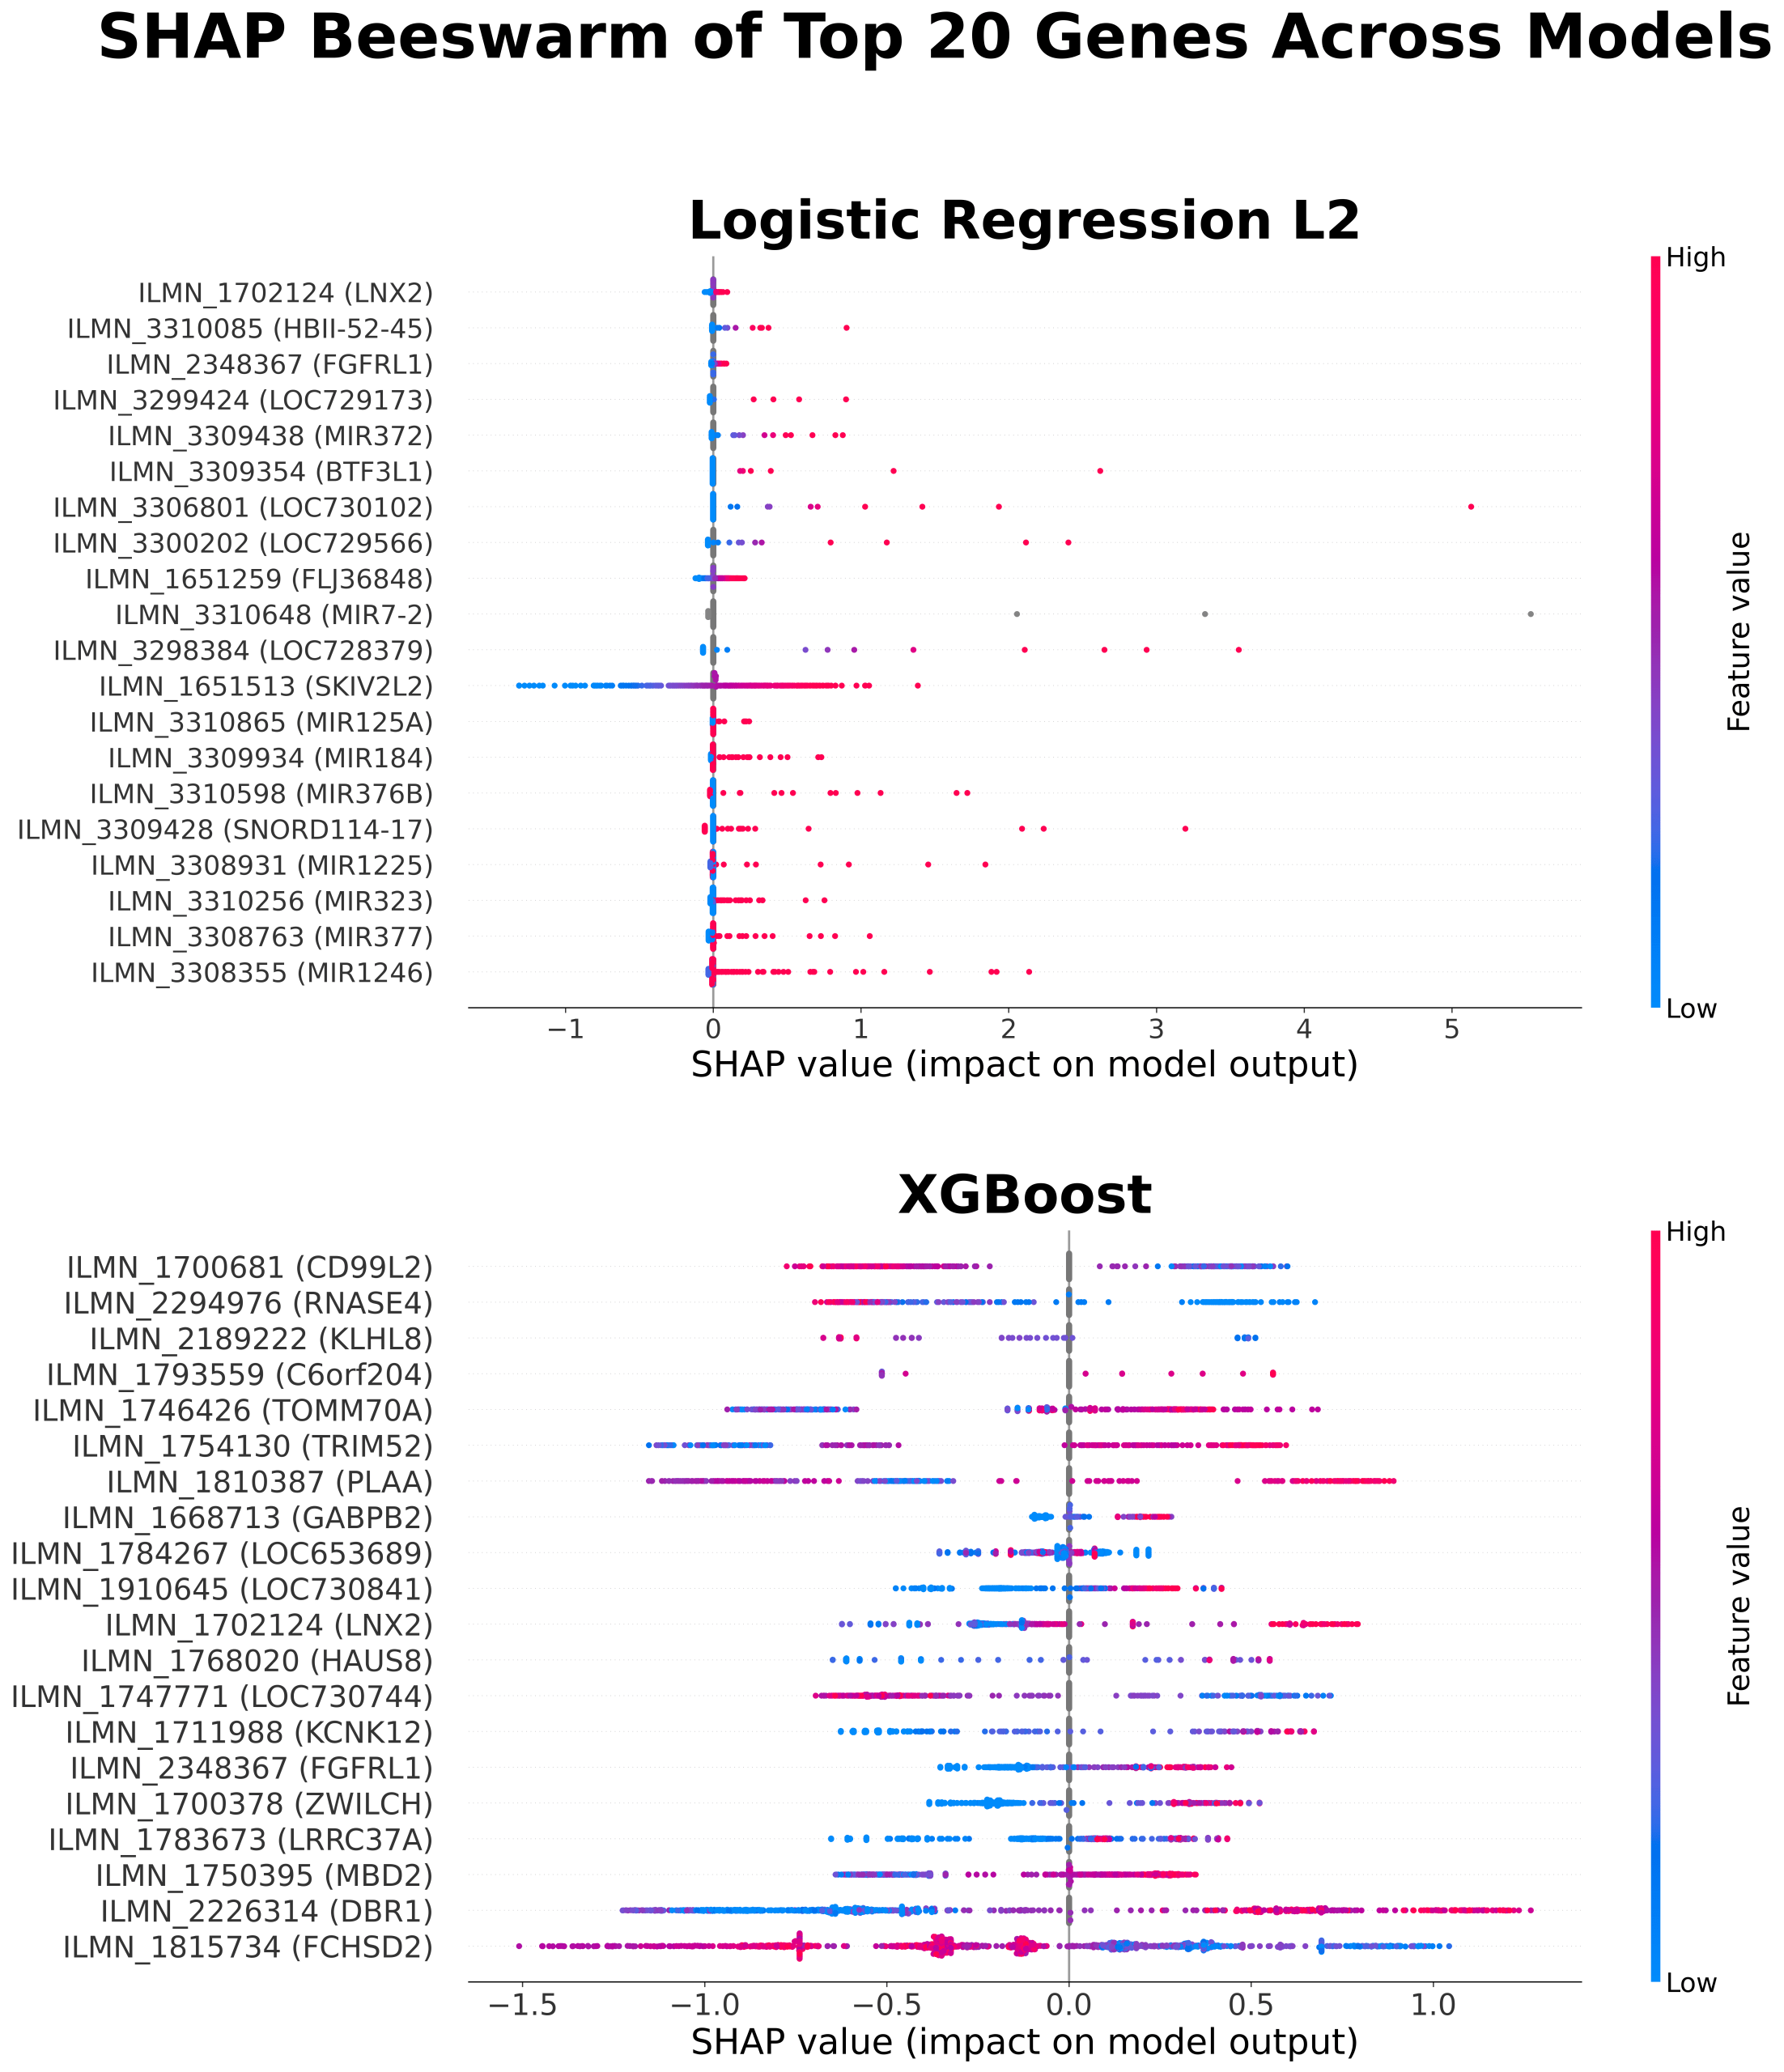
SHAP Analysis
SHAP (SHapley Additive exPlanations) values were calculated within each outer cross-validation fold using the corresponding trained model to quantify feature contributions to model predictions. Functional descriptions of highlighted genes were obtained from the National Center for Biotechnology Information Gene database. To distinguish overall feature importance from features contributing to correct predictions, both global SHAP summaries and a stability-based analysis of correctly classified samples were performed. Correct classifications were defined based on fold-specific decision thresholds. To assess consistency of feature importance, genes appearing in at least two cross-validation folds in the stability-based analysis were identified and further examined.
Results
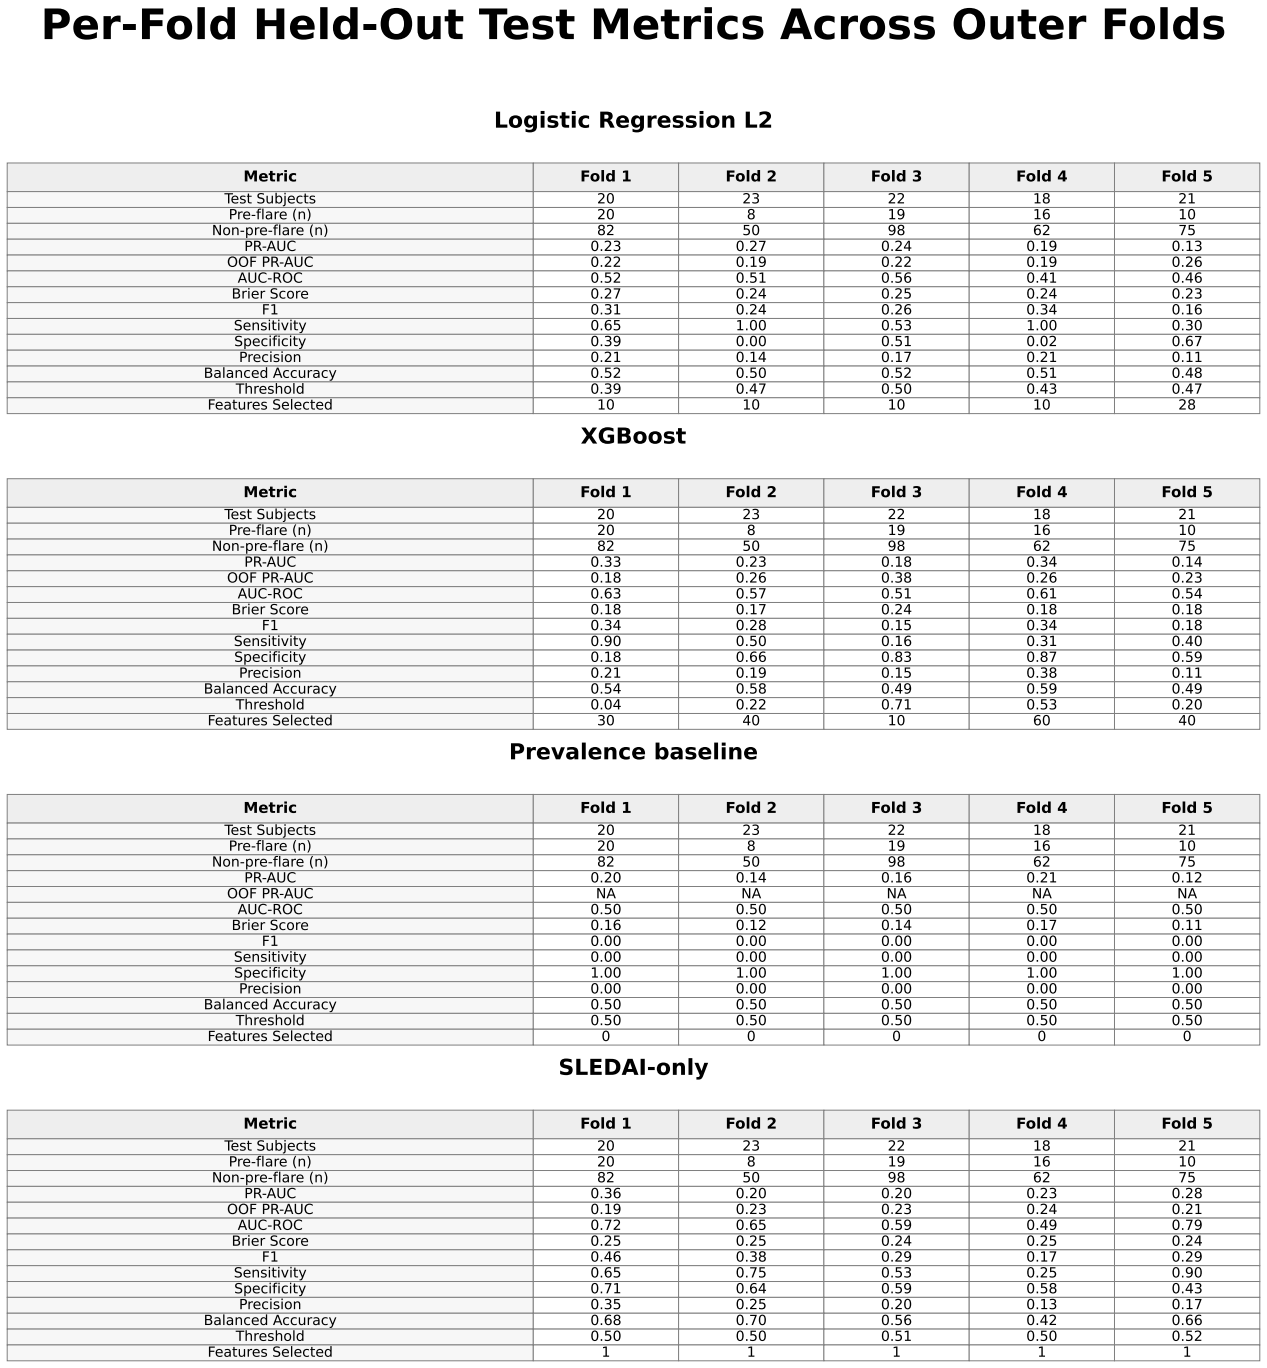
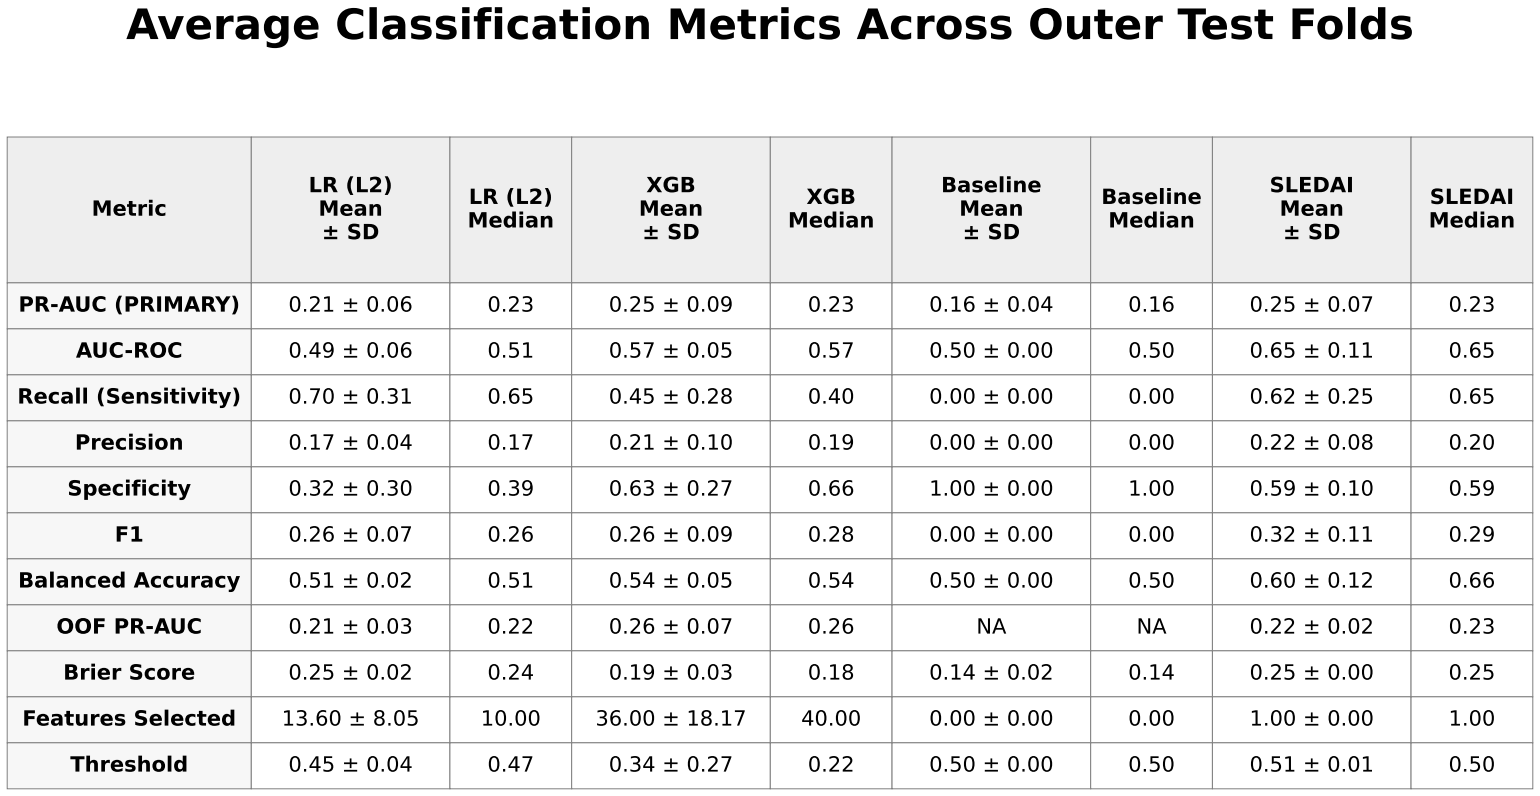
Mean ± standard deviation and median performance metrics for all models.
LR (L2) = logistic regression with L2 regularization
XGB = extreme gradient boosting (XGBoost)
Baseline = prevalence-based classifier
SLEDAI = Systemic Lupus Erythematosus Disease Activity Index–only logistic regression model.
XGBoost achieved slightly higher predictive performance than logistic regression, with a mean precision-recall area under the curve (PR-AUC) of approximately 0.25 ± 0.09 compared with 0.21 ± 0.06. Both models showed only modest improvement over the baseline prevalence of approximately 0.17. Performance varied across folds, with PR-AUC values for XGBoost ranging from approximately 0.18 to 0.33 and for logistic regression from approximately 0.13 to 0.27.
The SLEDAI-only model demonstrated performance comparable to XGBoost, with similar mean PR-AUC and slightly higher values in some folds.
Permutation testing for XGBoost yielded PR-AUC values ranging from approximately 0.17 to 0.25, overlapping with the observed results.
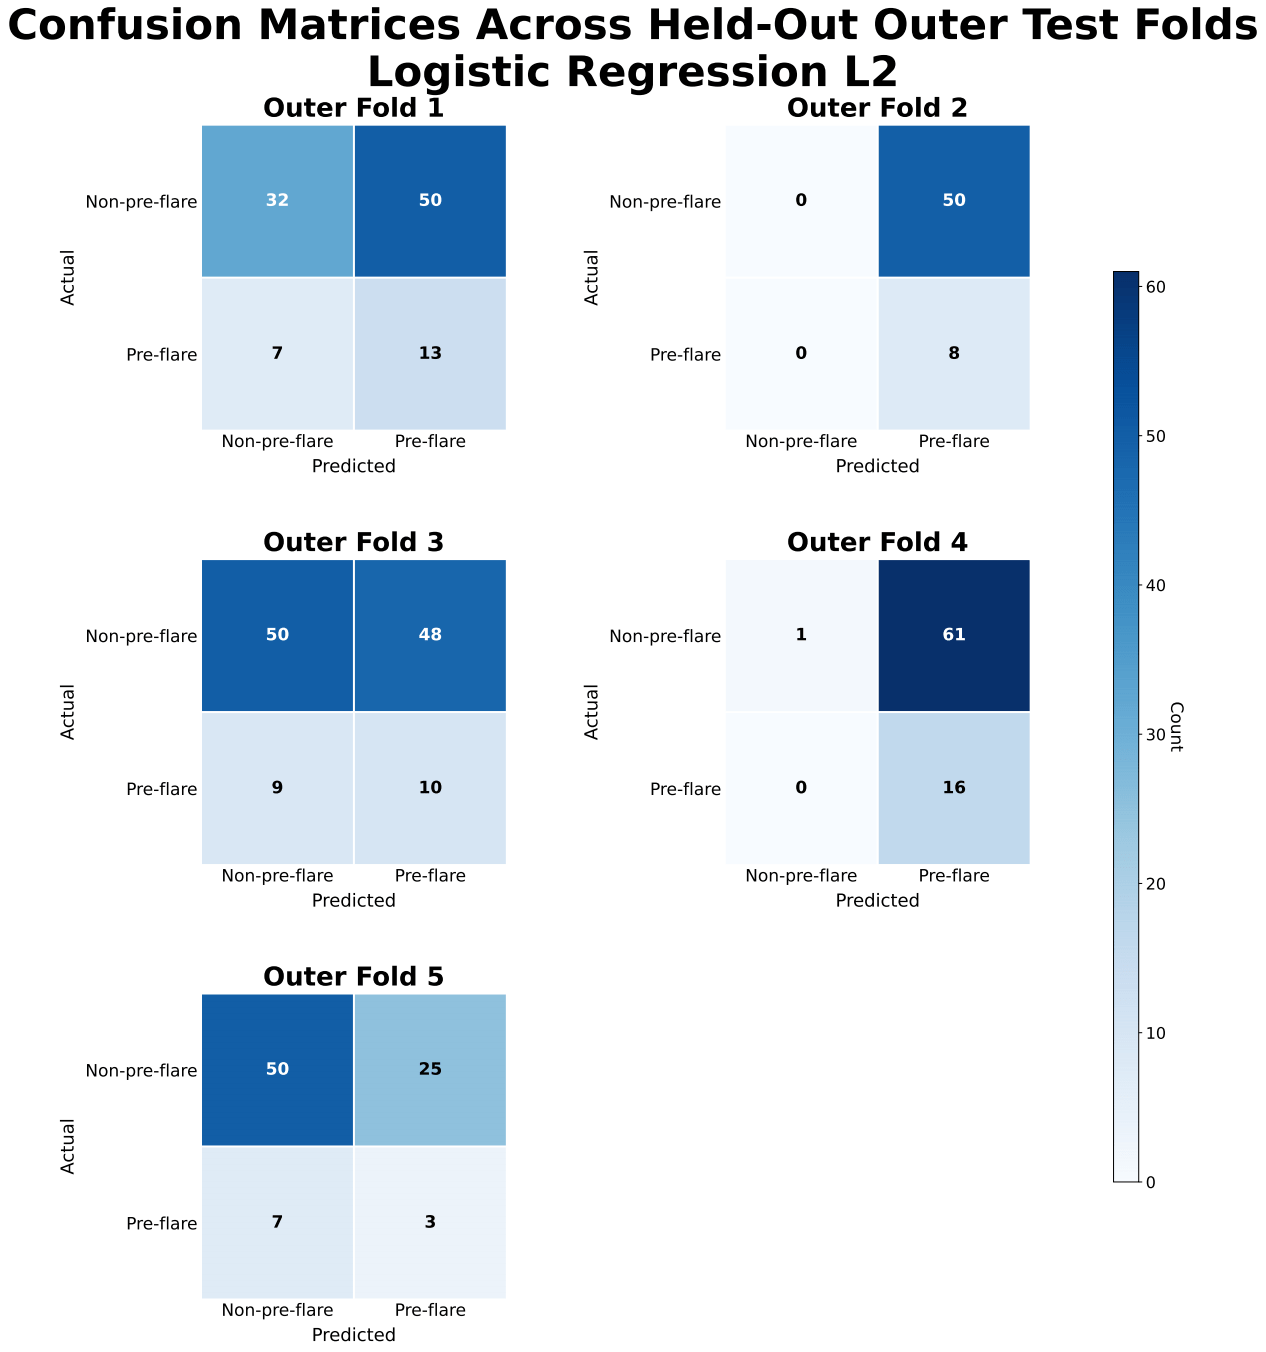
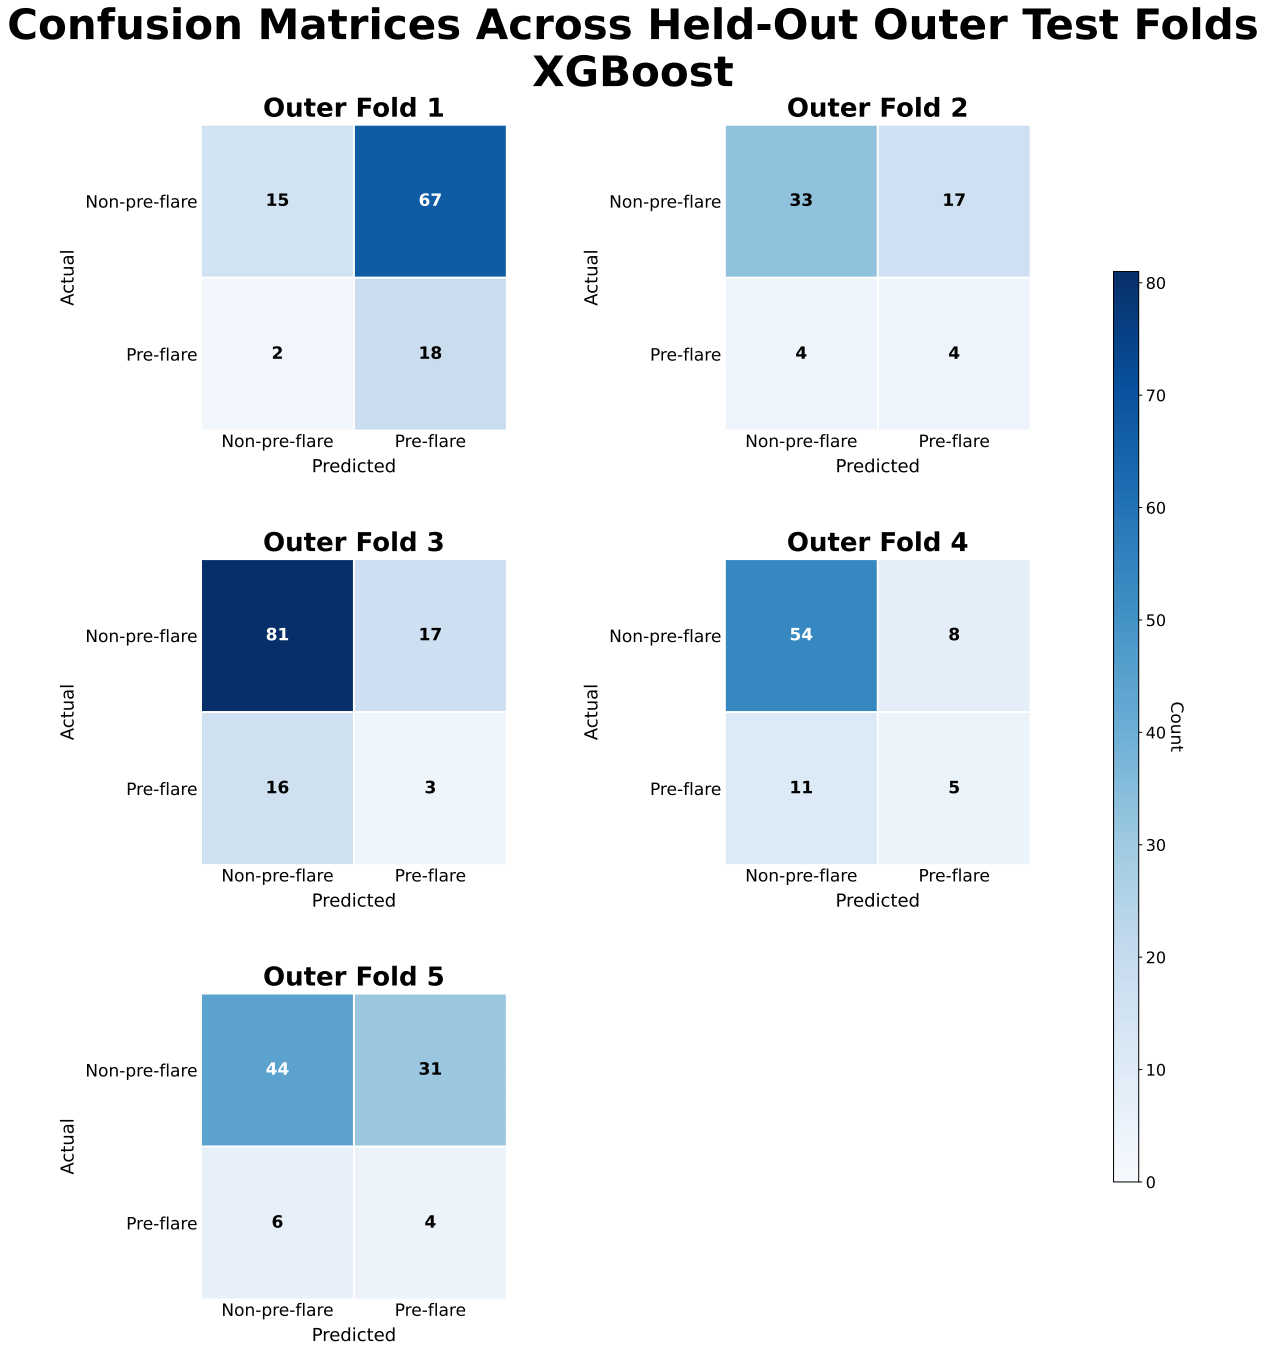
ROC-AUC values for XGBoost were approximately 0.57 ± 0.05, indicating limited discrimination between pre-flare and non-pre-flare samples. Confusion matrices showed frequent misclassification of pre-flare cases, with inconsistent sensitivity and frequent false negatives across folds.
While global SHAP analysis identified many contributing genes, only a limited subset demonstrated consistent importance across cross-validation folds. Stability-based analysis showed that genes appearing in at least two folds included DBR1, several microRNAs, KLHL family genes, and cystatin family genes.
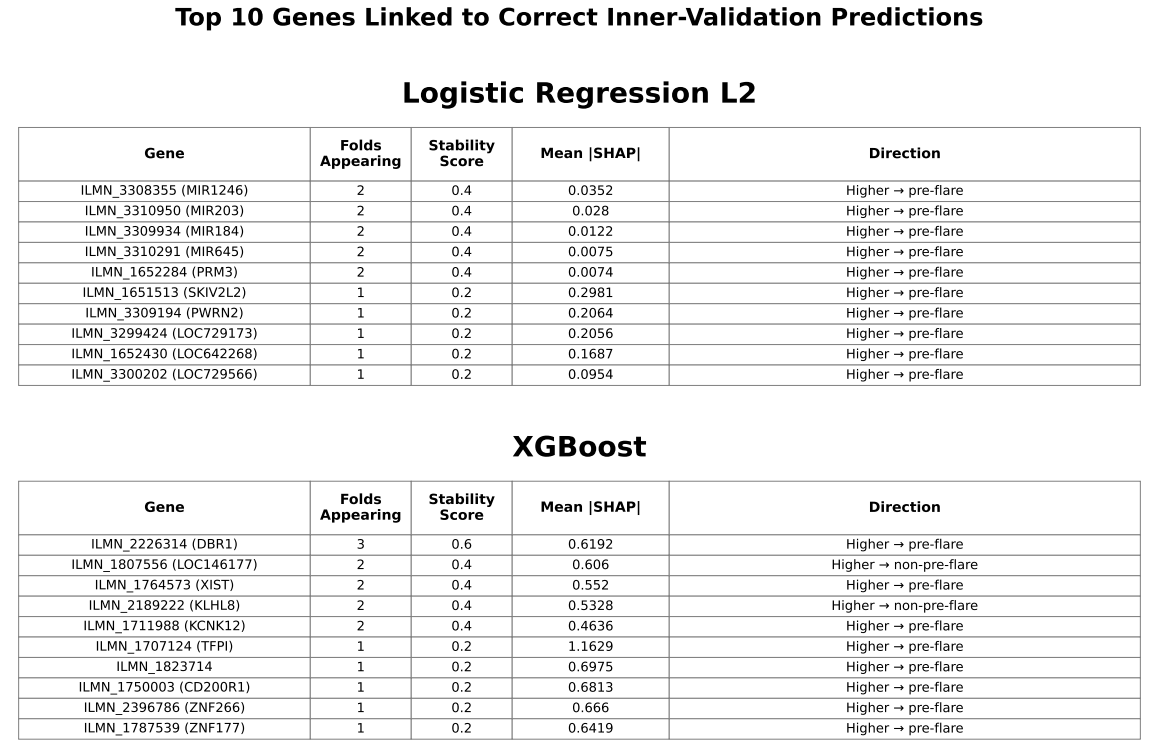
Genes are selected based on their contribution to correctly classified samples and ranked by mean absolute SHAP values. Stability indicates the number of folds (out of 5) in which each gene appears. Direction shows whether higher expression is associated with pre-flare prediction. This analysis focuses on features contributing to correct predictions rather than overall importance.
Discussion
In this study, models using only gene-expression features demonstrated limited ability to predict near-term flares in pediatric patients with SLE. Although XGBoost performed slightly better than logistic regression, overall performance remained limited. The SLEDAI-only model, in which SLEDAI (a clinical measure of disease activity) was used as the sole predictor, showed similar performance, indicating that gene-expression features did not provide meaningful predictive value beyond current disease activity. Permutation-label testing produced near-random performance, with results overlapping those of the observed data, suggesting that the predictive signal was weak and not consistently distinguishable from random variation. Overall, these findings support the limited utility of gene-expression–only models for near-term flare prediction.
Model performance was likely affected by class imbalance, as the low prevalence of pre-flare samples (≈17%) contributed to low precision and variability in recall across folds. Although recall was relatively high for some models, precision remained low, indicating a high false-positive rate that would limit clinical utility by potentially prompting unnecessary treatment escalation. Classification thresholds also varied across folds, particularly for XGBoost, reflecting instability in decision boundaries and reducing confidence in clinical applicability.
Compared with the FLAME models, which incorporated clinical and social variables and achieved receiver operating characteristic–area under the curve (ROC-AUC) values of 0.66–0.6719, gene-expression–only approaches did not improve predictive performance under the current study design. However, direct comparison is limited because the FLAME study reported ROC-AUC, whereas this study primarily used precision–recall area under the curve (PR-AUC) due to class imbalance.
The use of whole-blood gene-expression data may have further limited predictive performance, potentially due in part to the biological heterogeneity of SLE. As a biologically diverse disease with multiple molecular subtypes, SLE exhibits variable gene-expression patterns across patients. This heterogeneity may dilute disease-relevant signals in whole-blood samples, making it more difficult for models to identify consistent patterns associated with pre-flare states.
Variability in selected features and SHAP importance across cross-validation folds suggests that model-identified signals may be influenced by sampling variation and may not generalize well. Although SHAP analysis identified several contributing genes, only a limited subset showed recurring importance across folds, indicating that gene-expression signals associated with flare prediction may not be stable across patients. Genes appearing in at least two folds were primarily associated with RNA- and nucleic acid–related processes, including RNA splicing (DBR1), microRNA-mediated regulation (MIR genes), and DNA-associated functions (PRM3), as well as protein regulation pathways (KLHL family) and immune-related processes (cystatin family). These findings suggest that alterations in gene regulation may be involved in pre-flare states, consistent with prior transcriptomic studies in SLE20; however, their lack of consistency across patients limits their utility for reliable prediction.
Limitations
Several limitations should be considered when interpreting these results. The sample size was relatively small, particularly for the pre-flare class, which increases the risk of overfitting and limits generalizability. Gene-expression values were used without additional normalization or batch-effect correction, which may have introduced technical variability. In addition, all data were derived from a single dataset, and no independent external validation was performed.
The exact timing of clinical symptom onset relative to recorded visits was unknown, which limited interpretation of prediction timing. Accordingly, this study did not incorporate time-to-flare as an explicit feature.
Feature selection and model outputs demonstrated variability across cross-validation folds, suggesting that identified predictors may be sensitive to sampling variation and may not represent stable biological signals. Classification thresholds varied across folds, particularly for XGBoost, indicating instability in decision boundaries.
In addition, the biological heterogeneity of SLE represents an important limitation. The dataset likely includes patients with diverse molecular subtypes and disease mechanisms, which were not explicitly modeled or stratified in this study. As a result, potentially meaningful subtype-specific gene-expression patterns were likely obscured when all patients were analyzed together. This may have contributed to the weak and inconsistent predictive signal observed across cross-validation folds.
Finally, model calibration was not formally assessed, which limits interpretation of predicted probabilities as clinical risk estimates. The combination of low precision, variable thresholds, and modest PR-AUC values suggests that predicted probabilities may not be sufficiently reliable for clinical decision-making.
Conclusion
A leakage-safe machine learning pipeline was developed to predict near-term flares in pediatric patients with systemic lupus erythematosus (SLE) using gene-expression data. Although XGBoost showed slightly better performance than logistic regression, overall predictive performance remained limited. The SLEDAI-only model achieved comparable performance, suggesting that gene-expression data alone may not provide meaningful predictive value beyond current disease activity. In addition, permutation-based testing produced results similar to those observed in the original models, indicating that the predictive signal was weak and not consistently distinguishable from random variation.
These findings suggest that gene-expression–only approaches are unlikely to yield robust and clinically reliable predictions, particularly when patients with SLE are analyzed as a single group. This limitation likely reflects the underlying biological heterogeneity of SLE, in which variation in disease mechanisms obscures consistent gene-expression patterns across patients and limits the ability of models to identify stable predictive signals. In addition, class imbalance may have contributed to reduced sensitivity to pre-flare cases. Addressing these challenges may require strategies that stratify patients into more homogeneous groups and incorporate biologically informed feature selection. More broadly, improving predictive performance will likely require larger datasets, external validation, and the integration of multiple data modalities, including clinical and molecular features. The observed variability in feature importance across cross-validation folds further supports the conclusion that gene-expression signals relevant to flare prediction may not be stable across patients.
Despite the modest predictive performance, this study provides a leakage-safe, reproducible framework for evaluating gene-expression–based prediction of pediatric SLE flares and highlights key methodological and biological challenges that must be addressed to improve predictive modeling in pediatric SLE. Ultimately, improving predictive approaches and developing more effective, targeted treatment strategies will be essential to reduce disease burden and improve long-term outcomes in pediatric patients with SLE.
Acknowledgements
I would like to thank my previous mentor, Landon Clark, an MD/PhD candidate at Vanderbilt University, during the Harvard Undergraduate OpenBio Student Research Institute summer high school mentorship program for introducing me to scientific research. I would also like to thank my teachers at Northern Valley Regional High School at Old Tappan for their continued support throughout my academic journey.
References
- A. Fanouriakis, N. Tziolos, G. Bertsias, D. T. Boumpas. Update οn the diagnosis and management of systemic lupus erythematosus. Annals of the Rheumatic Diseases. Vol. 80(1), pg. 14-25, 2021, https://doi.org/10.1136/annrheumdis-2020-218272. [↩]
- P. M. Izmirly, H. Parton, L. Wang, W. J. McCune, S. S. Lim, C. Drenkard, E. D. Ferucci, M. Dall’Era, C. Gordon, C. G. Helmick, E. C. Somers. Prevalence of systemic lupus erythematosus in the United States: estimates from a meta-analysis of the Centers for Disease Control and Prevention National Lupus Registries. Arthritis & Rheumatology. Vol. 73(6), pg. 991-996, 2021, https://doi.org/10.1002/art.41632. [↩]
- M. O. Valenzuela-Almada, M. Hocaoglu, J. Y. Dabit, S.-A. Osei-Onomah, M. L. Basiaga, A. B. Orandi, R. E. Giblon, K. E. Barbour, C. S. Crowson, A. Duarte-García. Epidemiology of childhood-onset systemic lupus erythematosus: a population-based study. Arthritis Care & Research. Vol. 74(5), pg. 728-732, 2022, https://doi.org/10.1002/acr.24827. [↩]
- D. D. Gladman, D. Ibanez, M. B. Urowitz. Systemic lupus erythematosus disease activity index 2000. The Journal of Rheumatology. Vol. 29(2), pg. 288-291, 2002, https://www.jrheum.org/content/29/2/288.long. [↩]
- M. Petri, J. Buyon, M. Kim. Classification and definition of major flares in SLE clinical trials. Lupus. Vol. 8(8), pg. 685-691, 1999, https://doi.org/10.1191/096120399680411281. [↩]
- F. Conti, F. Ceccarelli, C. Perricone, F. Miranda, S. Truglia, L. Massaro, V. A. Pacucci, V. Conti, I. Bartosiewicz, F. R. Spinelli, C. Alessandri, G. Valesini. Flare, persistently active disease, and serologically active clinically quiescent disease in systemic lupus erythematosus: a 2-year follow-up study. PLOS One. Vol. 7(9), e45934, 2012, https://doi.org/10.1371/journal.pone.0045934. [↩]
- R. Kandane-Rathnayake, D. Milea, W. Louthrenoo, A. Hoi, V. Golder, J. Cho, A. Lateef, S.-F. Luo, Y.-J. J. Wu, L. Hamijoyo, S. Sockalingam, Z. Li, S. Navarra, L. Zamora, M. Harigai, Y. Katsumata, M. Chan, Y. Hao, Z. Zhang, S. O’Neill, F. Goldblatt, S. Oon, X. Xu, A. A. N. Rojas, S.-C. Bae, C. S. Lau, M. Nikpour, E. Morand. Longitudinal associations of flare and damage accrual in patients with systemic lupus erythematosus. Lupus Science & Medicine. Vol. 12(1), e001363, 2025, https://doi.org/10.1136/lupus-2024-001363. [↩]
- L. K. Alharbi, I. A. Al-Homood, A. A. Binammar, N. M. AlMuhareb. Organ damage and its associated factors in systemic lupus erythematosus patients: a retrospective cohort study. Journal of Clinical Medical Research. Vol. 17(1), pg. 35-43, 2025, https://doi.org/10.14740/jocmr6129. [↩]
- S. M. Gamal, N. Fouad, N. Yosry, W. Badr, N. Sobhy. Disease characteristics in patients with juvenile- and adult-onset systemic lupus erythematosus: a multi-center comparative study. Archives of Rheumatology. Vol. 37(2), pg. 280-287, 2022, https://doi.org/10.46497/ArchRheumatol.2022.8888. [↩]
- T. Puengpipattrakul, B. Lerkvaleekul, K. Pirojsakul, S. Vilaiyuk. Risk factors associated with multiple organ damage in childhood-onset systemic lupus erythematosus. Frontiers in Pediatrics. Vol. 11, 1301201, 2023, https://doi.org/10.3389/fped.2023.1301201. [↩]
- R. N. Cunha, L. Saraiva, D. Jesus, A. Doria, J. P. da Silva, L. S. Ines. Predictors of flare in SLE patients fulfilling lupus low disease activity state: a cohort study of 292 patients with 36-month follow-up. Rheumatology. Vol. 62(11), pg. 3627-3635, 2023, https://doi.org/10.1093/rheumatology/kead097. [↩]
- A. Fatemi, K. E. Keivani-Boroujeni, A. Smiley. Predictors of severe lupus flare: a prospective follow-up study. BMC Rheumatology. Vol. 7(10), 2023, https://doi.org/10.1186/s41927-023-00333-y. [↩]
- Y. Bai, J. Zhao, Q. Wang, D. Xu, X. Zeng, X. Tian, H. J. Li, M. Li. Prediction of flares in systemic lupus erythematosus during post-remission follow-up. Journal of Inflammation Research. Vol. 18, pg. 3377-3384, 2025, https://doi.org/10.2147/JIR.S504995. [↩]
- M. A. Petri, R. F. van Vollenhoven, J. Buyon, R. A. Levy, S. V. Navarra, R. Cervera, M. Zeldin, J. Freimuth, C. Zhong, W. Streicher, P. Duca, D. Kilgallen, D. J. Wallace. Baseline predictors of systemic lupus erythematosus flares: data from the combined placebo groups in the phase III belimumab trials. Arthritis & Rheumatism. Vol. 65(8), pg. 2143-2153, 2013, https://doi.org/10.1002/art.37995. [↩]
- S. P. Huang, M. DerSarkissian, Y. M. Gu, M. S. Duh, M. J. Wang, J. Benson, J. Vu, C. Averell, C. F. Bell. Prolonged oral corticosteroid treatment in patients with systemic lupus erythematosus: an evaluation of 12-month economic and clinical burden. Journal of Managed Care & Specialty Pharmacy. Vol. 29(4), pg. 365-377, 2023, https://doi.org/10.18553/jmcp.2023.29.4.365. [↩]
- E. Zhang, S. Capponi, R. Scobell, G. Alonzi, M. Hlobik, A. Daga, E. Meidan, H. Wobma, L. Kim, L. A. Henderson, S. Case, P. A. Nigrovic, J. H. Stone, K. H. Costenbader, M. B. F. Son, J. C. Chang. Real-world application of the pediatric glucocorticoid toxicity index in childhood-onset lupus. Seminars in Arthritis and Rheumatism. Vol. 68, 152516, 2024, https://doi.org/10.1016/j.semarthrit.2024.152516. [↩]
- M. Hanif, C. Sarker, E. Al-Abadi, K. Armon, K. Bailey, M. Bohm, M. Brennan, C. Ciurtin, J. Gardner-Medwin, D. P. Hawley, A. Kinder, A. Leahy, G. Malik, Z. McLaren, E. Moraitis, E. Mosley, A. V. Ramanan, S. Rangaraj, A. Ratcliffe, P. Riley, H. Rostron, E. Sen, M. W. Beresford, E. M. D. Smith. Contributors to organ damage in childhood lupus: corticosteroid use and disease activity. Rheumatology. Vol. 64(5), pg. 3028–3038, 2025, https://doi.org/10.1093/rheumatology/keae592. [↩]
- H. Brunner, C. Abud-Mendoza, D. Viola, I. C. Penades, D. Levy, J. Anton, J. E. Calderon, V. G. Chasnyk, M. A. Ferrandiz, V. Keltsev, M. E. P. Gastanaga, M. Shishov, A. L. Boteanu, M. Henrickson, D. Bass, K. Clark, A. Hammer, B. N. Ji, A. Nino, D. A. Roth, H. Struemper, M. L. Wang, A. Martini, D. Lovell, N. Ruperto. Safety and efficacy of intravenous belimumab in children with systemic lupus erythematosus: results from a randomised, placebo-controlled trial. Annals of the Rheumatic Diseases. Vol. 79(10), pg. 1340-1348, 2020, https://doi.org/10.1136/annrheumdis-2020-217101. [↩]
- Y. Li, L. Yao, Y. A. Lee, Y. Huang, P. A. Merkel, E. Vina, Y. Yeh, Y. Li, J. M. Allen, J. Bian, J. Guo. A fair machine learning model to predict flares of systemic lupus erythematosus. JAMIA Open. Vol. 8(4), ooaf072, 2025, https://doi.org/10.1093/jamiaopen/ooaf072. [↩] [↩]
- F. Q. Wang, L. Shao, X. Dang, Y.-F. Wang, S. Chen, Z. Liu, Y. Mao, Y. Jiang, F. Hou, X. Guo, J. Li, L. Zhang, Y. Sang, X. Zhao, R. Ma, K. Zhang, Y. Zhang, J. Yang, X. Wen, J. Liu, W. Wei, C. Zhang, W. Li, X. Qin, Y. Lei, H. Feng, X. Yang, C. H. She, C. Zhang, H. Su, X. Chen, J. Yang, Y. L. Lau, Q. Wu, B. Ban, Q. Song, W. Yang. Unraveling transcriptomic signatures and dysregulated pathways in systemic lupus erythematosus across disease states. Arthritis Research & Therapy. Vol. 26(99), 2024, https://doi.org/10.1186/s13075-024-03327-4. [↩] [↩]
- S. A. Yones, A. Annett, P. Stoll, K. Diamanti, L. Holmfeldt, C. F. Barrenas, J. R. S. Meadows, J. Komorowski. Interpretable machine learning identifies pediatric systemic lupus erythematosus subtypes based on gene expression data. Scientific Reports. Vol. 12, pg. 7433, 2022, https://doi.org/10.1038/s41598-022-10853-1. [↩] [↩]
- E. Hubbard, P. Bachali, A. C. Grammer, P. E. Lipsky. Validation of eight endotypes of lupus based on whole-blood RNA profiles. Lupus Science & Medicine. Vol. 12, e001526, 2025, https://doi.org/10.1136/lupus-2025-001526. [↩] [↩]
- R. K. Perez, M. G. Gordon, M. Subramaniam, M. C. Kim, G. C. Hartoularos, S. Targ, Y. Sun, A. Ogorodnikov, R. Bueno, A. Lu, M. Thompson, N. Rappaport, A. Dahl, C. M. Lanata, M. Matloubian, L. Maliskova, S. S. Kwek, T. Li, M. Slyper, J. Waldman, D. Dionne, O. Rozenblatt-Rosen, L. Fong, M. Dall’era, B. Balliu, A. Regev, J. Yazzdany, L. A. Criswell, N. Zaitlen, C. J. Ye. Single-cell RNA-seq reveals cell type–specific molecular and genetic associations to lupus. Science. Vol. 376, eabf1970, 2022, https://doi.org/10.1126/science.abf1970. [↩]
- E. Elefante, D. Schiliro, M. L. Manca, C. Stagnaro, D. Zucchi, C. Cardelli, V. Signorini, M. Maffi, G. Cascarano, R. Zas, L. Carli, F. Ferro, C. Tani, M. Mosca. Different phenotypes of severe flares in patients with systemic lupus erythematosus: results of a clustering analysis in a monocentric cohort. Frontiers in Immunology. Vol. 16, 1673350, 2025, https://doi.org/10.3389/fimmu.2025.1673350. [↩]
- M. K. Crow, M. Olferiev, K. A. Kirou. Identification of candidate predictors of lupus flare. Transactions of the American Clinical and Climatological Association. Vol. 126, pg. 184-196, 2015, https://pmc.ncbi.nlm.nih.gov/articles/PMC4530671/. [↩]
- T. Saito, K. Rehmsmeier. The precision-recall plot is more informative than the ROC plot when evaluating binary classifiers on imbalanced datasets. PLOS One. Vol. 10(3), e0118432, 2015, https://doi.org/10.1371/journal.pone.0118432. [↩]


 and a Developing (India) Economy")