
Abstract
The IPL’s rapid evolution into a faster and more competitive format has made traditional batting metrics insufficient for informed team selection. As batting styles become varied, averages and strike rates no longer capture the full range of player roles. This study examines how a team’s batting-role composition influences win rates in the Indian Premier League (IPL). Machine learning algorithms were applied to a ball-by-ball dataset of 240,000 deliveries across sixteen seasons (2008–2023). Nineteen batting features including scoring tempo, consistency, boundary frequency, dot-ball percentage were analysed to identify underlying performance patterns. Principal Component Analysis (PCA) and k-means clustering revealed four batting archetypes: low baseline contributors, stable accumulators, explosive accelerators, and solid contributors. Season-level team success was evaluated by projecting meaningful player-season records (≥50 balls faced) into the PCA–cluster space to quantify each team’s archetype composition. This was then regressed against win percentage using Ordinary Least Squares (OLS). Although explanatory power was modest (R² = 0.143 in-sample, F-statistic of 4.044, p = 0.00447), C1 and C2 players showed positive associations with win percentage (β = 3.06 ; β = 0.99), while C0 players were negatively associated. Granular analysis of the top predicted team compositions demonstrated a consistent preference for lineups balancing the stability of Cluster 1 players with the explosiveness of Cluster 2 players, supported by adaptable Cluster 3 contributors. This balance emerged as the central insight in effective team composition. Future analyses may integrate additional bowling, fielding, and match-condition variables to achieve more refined evaluations of team performance.
Keywords: Indian Premier League, cricket analytics, batting archetypes, machine learning, Principal Component Analysis, k-means clustering
Introduction
Cricket is a two-team sport involving a batting side and a bowling side where the batting team aims to score as many runs as possible before all ten wickets fall or the overs conclude. The formats vary from multi-day Test matches to one day formats to the recently very popular and commercially dominant Twenty20 game. Batting has become more specialized in T20 competitions such as the Indian Premier League (IPL), where batsmen must adapt to rapidly changing match conditions – rotating strike, preserving wickets, and accelerating scoring through boundary-hitting. As the league has become more competitive with high stakes, analysts, teams and coaches have begun seeking insights beyond simple averages or “strike rates,” to more variables and trying to analyse how different kinds of batsmen shape match outcomes.
In many sports, analytics has long struggled with the limitations of single, isolated performance metrics. In football, a critical review of 60 football performance-analysis studies finds that more than 70% of published studies rely on isolated technical statistics (passes completed, shots taken, possession time) that neglect essential contextual information such as opposition strength, match state, and venue1. This analysis concludes that such findings replicate common-sense truisms rather than generating insight. Even in cricket, researchers have tried descriptive analytics, such as Welsh’s exploratory Kaggle notebook2, which provides visual summaries of scoring patterns. However, it lacks a systematic framework for identifying recurring batting styles or relating lineup structure to team success. While averages, strike rates, and run aggregates are important, these alone do not elucidate the distinct behavioural value of different batting styles. Swetha and Saravanan similarly found that no single batting or bowling attribute alone predicts cricket outcomes, and that win probability is shaped by a combination of performance factors across both teams3.
As sports datasets have grown in granularity, machine learning has become a popular analytical tool. A broad review by Bunker and Thabtah shows that modern predictive pipelines rely heavily on engineered features, structured preprocessing, and evaluation frameworks to achieve strong performance4. Yet despite ML’s sophistication, most existing models remain focused on predicting outcomes (team win/loss, runs scored) rather than explaining whyplayers behave differently or howlineups derive strategic value. Reviews of ML-based cricket analytics identify critical missing links: existing data mining and prediction models predominantly target match outcomes and individual player performance, while the compositional and contextual factors that structurally drive team success remain largely unexplored5,6.
Researchers increasingly aim to identify roles and tactical structures that lead to a more behaviorally grounded perspective rather than rely on summary metrics. Gudmundsson and Horton surveyed spatio-temporal methods across invasion sports (football, basketball, hockey) and reviewed tracking systems, movement modelling, clustering, formation detection, dominant region analysis, and tactical-pattern mining with the thesis that player/team behavior is best understood through movement patterns, interactions and spatial structures7. Their study reveals roles and coordinated behaviors invisible in raw statistics, and thus they conclude that spatial context and behavioral patterns are essential for interpreting action value and conducting meaningful analytics. Complementing this work, Decroos et al. introduce ‘Valuing Actions by Estimating Probabilities’ (VAEP), which values every on-ball action by its effect on future scoring or conceding probabilities. They used Machine Learning to estimate action-level contributions across sequences and find that players with similar outputs differ substantially in their stylistic action profiles – for example, backward passes, link-up plays and small decisions can add high value. They conclude that roles emerge from chains of actions rather than single event statistics8.
Cricket shares many of these analytical complexities. In cricket, a batter’s contribution varies significantly depending on whether they are opening into fielding restrictions, stabilizing after early wickets, absorbing pressure in the middle overs, or accelerating in the death overs. Given the short format, IPL matches can be volatile, which amplifies the need for balanced role combinations within a lineup. Raw metrics alone are insufficient for IPL squad selection, as the format’s auction driven high stakes require an understanding of each batter’s role, adaptability, and suitability for specific match situations.
Cricket-focused machine-learning studies have generally concentrated on predicting player outputs or match results, and many studies illustrate this focus. Passi and Pandey scraped One Day International (ODI) data and reconstructed player-by-player career histories, and then engineered traditional and derived features: consistency, form, venue history, opposition record, role, etc9. They then built classification models to predict runs scored and wickets taken. They concluded that feature engineering improves prediction accuracy, but relies on manually constructed rating formulas. The best ML model (Random Forest) predicts outputs with significant accuracy of 90-92 %. They conclude that ML is useful for forecasting but cannot explain how players contribute or behavioural styles. Similar classification-based approaches have been applied more broadly in cricket: Bharadwaj et al., Dakhani and Maginmani, and Patil et al. and Mundhe et al.each applied supervised ML , most effectively Random Forest to predict individual player outputs and team selection, achieving high accuracy but treating team composition as a ranking of individual scores rather than a balance of distinct batting roles10,11,12,13.
In the IPL context, Lamsal and Choudhary scraped all IPL data (2008–2017). They used Recursive Feature Elimination (RFE) to identify 7 match-level predictive features. Using multivariate regression they then reverse-engineered player points (weights for wickets, boundaries, dot balls, catches, stumpings) and computed season-level team strength using top 11 most-used players. They trained 6 ML models to predict all 2018 IPL matches and found that multi-layer perceptron (MLP) showed best accuracy (72% accuracy)14. Karan et al. similarly applied multiple classifiers to IPL match-winner prediction, with Random Forest again outperforming alternatives15. But the analyses offered no insight into how role structure within a batting order impacts success. Complementary IPL-focused work includes Singh et al.’s portfolio optimization of team performance evaluation, Viswanadha et al.’s dynamic Random Forest modelling of relative team strengths, and Sinha’s application of six ML classifiers to IPL 2020 match prediction with Random Forest achieving 88% accuracy across all three yet each approach aggregates individual performance metrics rather than capturing how the compositional mix of batting roles shapes long-run team success16,17,18.
Together, these studies demonstrate that while ML can forecast outcomes, it does not explain the behavioural roles that shape team performance
These gaps highlight the need for an approach that captures distinct batting styles or archetypes within IPL performance and analyses the composition of teams based on these archetypes to match success. Work on intelligent team selection further underscores this gap: Kapadiya et al. showed that meaningful selection models require contextual variables such as the venue, opposition, and pitch, while also requiring individual performance data, yet still offer no framework for understanding how the mix of batting roles within a lineup drives team success19.
This study therefore investigates the connection between batting role composition and team success in the IPL. Two research questions guide the analysis. The first research question focuses on how the detailed features of batting performance can be employed to derive interpretable batsman archetypes. The second research question focuses on the association between the composition of these archetypes in a team and its winning percentage seasonally.
The first question on deriving interpretable batting archetypes is addressed in the Feature Engineering and inclusion criteria, Dimensionality Reduction and Player Profiling and Player Archetype Identification via K-means Clustering sections. Nineteen batting features are first compressed using Principal Component Analysis (PCA), which converts correlated metrics into orthogonal components capturing the dominant sources of variation across batsmen. K-means clustering is then applied to this reduced space to identify four predominant archetypes.
The second research question on the association between archetype composition and team success is addressed in the Regression Modeling section. Each team’s seasonal archetype composition is quantified by projecting qualifying player-seasons into the PCA–cluster space and aggregating role counts, which are then regressed against win percentage using Ordinary Least Squares (OLS). Together, these steps form an interpretable pipeline from granular ball-by-ball data to empirically defined batting roles and their relationship with long-term IPL team success This places our work between descriptive dashboards and black-box predictors: we use granular ball-by-ball data to empirically define roles and examine how their combination influences long-term IPL team success.
Methods
Study design and end-to-end Modeling pipeline
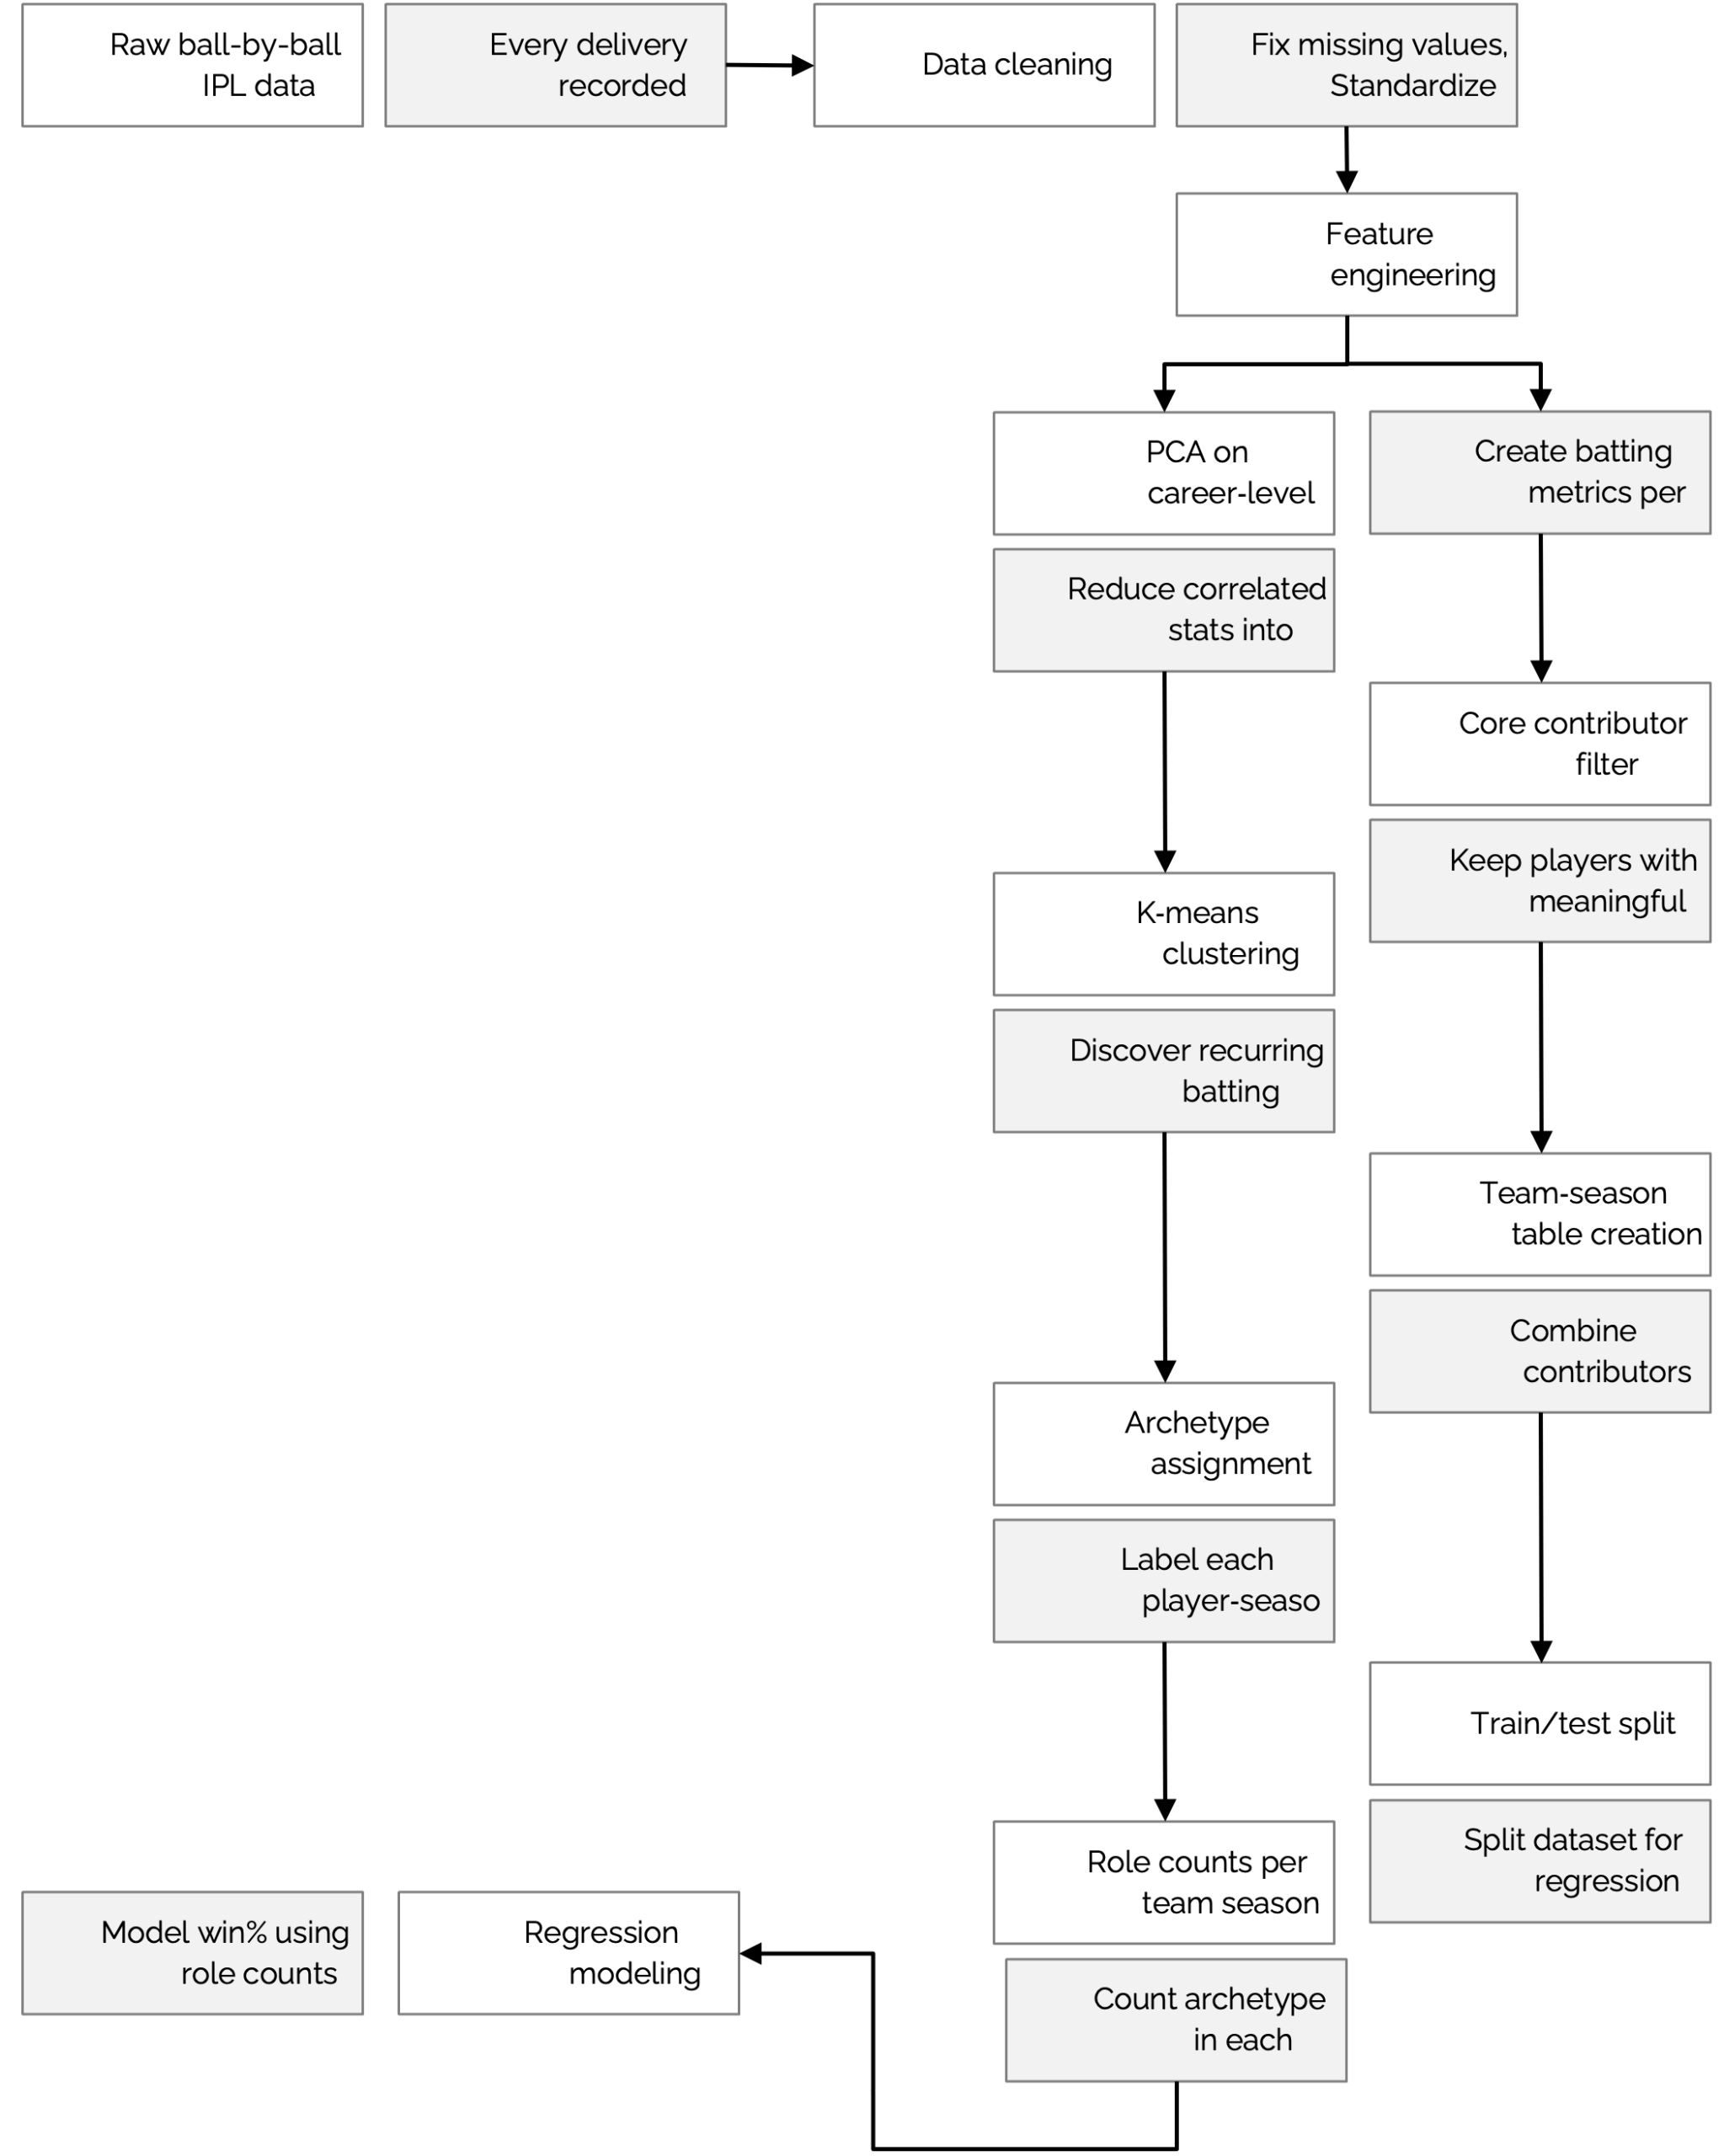
The objective was to identify distinct batting styles and examine how different combinations of these styles among a team’s core contributors relate to its win rate. To achieve this, raw player-level statistics were distilled into a concise set of recurring batting roles (archetypes), and the relationship between these role counts, and team performance was then evaluated. The workflow combines unsupervised learning for player representation with supervised learning for outcome prediction (see Fig 1 for a schematic of the workflow).
First, raw ball-by-ball data was cleaned, missing data fixed, and data was normalized to create batting features. These features were then aggregated into career-level summaries.
PCA was then applied to these features to reduce correlated statistics into a common two-dimensional space that captures key style dimensions. PCA is widely used for summarizing high-dimensional data while preserving maximal variance in orthogonal components, making it suitable for extracting underlying behavioural patterns in sports performance20. We implement PCA using the sklearn.decomposition. PCA module from the scikit-learn library, which provides a robust and well-tested computational interface for dimensionality reduction21. Statistical learning texts highlight PCA as a foundational tool for interpreting complex player metrics, especially when behavioural structure is embedded in correlated inputs22.
K-means clustering is used in this analysis to discover recurring batting styles (archetypes) directly from the data, without imposing any predefined categories. K-means is one of the earliest and most widely applied algorithms for partitioning multivariate observations, and it has a long history of uncovering latent structure in high-dimensional datasets23. The value k=4 is identified as optimal for clustering. This enables uncovering data-driven batting roles, rather than manually defined archetypes like “anchor,” “aggressor,” or “finisher.” Next every player-season is tagged with the archetype/cluster they belong to, e.g., C0, C1, C2, or C3 by assigning the player-season to the nearest cluster centroid. For each team-season, the counts of players belonging to each archetype is computed. This count becomes the key explanatory feature (“team composition”). These role counts serve as the predictors in the supervised modeling stage.
To establish the relationship between team composition and performance, Ordinary Least Squares (OLS) regression modeling is used with team win percentage as the dependent variable. OLS provides interpretable coefficients that quantify directional effects of each archetype on team success. The model was implemented using the statsmodels package, a standard Python library for statistical estimation and inference24. The equation used is
ŷᵢ = β₀ + β₁(C0ᵢ) + β₂(C1ᵢ) + β₃(C2ᵢ) + β₄(C3ᵢ) (1)
In Equation (1), the dependent variable, ŷᵢ, is the seasonal win percentage for team i. It represents the proportion of matches won by that team across a given IPL season. C0ᵢ, C1ᵢ, C2ᵢ, and C3ᵢ are the number of players of each archetype in that team’s primary batting group, β₀ is the intercept, and β₁–β₄ show how win percentage changes when one additional player of that archetype is added, holding the others constant. In simple terms, the regression tests whether teams with more players of certain batting types tend to have higher or lower win percentages, and by how much.
The linear model offered interpretable coefficients, allowing directional insights into whether a greater presence of each archetype is associated with higher or lower win rates. Together, these steps form an interpretable end-to-end pipeline from raw ball-by-ball data to reduced-dimension player styles, to role-based team profiles, and finally to predictive modeling of team success.
Data sources, preparation, and limitations
The study utilized two datasets: ball-by-ball data from the Indian Premier League (IPL) and match-level information summarizing team outcomes. The ball-by-ball dataset contains 243,817 deliveries spanning the 2008 to 2023 seasons, with each entry containing the relevant contextual information for that delivery. The match-level dataset (see Table 1) states the overall outcomes of each game. Both datasets are from an open-source IPL data repository25, which was obtained through Kaggle. This dataset offered one of the most comprehensive publicly available records of IPL matches, combining granular ball-by-ball logs with aggregated outcomes. The detailed data allowed computing batting features precisely. However, this dataset does not include other important variables that may impact match outcomes like player injuries, weather conditions, or pitch conditions. Additionally, portion of the data is incomplete or inconsistent and needs to be cleaned before use. Even with these limitations, it is the best choice for this study because of the size, detail, and accessibility, hence giving a firm basis for the analysis.
Feature engineering and inclusion criteria
From the cleaned data, a comprehensive set of 19 batting features were selected to capture a variety of perspectives on batting performance, allowing the underlying value of different metrics to be assessed. These nineteen features are: season (IPL season. Year); striker (player name); runs (total runs in the seasom); balls (total balls faced in the season); dismissals (number of times dismissed); average (runs ÷ dismissals); strike_rate (runs ÷ balls) × 100); boundary_count (number of 4s and 6s hit); dot_ball_percentage (dot balls ÷ balls) × 100); runs_std (standard deviation of runs per match); powerplay_strike_rate (strike rate in overs 1–6); death_strike_rate (strike rate in overs 16–20); balls_per_boundary (average balls faced per boundary); death_overs_dot_ball_percentage (dot0ball percentage in overs 16-20); powerplay_runs_per_ball (run per ball in oevrs 1-6); death_runs_per_ball (runs per ball in overs 16-20), 40_perOuts (percentage of dismissals with ≥ 40 runs); SingleDigit_perOuts (percentage of dismissals with fewer than 10 runs); and team_name (team represented in that season).
The resulting feature set reflects both overall output and specific performance styles. These 19 features were calculated for each batsman in each season (see Table 2).
| Match.id | Season | City | Date | Team1 | Team2 | Toss_ winner | Toss_ decision | Result | DL_ applied | Winner | Win_ by_ runs | Win_ by_ wickets | player _of_ match | Venue | Umpire1 | Umpire2 | Umpire3 |
| 1370353 | 2023 | Ahmedabad | 2023/ 05/29 | Gujarat Titans | Chennai Super Kings | Chennai Super Kings | Field | D/L | 1 | Chennai Super Kings | 0 | 5 | DP Conway | Narendra Modi Stadium, Ahmedabad | Nitin Menon | RJ Tucker | KN Anantha-padmanaban |
| 1370352 | 2023 | Ahmedabad | 2023/ 05/26 | Gujarat Titans | Mumbai Indians | Mumbai Indians | Field | Normal | 0 | Gujarat Titans | 62 | 0 | Shubman Gill | Narendra Modi Stadium, Ahmedabad | Nitin Menon | RJ Tucker | J Madanagopal |
| 1370351 | 2023 | Chennai | 2023/ 05/24 | Mumbai Indians | Lucknow Super Giants | Mumbai Indians | Bat | Normal | 0 | Mumbai Indians | 81 | 0 | Akash Madhwal | MA Chidambaram Stadium, Chepauk,Chennai | BNJ Oxenford | VK Sharma | CB Gaffaney |
| 1370050 | 2023 | Chennai | 2023/ 05/23 | Chennai Super Kings | Gujarat Titans | Gujarat Titans | Field | Normal | 0 | Chennai Super Kings | 15 | 0 | RD Gaikwad | MA Chidambaram Stadium, Chepauk,Chennai | AK Chaudhary | CB Gaffaney | BNJ Oxenford |
| 1359543 | 2023 | Mumbai | 2023/ 05/21 | Sunrisers Hyderabad | Mumbai Indians | Mumbai Indians | Field | Normal | 0 | Mumbai Indians | 0 | 0 | C Green | Wankhede Stadium | KN Anantha-padmanaban | RJ Tucker | R Pandit |
These features cover scoring ability, strike rotation, boundary frequency, consistency, and efficiency in different phases of an innings, as well as conversion of starts into big scores.
To ensure stability in clustering, we included only batters who had faced at least 200 career balls in the dataset during the archetypes learning. This was so that outliers in the small sample who were underperforming or overperforming would not influence our ability to cluster and we could get the best results. Later, for the team composition analysis, we kept only players who had faced at least 50 balls in that season. That produced nine core batting contributors per team for each season.
Feature relevance to batting styles
A broad set of possible batting statistics was initially considered. However, many of these metrics are correlated, making it difficult to interpret them directly or understand which combinations of features truly define distinct batting styles. 19 batting-related metrics were initially considered, many of which were raw totals, such as total runs or number of 40+ scores, which naturally favor players who have played more matches. Since goal was to compare batting style rather than career length, volume-based totals and focused on per-ball or per-dismissal measures (e.g., strike rate, balls per boundary, phase-specific scoring rates) were excluded. Highly overlapping metrics were also removed to avoid redundancy. This process resulted in 8 representative features capturing scoring speed, consistency, boundary reliance, and performance across match phases.
Finally, eight features were retained that represent both what a batsman achieves (runs, strike rate, boundaries) and how they achieve it (consistency, phase-specific performance, conversion of starts). These were the features for which a process called Principal Component Analysis (PCA) was used to extract the underlying component of information in a more interpretable manner. The outcomes of the PCA process can be seen in Table 3 below, where PC1 is the x axis PC2 is the y axis and > 0 represents positive correlation and <0 represents negative correlation.
| Feature | PC1 | PC2 | Description |
| strike_rate | 0.378448 | -0.198449 | overall scoring tempo, separating fast scorers from accumulators |
| average | 0.426857 | -0.033502 | reliability and the ability to build longer innings |
| balls_per_boundary | -0.386348 | -0.159654 | how frequently a player finds the boundary, showing explosiveness |
| powerplay_runs_per_ball | 0.324830 | 0.359594 | effectiveness under fielding restrictions at the start of the innings |
| death_runs_per_ball | 0.273053 | -0.439738 | finishing ability in high-pressure final overs |
| dot_ball_percentage | -0.214031 | 0.682093 | control and strike rotation, distinguishing busy players from those who stall; |
| SingleDigit_perOuts | -0.356022 | -0.365085 | volatility by showing how often players get out cheaply |
| 40_perOuts | 0.415540 | 0.113099 | ability to convert starts into substantial scores, an indicator of reliability) |
To capture the underlying structure of these relationships in a more interpretable way, we use PCA to project the data into a two-dimensional style space that preserves the most informative variation in batting behaviour. The two principal components (PC1 and PC2) explain 50.6% and 16.3% of the total variance respectively (66.9% combined), indicating that the two-dimensional projection captures a substantial portion of variation in batting profiles while preserving interpretability for clustering.
Dimensionality Reduction and Player Profiling
Although all eight features add value in explaining player performance, their individual effects are difficult to interpret when the variables are highly interrelated. Thus, we applied Principal Component Analysis (PCA), a dimensionality-reduction method that consolidates correlated metrics into a smaller number of orthogonal components that capture the principal sources of variation among batsmen. This approach minimizes redundancy while preserving the dominant patterns in batting performance. Two principal components explain majority of the variance in batting performance and by projecting players onto these two principal components, it was easy to visualize the main performance dimensions and determine which key features most strongly differentiate batting styles.
In our analysis, the first two components summarized most of the variation and captured the three intuitive dimensions of batting. The first dimension reflects Tempo and boundary pressure which is linked to strike rate, powerplay scoring, balls per boundary). The second dimension captures Control and consistency driven by dot-ball percentage, SingleDigit_perOuts, and average). The third dimension represents Finishing strength linked to death overs scoring rates and 40_perOuts.The impact of these features was clearly visualized, and the emergence of distinct batting styles was observed when players were projected into this two-dimensional space.
Player Archetype Identification via K-means Clustering
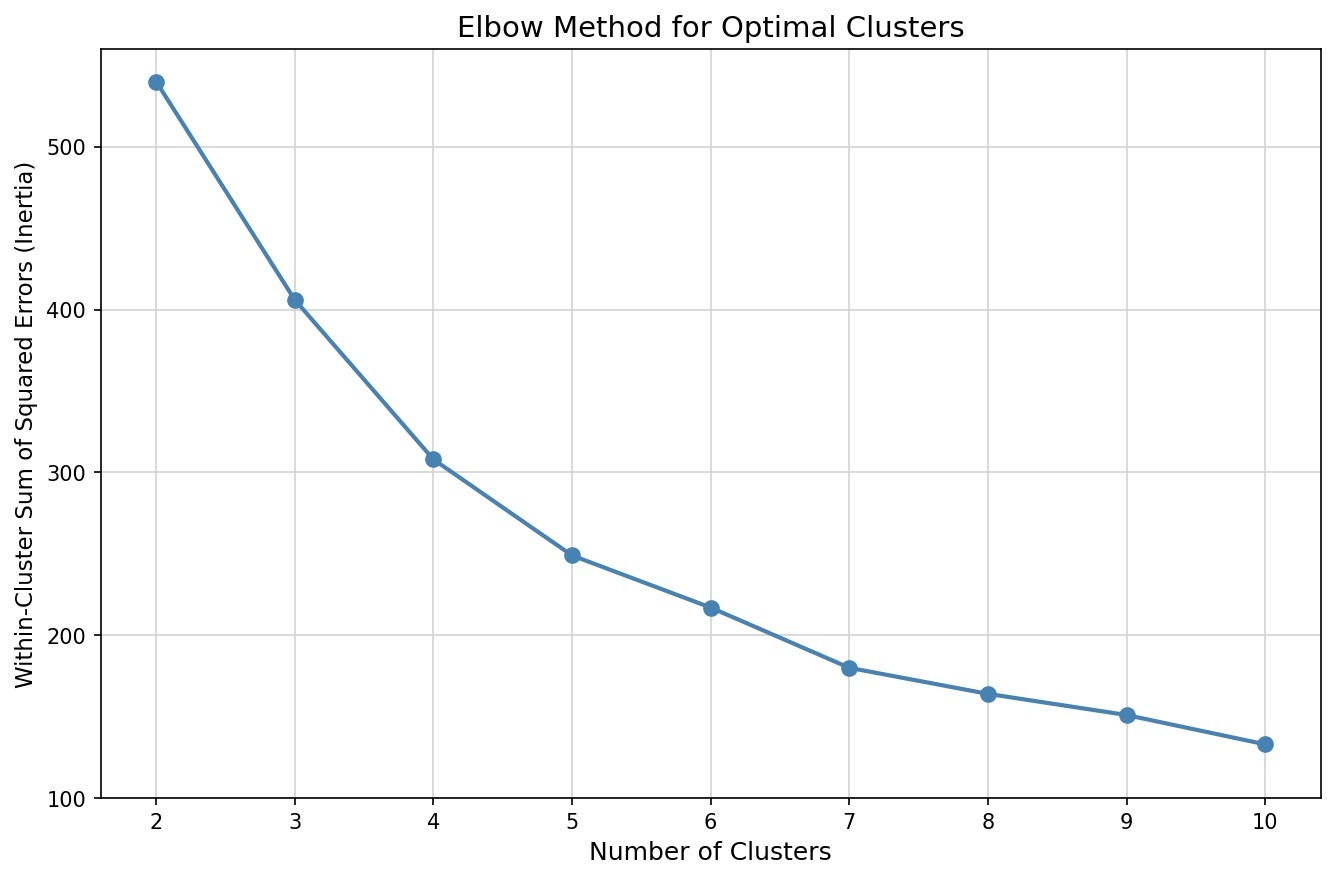
To cluster batsmen with similar profiles, k-means clustering was applied to the PCA-transformed data. The appropriate cluster number was evaluated by testing different values of k.
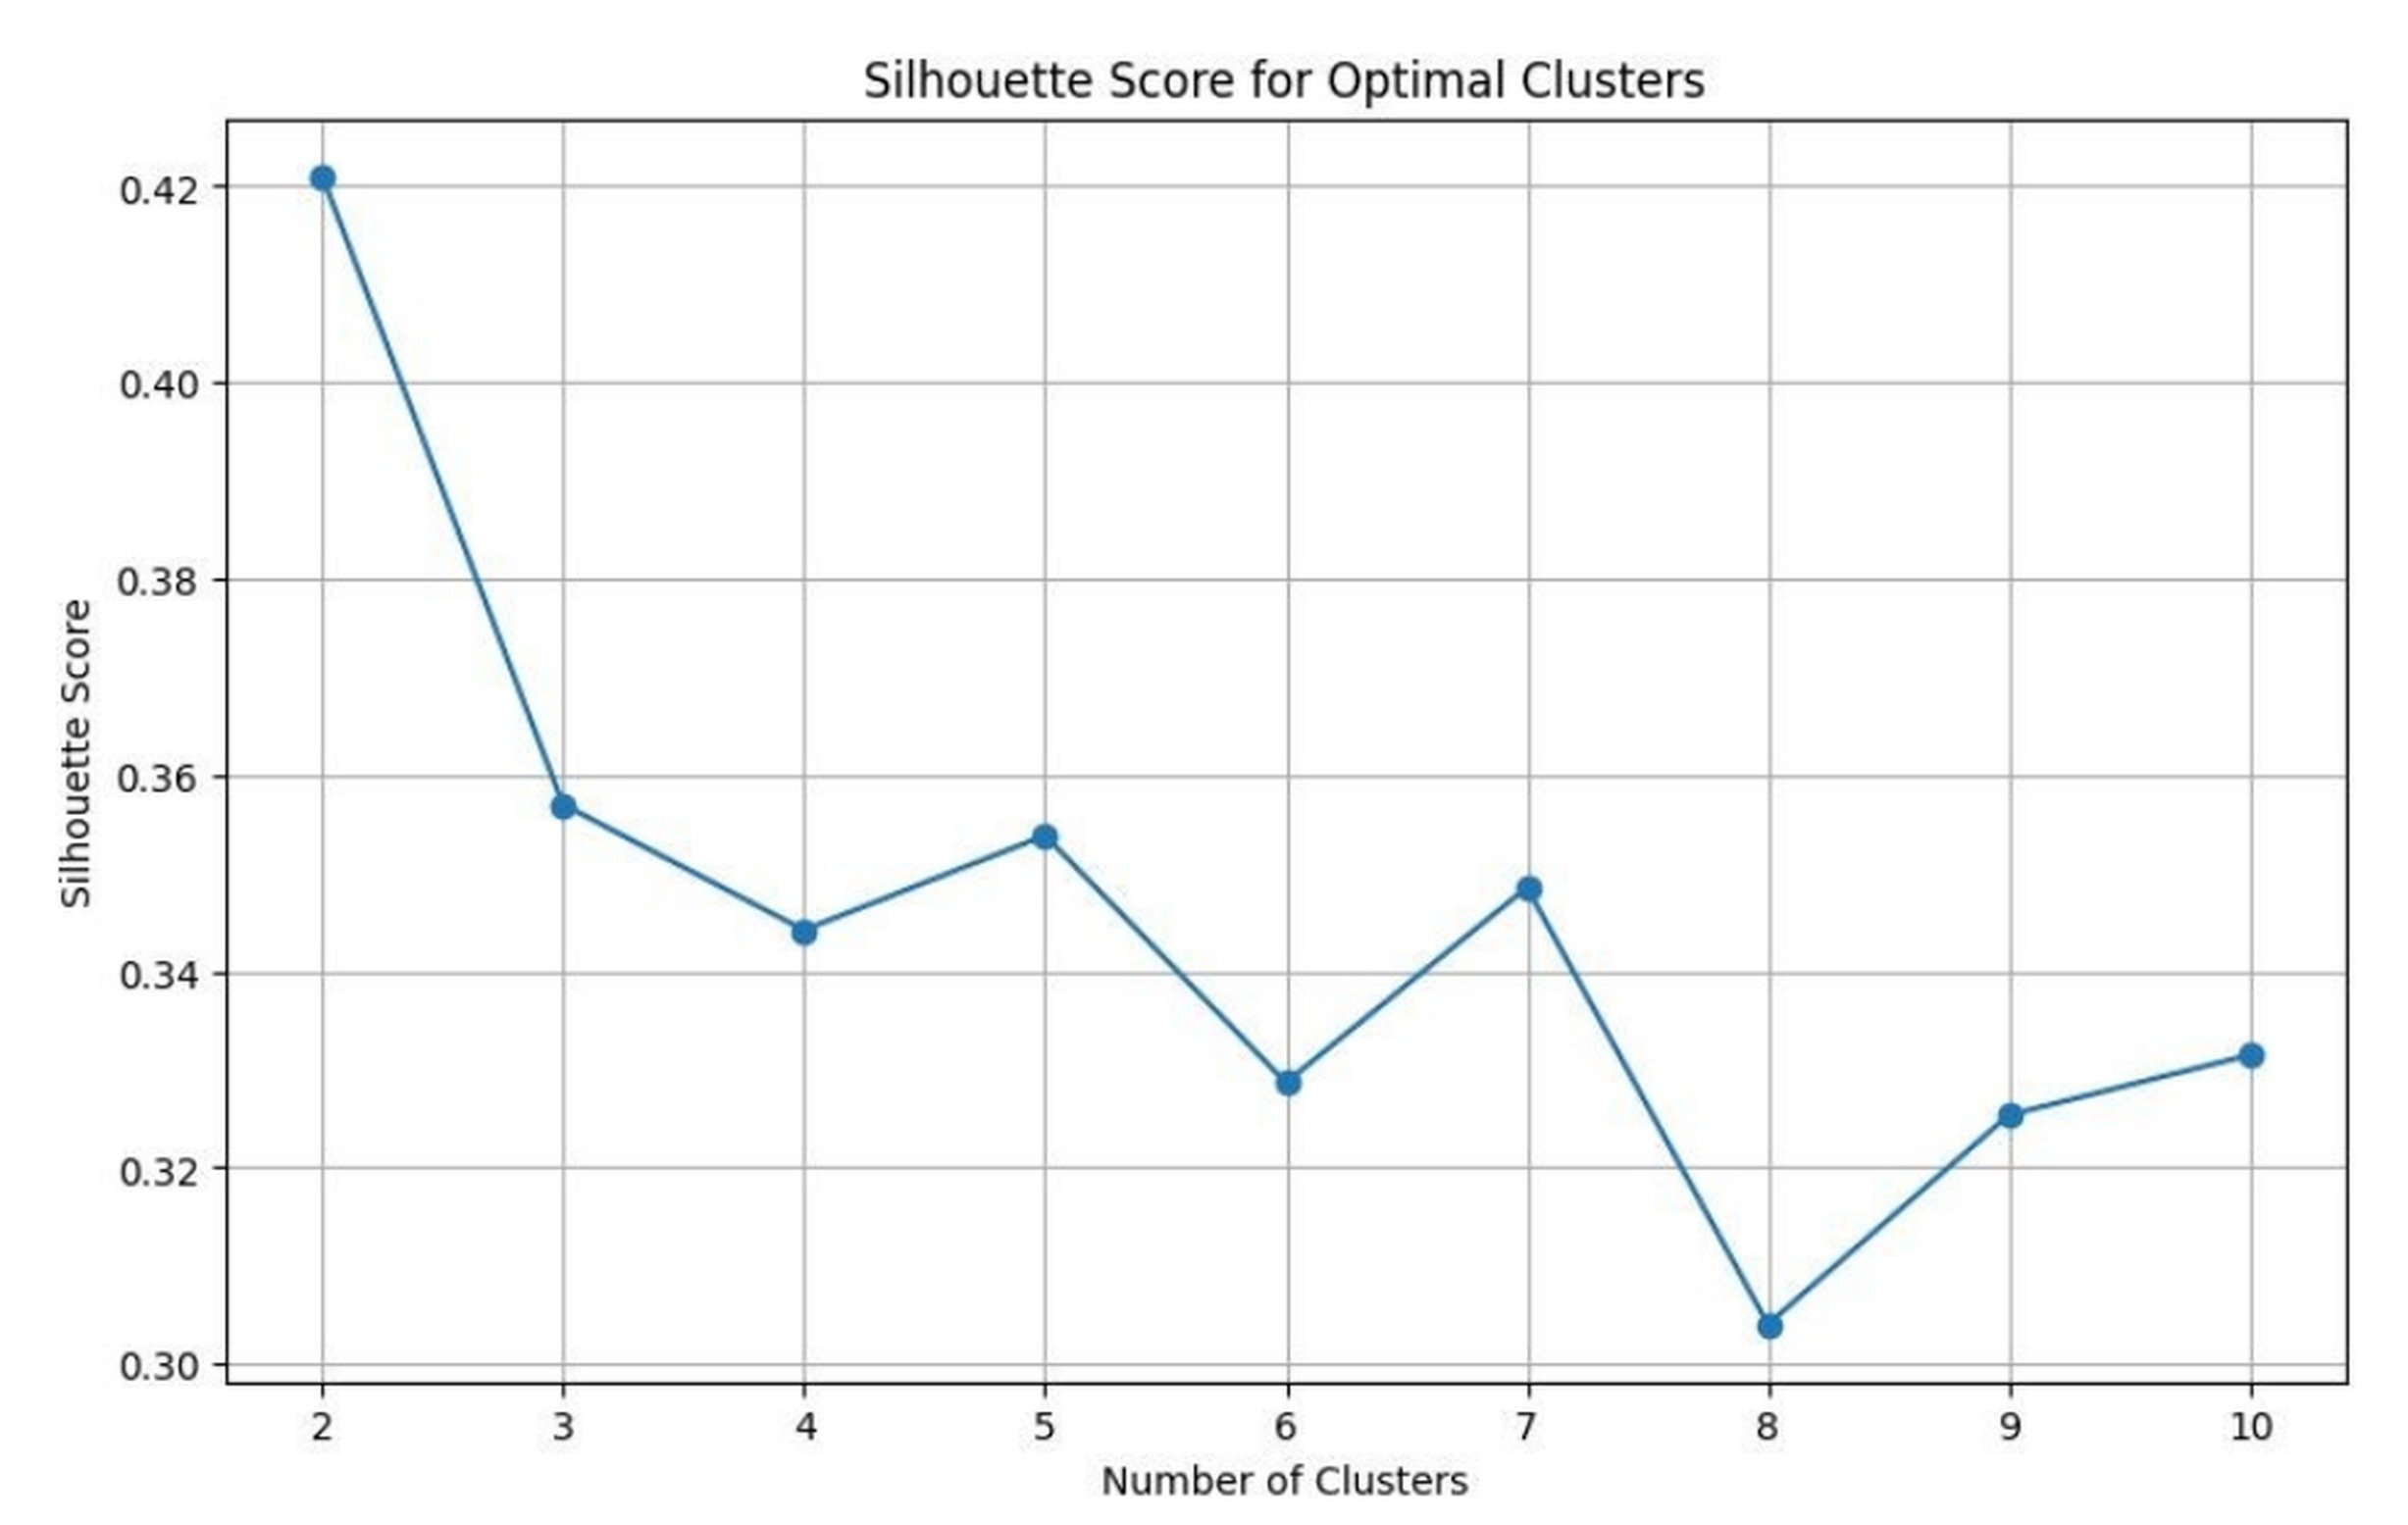
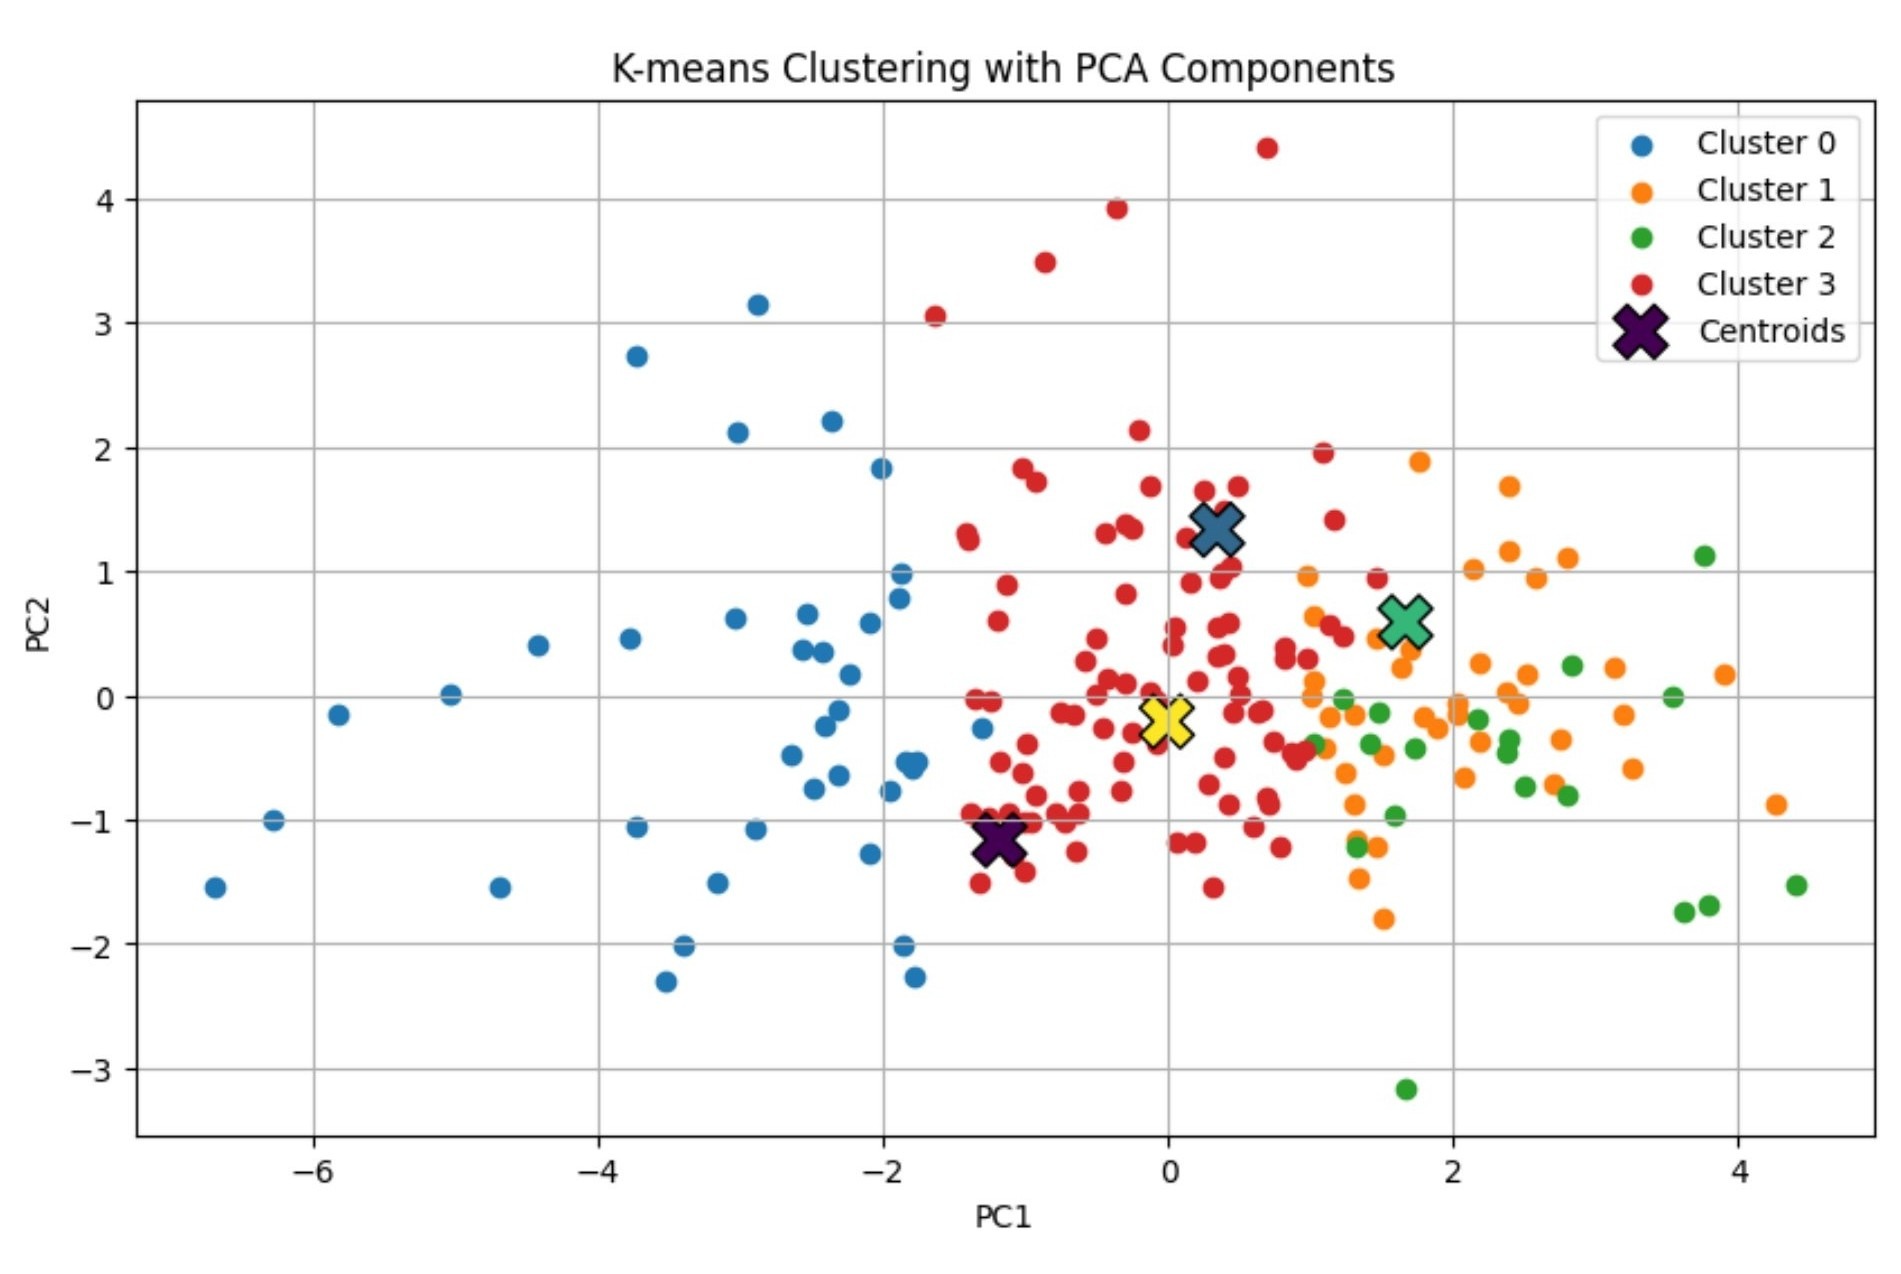
Figure 2 presents the elbow plot, which shows that inertia decreases steeply up to k=4 and flattens thereafter, indicating diminishing returns from additional clusters. Figure 3 confirms this using the silhouette score, which peaks at k=4, reflecting strong cluster cohesion and separation. Together, both diagnostics consistently identified k=4 as optimal. Figure 4 visualises the resulting four archetypes projected onto the two principal components, with cluster centroids marking the distinct style regions. Substantial differences were observed in average feature values across the four archetypes (see Table 4), with clear distinctions in scoring tempo, consistency, boundary frequency, and phase-specific performance respectively. Such trends indicate that there is a clear indication of play type for each cluster and further support the interpretable, practical relevance of the derived batting roles.
Furthermore, alternative values of k were tested to assess robustness. When k=3, distinct batting styles were grouped together, reducing interpretability. When k=5 or higher, additional clusters emerged but largely split existing groups without revealing meaningfully new archetypes. Overall, these alternatives provided less clear separation and interpretability compared to k=4, supporting choice of four clusters as the most practical and well-balanced solution.
To make sure that k-means clustering was stable and replicable, robustness was assessed by rerunning K-means (n_init = 100) across 20 random seeds. Cluster assignments were largely consistent (median ARI = 0.76; range 0.75–0.91), indicating stable archetypal structure with minor variation among boundary observations.
| Cluster | Runs | Balls | Dismissals | Average | Strike rate | Boundary count | Dot ball percentage | Runs std | Powerplay strike rate | Death strike rate | Balls per boundary | Death overs dot ball percentage | Powerplay runs per ball | Death runs per ball | 40 perOuts | SingleDigit perOuts |
| 0 | 358.54 | 331.82 | 22.36 | 16.81 | 107.77 | 40.18 | 42.83 | 1.46 | 64.32 | 127.46 | 8.5 | 37.24 | 0.64 | 1.27 | 0.06 | 0.66 |
| 1 | 2702.52 | 2095.95 | 74.42 | 37.84 | 129.86 | 351.12 | 37.86 | 1.64 | 116.67 | 171.2 | 6 | 28.22 | 1.17 | 1.71 | 0.38 | 0.26 |
| 2 | 1257.2 | 1257.2 | 57.85 | 31.58 | 148.96 | 258.15 | 36.33 | 1.83 | 135.47 | 185.62 | 4.87 | 31.58 | 1.35 | 1.86 | 0.28 | 0.36 |
| 3 | 1053.83 | 1053.83 | 50.81 | 24.85 | 124.75 | 168.29 | 41.11 | 1.64 | 104.58 | 150.24 | 6.34 | 31.37 | 1.05 | 1.51 | 0.17 | 0.41 |
Team-season aggregation and modeling
Once the archetypes were identified using career-level batting data, the next step was to evaluate how these roles influence team performance within each IPL season. Career-level statistics are useful for defining stable, long-term batting styles, but team success depends on who contributesin a given season and how many players of each style are present together in the same lineup.
Accordingly, for each IPL season, all player-season records were collected, and the scope was restricted to batters who faced at least 50 balls that season or were the core contributors that season, ensuring that only meaningful contributors rather than occasional or low-sample player were included in the team composition.
Each player’s season detail is projected to the same PCA space, assigned to the closest centroid, and the number of players from each cluster among the team’s primary contributors is counted. Based on the analysis, a distribution of [C0, C1, C2, C3] players for each team were developed across every season. Their archetype counts were then connected to the match-data dataset, consisting of each team’s wins, losses, and overall win percentage for the season.
Train/ Test Split
For model evaluation, we split the winning percentage dataset into 80% training and 20% testing using a fixed random seed. This ensured reproducible results and a fair assessment of predictive performance.
Regression Modeling
Based on these results, the win percentage was generated as a function of the archetype counts by means of Ordinary Leaser Squares (OLS) method. This modeling led to determining the direction and magnitude of the relationship for each archetype and determining the consistency of these patterns across different modeling approaches.
Interaction terms between archetypes were not included in order to preserve interpretability and avoid overfitting given the limited sample size of season-level observations; the primary goal was to understand the independent directional contribution of each batting role rather than model complex conditional dependencies between them
Results
Patterns Emerging from Player Clustering
A multi-faceted methodology and clustering of players identified patterns that statistics alone could not. Four key players archetypes emerged. Cluster 0 consists of low-impact players across most metrics. Cluster 1 comprises anchors (low volatility, high averages, strong control). Cluster 2 includes explosive accelerators (high strike rates, frequent boundaries, strong death overs finishing). Finally, Cluster 3comprises of average/support players with no major strengths or weaknesses (well rounded, average profiles).
Through incorporating various quantitative factors, the model distinguished players who showed similarity while analyzing simple batting statistics but showed different behaviors which are very relevant for winning match performance. Players with similar strike rates landed in different clusters due to differences in volatility (runs_std) and start conversion capability (40_perOuts). For example, some players with high averages but low boundary frequency were positioned in the stable cluster, as they contribute value in long anchoring innings, despite scoring primarily in singles and doubles. Also, certain players experienced very high death overs performance appeared in the explosive category due to their average general strike rates. Such differences were critical for the surfacing the archetypes of players and determination of team compositions, revealing that players’ performance is more nuanced than their simple batting averages and strike rates.
To illustrate the practical meaning of each archetype, one representative IPL player is highlighted for each archetype from the dataset, for the 2023 IPL Season. Cluster 3, which consists of support players, is reflected by Hardik Pandya, whose strike rate of 136.2 and strong death-over scoring illustrate late-innings acceleration. Cluster 2, representing high-impact explosive players, is exemplified by Shubman Gill, who recorded 890 runs in the 2023 season with a strike rate of 152.9 and an average of 59.3. Cluster 1 corresponds to stable top-order anchors such as Ruturaj Gaikwad, who combines consistency (average 45.4) with a solid strike rate of 143.6. Finally, Cluster 0 represents lower-impact or situational contributors, illustrated by MS Dhoni, whose limited balls faced in 2023 reflects a specialized finishing role.
Optimal Team Role Compositions
The modeling phase sought to determine the team compositions most strongly associated with success in terms of win percentage. Following the training of the regression model, every possible combination of role counts was evaluated to estimate predicted outcomes. The ten combinations yielding the highest predicted win percentages were then analyzed and the average number of players from each archetype across these top-performing lineups was computed (see Table 5). The most successful teams consistently included higher proportions of Cluster 1 (stable, slower-tempo) and Cluster 2 (explosive, high-tempo) players (see Table 6 for average composition across Top 10 predicted Team role compositions).
This pattern suggests that the core of winnings teams comprises balance between stability and aggression. Stability provided by Cluster 1 players mitigates the risk of batting collapses, while the scoring acceleration offered by Cluster 2 players maintain offensive pressure on opponents. Together, these complementary batting style provide a resilient and adaptive batting team composition.
A granular examination of the top ten predicted combinations (see Table 5) revealed that, most successful team structures shared similar proportions of stable and explosive players, with moderate variability across high-performing lineups. Most top predicted combinations consisted multiple Cluster 1 and Cluster 2 players, with some combinations deviating slightly from this pattern. For example, one high-performing team composition consisted of zero cluster 0, one cluster 1, three cluster 2, and five cluster 3 players, whereas another comprised one cluster 1, one cluster 2, and six cluster 3 players. Although there was a slight disparity, particularly regarding the absolute number, of these archetypal combinations for the top predicted combinations, the overall distribution was consistent, as a trusted set of anchors combined with several aggressive players had a highly competitive anticipated result on average.
These deviations demonstrate that flexibility in roster design is feasible, provided that the general balance between stability and explosiveness is preserved and that below-baseline performers remain limited. The presence of Cluster 3 (balanced) players in successful combinations underscores the importance of adaptable contributors who can complement both aggressive and conservative batting strategies.
| Top 10 Team Compositions by Predicted Win Percentage | |||||
| Predicted Win % : 67.07 | Predicted Win % : 65.63 | ||||
| Cluster 0 | Low impact | 0 | Cluster 0 | Low impact | 1 |
| Cluster 1 | Anchors | 4 | Cluster 1 | Anchors | 4 |
| Cluster 2 | Explosive accelerators | 3 | Cluster 2 | Explosive acceleartors | 3 |
| Cluster 3 | Average/support | 2 | Cluster 3 | Average/support | 1 |
| Predicted Win % : 66.66 | Predicted Win % 65.25 | ||||
| Cluster 0 | Low impact | 1 | Cluster 0 | Low impact | 1 |
| Cluster 1 | Anchors | 0 | Cluster 1 | Anchors | 1 |
| Cluster 2 | Explosive accelerators | 3 | Cluster 2 | Eplosive accelerators | 1 |
| Cluster 3 | Average/support | 5 | Cluster 3 | Average/support | 6 |
| Predicted Win % : 66.35 | Predicted Win % 65.16 | ||||
| Cluster 0 | Low impact | 0 | Cluster 0 | Low impact | 0 |
| Cluster 1 | Anchors | 6 | Cluster 1 | Anchors | 5 |
| Cluster 2 | Explosive accelerators | 3 | Cluster 2 | Explosive accelerators | 4 |
| Cluster 3 | Average/support | 0 | Cluster 3 | Average/support | 0 |
| Predicted Win % : 66.35 | Predicted Win % 65.16 | ||||
| Cluster 0 | Low impact | 0 | Cluster 0 | Low impact | 0 |
| Cluster 1 | Anchors | 5 | Cluster 1 | Anchors | 4 |
| Cluster 2 | Explosive accelerators | 3 | Cluster 2 | Explosive accelerators | 3 |
| Cluster 3 | Average/support | 1 | Cluster 3 | Average/support | 2 |
| Predicted Win % : 65.63 | Predicted Win % 65.16 | ||||
| Cluster 0 | Low impact | 1 | Cluster 0 | Low impact | 0 |
| Cluster 1 | Anchors | 5 | Cluster 1 | Anchors | 4 |
| Cluster 2 | Explosive accelerators | 3 | Cluster 2 | Explosive accelerators | 3 |
| Cluster 3 | Average/support | 1 | Cluster 3 | Average/support | 2 |
All top team compositions feature multiple Cluster 1 (anchors) and Cluster 2 (explosive accelerator) players, and minimum Cluster 0 (low-impact) representation
| Average Composition Across Top 10 Teams | |
| Cluster 0 players | 0.4 |
| Cluster 1 players | 3.8 |
| Cluster 2 players | 3.2 |
| Cluster 3 players | 1.6 |
On average across the top ten predicted lineups, teams carry 3.8 stable anchors (Cluster 1) and 3.2 explosive accelerators (Cluster 2) players, confirming that this balance not any single archetype alone is the consistent hallmark of predicted success
Quantifying Archetype Influence on Team Performance
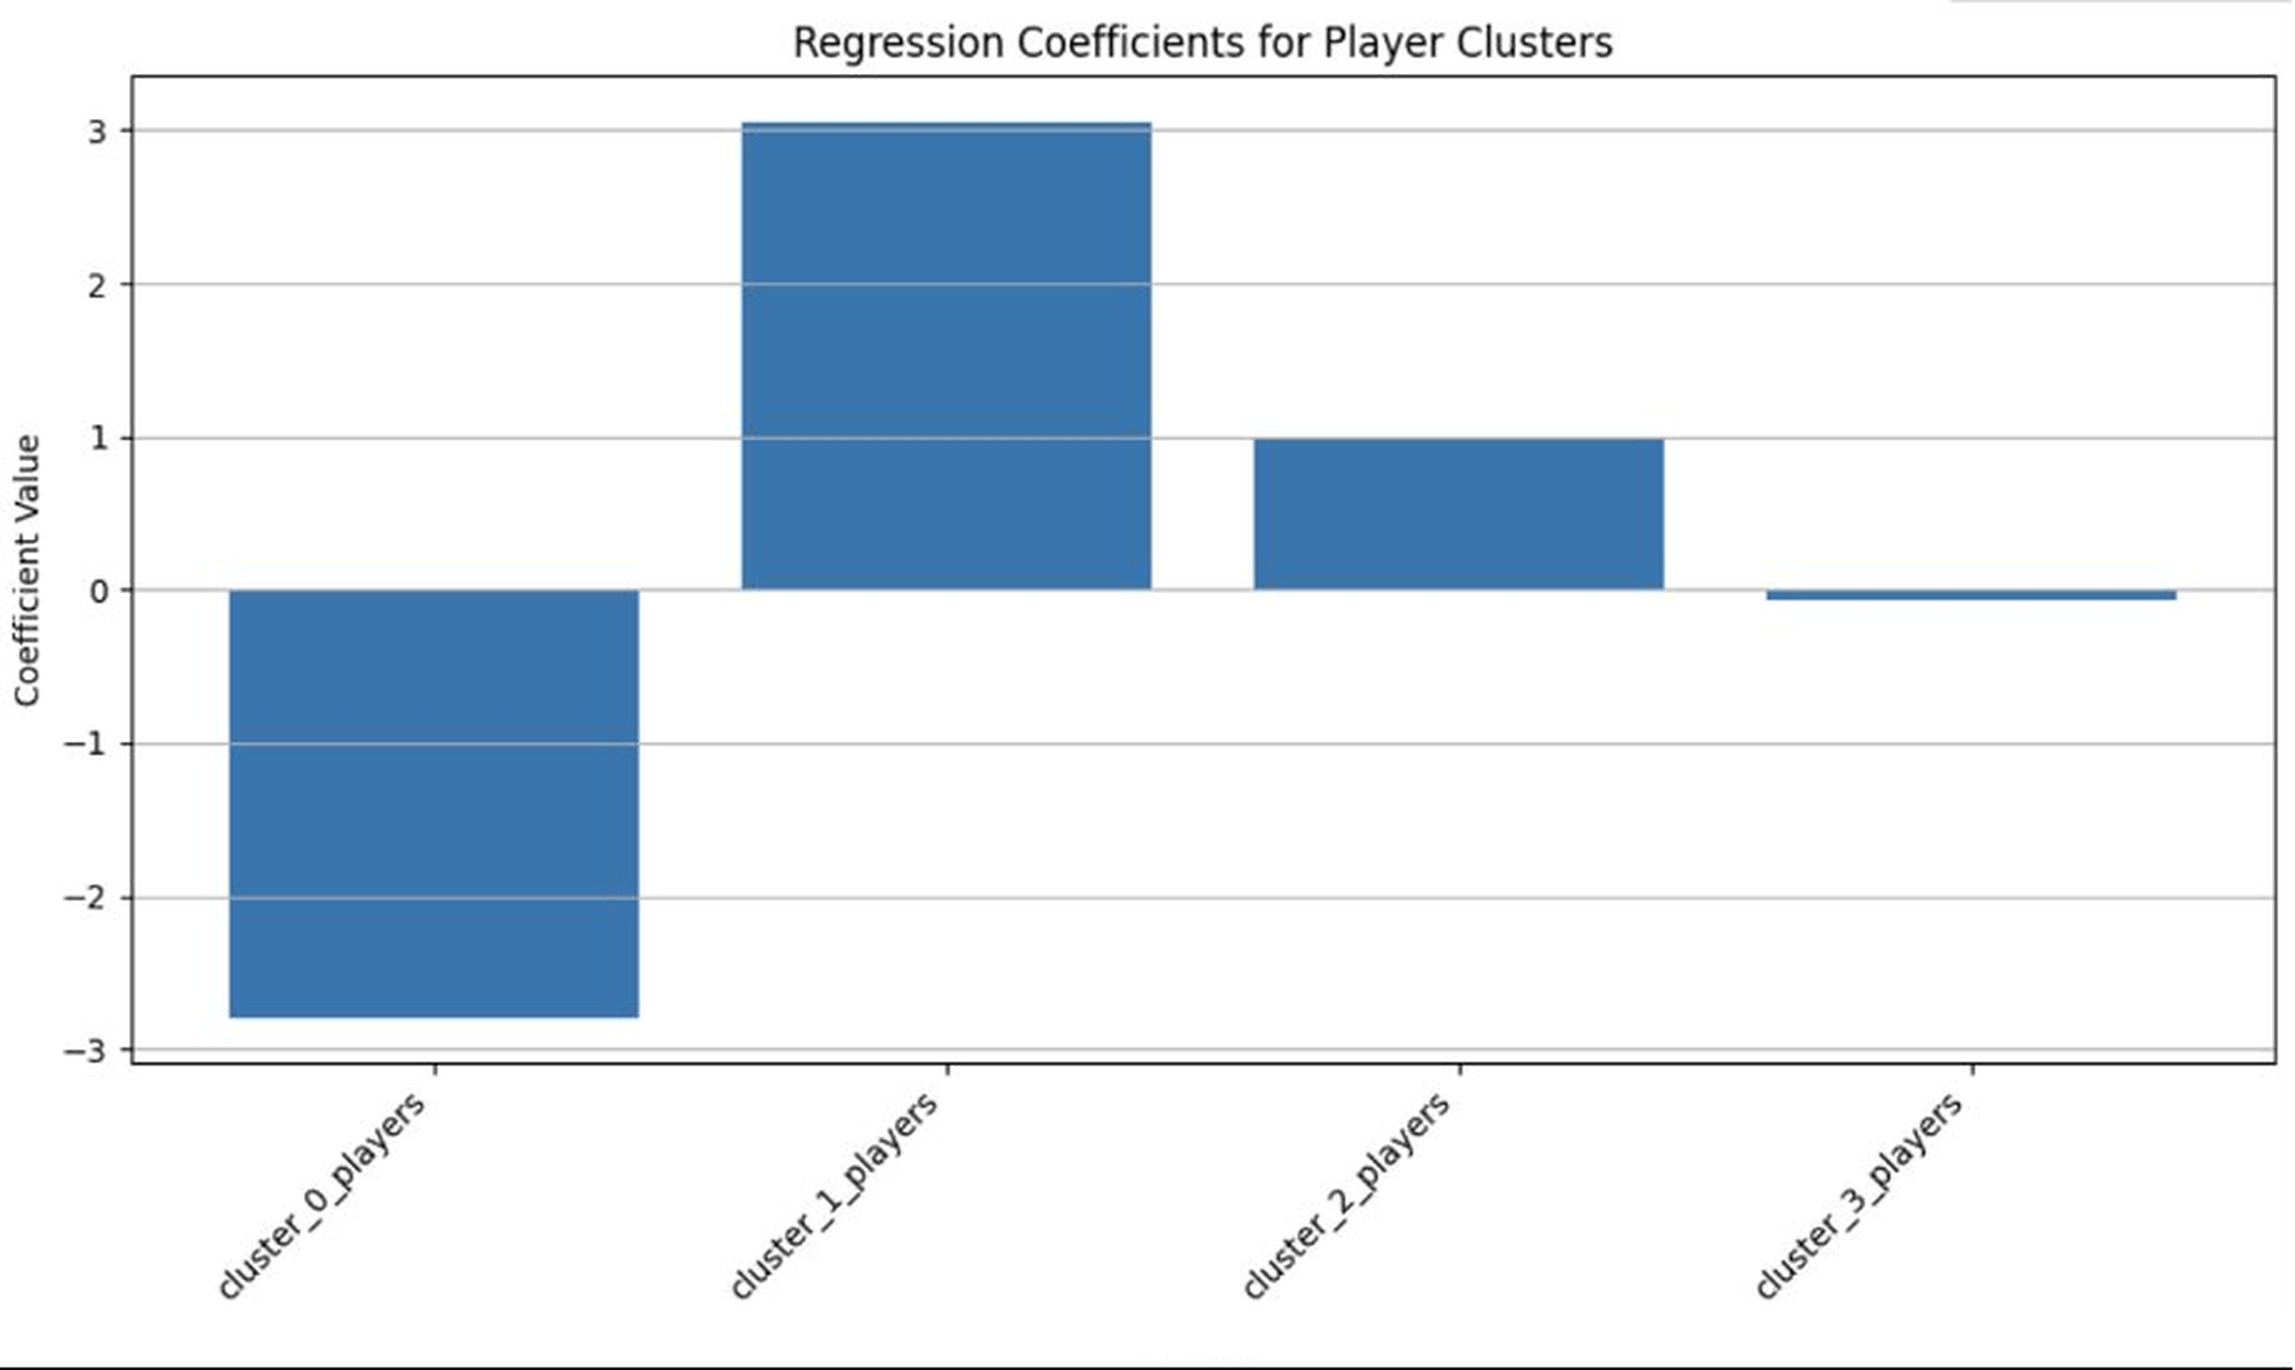
We used Ordinary Leaser Squares (OLS) regression model to analyze how each archetype contributed to win percentage. Ordinary least squares (OLS) showed a negative association for Cluster-0 counts, suggesting that having more below-baseline players in the main batting group was linked to lower win percentages.
Cluster-1 and Cluster-2 player counts were associated with positive effects, with Cluster-1 exhibiting the largest positive impact (see Figure 5). Cluster-3 showed only small, slightly negative coefficient, indicating that steady or well-rounded players contributed modestly but were less influential than those in the first two clusters.
The large negative coefficient on cluster-0 players indicates that it is equally important to not include low scoring, low impact players, as it is to include stable anchors. Even in well-structured lineup groups, teams that had fewer below-baseline contributors had strong results and suggested that it is important to limit the introduction of low-impact roles in the main batting group.
To account for team-specific baselines and season/era effects, we re-estimated the model with team and season fixed effects and team-clustered standard errors, using Cluster 0 as the omitted reference category. Under this specification, each additional Cluster 1 player (replacing a Cluster 0 player) is associated with a ~4.4 percentage point increase in win percentage (β = 4.42, p < 0.001), while Clusters 2 and 3 show no statistically significant association.
Through both the original OLS model and the new adjusted OLS model, the results directly support the earlier findings from the top predicted combinations: teams benefited most from having several stable players (Cluster 1) and several explosive players (Cluster 2) among their primary contributors.
Stable players helped prevent collapses and kept scoring steady, while explosive players added pressure and acceleration. Together, this composition consistently appeared in the top-performing lineups.
The regression model achieved an in-sample R² of 0.143, meaning that batting-role composition explains roughly 14% of the variation in win percentage across IPL seasons. To test the overall statistical significance of model, F-statistic and p value were computed. F-statistic of 4.044, p = 0.00447 indicated that the model is statistically significant and atleast one predictor demonstrates real predictive value.
The modest explanatory power is expected, because the match win percentage is impacted by many variables which are not included in the analyses like bowling quality, fielding, pitch and weather conditions, toss effects, and opposition strength. This analysis is not a tool for predicting match outcomes. It demonstrates significant relationship between lineup composition in terms of batting archetypes and performance outcomes and thus provides an added lens to decision makers when selecting players for team.
| OLS Regression Results | |||||||||
| Dep. Variable: | Win_percentage | R-squared | 0.143 | ||||||
| Model: | OLS | Adj. R-squared | 0.108 | ||||||
| Method: | Least Squares | F-statistic | 4.044 | ||||||
| Date/ Time: | Wed, 23 Jul 2025, 13:39:40 | Prob (F-statistic) | 0.00447 | ||||||
| No. Observations | 102 | Log-Likelihood | -401.36 | ||||||
| Df Residuals: | 97 | AIC: | 812.7 | ||||||
| DF Model: | 4 | BIC: | 825.8 | ||||||
| coef | Std err | t | P>|t| | [0.025] | [0.975] | ||||
| Const | 51.8349 | 6.014 | 8.620 | 0.000 | 39.900 | 63.770 | |||
| Cluster 0 players | -2.7990 | 0.916 | -3.055 | 0.003 | -4.618 | -0.980 | |||
| Cluster 1 players | 3.0598 | 1.380 | 2.217 | 0.029 | 0.321 | 5.799 | |||
| Cluster 2 players | 0.9926 | 1.199 | 0.828 | 0.410 | -1.386 | 3.722 | |||
| Cluster 3 players | -0.0721 | 0.847 | -0.085 | 0.932 | -1.752 | 1.608 | |||
| Omnibus: | 4.713 | Durbin-Watson | 1.336 | ||||||
| Prob(Omnibus) | 0.095 | Jarque-Bera (JB): | 4.343 | ||||||
| Skew: | -0.503 | Prob(JB): | 0.114 | ||||||
| Kurtosis: | 3.099 | Cond. No. | 26.2 | ||||||
Discussion
The results of this study show four distinct batting archetypes, and winning teams usually combined Cluster 1 players, who provide stability with Cluster 2 players, who can accelerate the pace of scoring. Across both the clustering patterns and the top predicted team lineups, successful teams tended to balance these two roles while keeping the number of below-baseline players (Cluster 0) as low as possible.
Earlier research on cricket prediction has achieved much higher accuracy than this study. For example, almost 90%9 accuracy for predicting individual runs or wickets, and over 70%14 accuracy for match outcomes when many match-level factors are included. Compared with these models, the predictive performance here was modest. The OLS regression explained only about 14% of the variation in win percentage, and the random forest model performed similarly poorly.
While predictive power R² of 0.143 may appear modest, it is expected and reflects a meaningful signal given that this study only looked at batting composition. Match outcomes in cricket depend on many factors, such as bowling strength, fielding quality, pitch and weather conditions, opponent strength and toss outcomes, of which batting role composition is only one. This study was primarily designed as a exploratory analuses to identify interpretable batting archetypes and examine their association with team success rather than build an accurate forecasting model.
There are also several limitations in the data used. First, the analysis includes only batting features and leaves out bowling and fielding metrics that strongly influence results. Second, important contextual factors such as venue, toss result, pitch behaviour, and opposition quality were not included, even though they interact with batting performance in complex ways. Third, the batting features do not fully reflect when players actually bat within an innings, and restricting the sample to players with at least 50 balls per season removes some players who may still impact results. Finally, the modelling approach is mostly linear, even though team success probably depends on more interactions between player roles which are often non-linear.
Even with these limitations, the results still provide useful insights for team selection. The regression model shows that teams with more stable (Cluster 1) and explosive (Cluster 2) batters tend to perform better, while having more Cluster 0 players usually results in lower performance. This gives coaches and teams an informative guide to create a line-up which is balanced mix of consistent and aggressive players depending on venues and match situations.
They can also refine the batting order by sequencing dependable and high-intent players in a way that reduces the likelihood of an early collapse while still sustaining pressure on the opposition throughout the innings.
Looking forward, future extensions could incorporate bowling and fielding metrics and also develop bowler archetypes in addition to batting archetypes. The model could also include additional contextual factors and apply more advanced techniques capable of capturing interactions among these variables. Together, these enhancements would increase the model’s accuracy and practical value for team decision-makers.
References
- R. Mackenzie, C. Cushion. Performance analysis in football: a critical review and implications for future research. Journal of Sports Sciences Vol. 31 pg. 639–676, Preprint at 2013 https://doi.org/10.1080/02640414.2012.746720 [↩]
- IPL data analysis – evaluating players. https://www.kaggle.com/code/jamiewelsh2/ipl-data-analysis-evaluating-players/notebook [↩]
- Swetha, S. Kn. Analysis on attributes deciding cricket winning. International Research Journal of Engineering and Technology. 2008 [↩]
- R. P. Bunker, F. Thabtah. A machine learning framework for sport result prediction. Applied Computing and Informatics. Vol. 15, pg. 27–33, 2019 https://doi.org/10.1016/j.aci.2017.09.005 [↩]
- Vidisha, V. Bhatia. A review of machine learning based recommendation approaches for cricket. in 2020 Sixth International Conference on Parallel, Distributed and Grid Computing (PDGC) pg. 421–427, IEEE, 2020 https://doi.org/10.1109/PDGC50313.2020.9315320 [↩]
- M. M. Hatharasinghe, G. Poravi. Data mining and machine learning in cricket match outcome prediction: missing links. in 2019 IEEE 5th International Conference for Convergence in Technology (I2CT) pg. 1–4, IEEE, 2019 https://doi.org/10.1109/I2CT45611.2019.9033698 [↩]
- J. Gudmundsson, M. Horton. Spatio-temporal analysis of team sports. ACM Computing Surveys. Vol. 50, 2018 https://doi.org/10.1145/3054132 [↩]
- T. Decroos, J. Van Haaren, L. Bransen, J. Davis. Actions speak louder than goals: valuing player actions in soccer. in Proceedings of the ACM SIGKDD International Conference on Knowledge Discovery and Data Mining pg. 1851–1861, Association for Computing Machinery, 2019 https://doi.org/10.1145/3292500.3330758 [↩]
- K. Passi, N. Pandey. Predicting players’ performance in one day international cricket matches using machine learning. in pg. 111–126, Academy and Industry Research Collaboration Center (AIRCC), 2018 https://doi.org/10.5121/csit.2018.80310 [↩] [↩]
- F. Bharadwaj, A. Saxena, R. Kumar, R. Kumar, S. Kumar, Ž. Stević. Player performance predictive analysis in cricket using machine learning. Revue d’Intelligence Artificielle. Vol. 38, pg. 449–457, 2024 https://doi.org/10.18280/ria.380208 [↩]
- M. Pavan Teja, K. Gopal, J. Kumar, D. Swapna, P. Vinay Kumar, A. Professor. Predicting accuracy of players in cricket using machine learning. International Journal of Scientific Research and Engineering Development. Vol. 8, [↩]
- N. M. Patil, B. H. Sequeira, N. N. Gonsalves, A. A. Singh, F. C. Rodrigues. CRICKET TEAM PREDICTION USING MACHINE LEARNING TECHNIQUES. https://ssrn.com/abstract=3572740 [↩]
- E. Mundhe, I. Jain, S. Shah. Live cricket score prediction web application using machine learning. in 2021 International Conference on Smart Generation Computing, Communication and Networking (SMART GENCON) pg. 1–6, IEEE, 2021 https://doi.org/10.1109/SMARTGENCON51891.2021.9645855 [↩]
- R. Lamsal, A. Choudhary. Predicting outcome of indian premier league (ipl) matches using machine learning. 2020 [↩] [↩]
- D. Karan Singh, S. Agarwal, S. Gupta, M. Singh, U. Saxena. PREDICTION of match winners of ipl using machine learning algorithms. MIT International Journal of Computer Science and Information Technology. Vol. 7, 2018 [↩]
- R. Singh, H. Saikia, D. Bhattacharjee. Application of Markowitz Model for Analyzing the Performance of Cricket Teams in Indian Premier League. www.metamorphosisjournal.com [↩]
- S. Viswanadha, K. Sivalenka, M. Gopal Jhawar, V. Pudi. Dynamic Winner Prediction in Twenty20 Cricket: Based on Relative Team Strengths. [↩]
- A. Sinha. Application of machine learning in cricket and predictive analytics of ipl 2020. Preprint at https://www.preprints.org/manuscript/202010.0436/v1 2020 https://doi.org/10.20944/preprints202010.0436.v1 [↩]
- C. Kapadiya, A. Shah, K. Adhvaryu, P. Barot. Intelligent cricket team selection by predicting individual players’ performance using efficient machine learning technique. International Journal of Engineering and Advanced Technology. Vol. 9, pg. 3406–3409, 2020 https://doi.org/10.35940/ijeat.C6339.029320 [↩]
- I. T. Jollife, J. Cadima. Principal component analysis: a review and recent developments. Philosophical Transactions of the Royal Society A: Mathematical, Physical and Engineering Sciences Vol. 374 Preprint at 2016 https://doi.org/10.1098/rsta.2015.0202 [↩]
- PCA — scikit-learn 1.7.2 documentation. https://scikit-learn.org/stable/modules/generated/sklearn.decomposition.PCA.html [↩]
- Linear regression – statsmodels 0.14.6. https://www.statsmodels.org/stable/regression.html [↩]
- J. Macqueen. SOME METHODS FOR CLASSIFICATION AND ANALYSIS OF MULTIVARIATE OBSERVATIONS. [↩]
- G. James, D. Witten, T. Hastie, R. Tibshirani, J. Taylor. An introduction to statistical learning. 2023 https://doi.org/10.1007/978-3-031-38747-0 [↩]
- IPL men’s cricket matches data (2008-2023). https://www.kaggle.com/datasets/utkarshtomar736/ipl-mens-cricket-matches-data-2008-2023 [↩]


 and Family-Integrated Care (FIC): Global Trends and Local Provider Awareness in Fresno County, California")