
Abstract
The intersection of thermodynamics and computer systems is increasingly becoming more important as AI workloads demand efficient cooling solutions. The CPUs and GPUs of consumer computer systems are now becoming similarly high powered as that of data centers to run various heavy workloads including more recently running LLMs locally. These evolving use cases bring data center level cooling challenges to home computers. This paper presents an experimental analysis comparing the performance of different workloads, across multiple CPUs, different types of coolers on a home PC. The paper addresses the research gap of lack of quantitative research on the impact of coolers on the performance of various workloads on home PCs running high-TDP consumer architectures (Zen 4 and Zen 5). The paper reviews the relevant laws of thermodynamics. The key findings indicate that while cooling choice has a negligible impact on lower-tier CPUs (Ryzen 5 7500F), it is critical for high-density architectures (Ryzen 7 9700X). In synthetic stress tests, liquid cooling provided performance gains exceeding 30%, while real-world AI inference workloads saw improvements of over 7%. These gains are attributed to a measured thermal headroom increase of up to 43.5°C, enabling sustained higher clock speeds. Statistical analysis via one-way ANOVA confirmed these findings were significant (p < 0.05) for high-intensity workloads, highlighting the direct impact of thermal physics on modern computing efficiency. As AI workloads continue to grow, understanding and optimizing these cooling mechanisms will be essential for the sustainable and efficient computer systems of the future.
Introduction
Life in the modern world would be unimaginable without computer systems; it is used in everything humans do; from their day-to-day work to education, and even for entertainment. The demand for high-powered computer systems has skyrocketed across various industries like healthcare, manufacturing, finance, scientific research, engineering, and many more in the last few years. The COVID-19 pandemic heightened the demand for computer systems, and many research papers point out that this demand was not temporary1, but it made every industry realize the importance of computer systems in driving significant economic benefit2.
The rise in the demand of AI has led to the rise in demand for highly sophisticated computer hardware. These hardware components include CPUs and AI accelerator hardware like GPUs (core components of a computer system). They are estimated to use roughly 60% of electricity demand in modern data centers. Usage of high-power CPUs and GPUs generate a lot of heat due to their high-power draw therefore lots of energy needs to be spent to cool them. Insufficient cooling can lead to the deterioration of these components or not allow the components to maximise performance (thermal throttling), therefore making servers inefficient with respect to their performance. Cooling requires a lot of energy therefore inefficient cooling will be costly not just financially but also environmentally.
The CPUs and GPUs of consumer computer systems are now becoming similarly high powered to run various workloads like 3D rendering, video editing, gaming and recently running LLMs locally. These consumer computer systems come with specialized AI hardware like NPUs (Neural Processing Unit) which is used to run AI models efficiently and for neural networking. High TDP consumer GPUs like the RTX 5090 and RTX pro 6000 and high TDP consumer CPUs like the AMD Threadripper mimic the power and thermal density previously only seen in data centers. Thus, this brings data center level cooling challenges to home computers as well. Various cooling methods are used to ensure that the cooling of CPUs and GPUs is as efficient as possible. Some of the broad methods of cooling across data centers and home computers include air cooling and liquid cooling, the primary focus of the paper and the experiments. Other methods such as direct to chip cooling, immersion cooling, evaporative cooling and hardware like CRAC (computer room air conditioning) units3 are also some types of cooling used in data centers but are not the topic of this paper.
Today there is plenty of data regarding cooling of massive servers but this data is often proprietary or tailored to enterprise-scale infrastructure, leaving a gap in the quantified comparative analysis for high-performance consumer-grade systems. As the computational and energy requirement rises to run AI workloads4 and other such processes both in data centers and on PCs it is important to analyze the cooling solutions for them. Analysing this quantified data will help understand which cooling solution should be used in each scenario and develop cooling strategies. Optimal cooling strategy is important because it helps extract the most performance out of computer systems while remaining cost efficient. This paper focuses primarily on the cooling solutions of standard consumer grade computer systems
The basic Physics behind air and liquid cooling is already known; however it is important to visit this topic while addressing the research gap. This forms the basis of the experiment in this paper and helps quantify the data to provide data driven better understanding of this field. This paper discusses key concepts of thermodynamics and helps understand air and liquid cooling. This includes water’s high specific heat capacity which makes it an excellent coolant5. This paper reviews the effects of different types of cooling on the performance of computer systems through experimentation, by providing controlled experimental data on consumer hardware and via literature review.
This paper presents an experimental analysis comparing the performance of different workloads, across multiple CPUs, different types of air and liquid coolers on a home PC. The paper addresses the research gap of lack of quantitative research on the impact of coolers on the performance of various workloads on home PCs. This research was done on both synthetic workloads, like Prime95 and on real world workloads of running AI inference workloads on a PC.
There are several research gaps currently present in this field that this paper aims to answer. Firstly, there is limited data of standardized, power-normalized comparative data for modern high-density consumer architectures like Zen 5 and Zen 4. This paper addresses this gap by quantifying the thermal headroom and resulting performance gains of liquid versus air cooling on a home PC.
Thermodynamics behind cooling systems
This section discusses and explains the concepts of thermodynamics behind air and liquid cooling. These include the laws of thermodynamics, thermal capacity, enthalpy of vaporisation, convection and conduction and specific heat capacity.
Laws of thermodynamics
The first and most fundamental concept is the first law of thermodynamics also known as the law of conservation of energy. This law states that energy can neither be created nor destroyed6 In cooling systems, this law governs how thermal energy is moved from a hot object or area to a cooler one, either through the movement of air or a liquid. The study of energy conservation in closed systems is rooted in this first law of thermodynamics. Therefore in a closed loop liquid cooler the heat absorbed Qin by the coolant is equal to the heat dissipated by the radiator Qout minus any work done by the pump7.
(1) 
The second law of thermodynamics dictates the direction of and the efficiency of heat transfer8. This is fundamental to understanding the designing of cooling systems. For example, heat always flows from hotter to colder objects. This law states that the state of entropy of the entire universe, as an isolated system, will always increase over time. It also states that the changes in the entropy in the universe can never be negative.
The first law dictates the energy conserved in a system9 and the second law dictates the efficiency of liquid cooling versus air cooling.
Temperature, Heat, Heat transfer
Next, it is important to understand temperature, heat and how they differ. Heat is the energy contained within a system responsible for its temperature which is a measure of the hotness or coldness of a system. Temperature and heat are fundamentally linked in cooling systems. Cooling systems work by transferring heat from a substance or space, thereby lowering its temperature. Convection and conduction are some of fundamental ways in which heat is taken away from the processors and dissipated into the environment. Convection is the process of transferring heat through currents in a fluid. A convection current is the continuous, circular movement of fluid (liquid or gas) that transfers heat, created when a heated part of the fluid expands, becomes less dense, and rises, while cooler, denser fluid sinks to take its place, setting up a cycle. Additionally, in closed liquid cooling loops convection is forced by the pump to allow for greater cooling10. This is what allows modern day high TDP CPUs to stay cool. Conduction is the process of heat transfer through contact. Since air is a poor conductor of heat, thermal paste is used to fill in the microscopic gaps between the processor and the cooler. Thus, the rate of conduction is higher allowing for greater cooling. Conduction is used to transfer heat away from the source and convection is used to dissipate that heat into the surrounding environment11.
Enthalpy of vaporisation
In evaporative cooling, water’s high enthalpy of vaporization allows the option of efficient evaporative cooling to remove waste heat, therefore making it more efficient than air cooling. The enthalpy of vaporisation is the energy required to overcome the interparticle interactions in the liquid state to enter the gaseous state. Therefore, a high enthalpy of vaporization means a liquid requires a large amount of energy to transition into a gaseous state. It is also crucial for effective cooling because it allows a liquid to absorb a large amount of heat energy before it changes phase into a gas, thus providing a powerful cooling effect. This is primarily how heat pipes of air coolers and vapor chambers work.
Heat Flux
Heat flux is the rate of thermal energy flow per unit area12. In liquid cooling heat flux is the concept that drives liquid cooling’s thermal management. Liquid cooling aims to maximise the heat flux so that a higher amount of heat can be removed using less physical space.
Air Cooling
Air cooling is a fundamental concept to explore when discussing cooling of computer components because this is the primary cooling method used for CPUs and GPUs. Air cooling is a method of dissipating heat and it works by expanding the surface area or increasing the flow of air over the object to be cooled. This form of cooling is sufficient for most computer systems. It is cheap and easy to maintain. But as technology has advanced, more powerful compute workloads make the temperatures of components rise much more than normal. Hence liquid cooling is now becoming necessary and more common.
Components of Air Cooling and how they work
The main components of an air cooling system are fans, heatsinks and heat pipes.
- The fan is what allows for the dissipation of heat from the system into the surroundings. Computer fans play a crucial role in cooling by actively circulating air to prevent overheating. They draw in cool air from outside the computer case and expel hot air generated by components like the CPU and GPU, thus maintaining optimal operating temperatures. Fans on the air cooler blow air over the heatsink effectively expelling the heat generated by the components.
- Heat sinks in air coolers work by maximizing heat transfer from a hot component (like a CPU) to the surrounding air. They achieve this by increasing the surface area in contact with the air, allowing for more efficient heat dissipation through conduction, convection, and some radiation. Some consumer grade air coolers (like the Thermalright Peerless Assassin) have more than one heat sink to allow for more efficient heat dissipation13.
- Heat Pipes help in conducting heat away from the CPU to the heatsink with ‘minimal heat loss’. This helps in transferring heat very efficiently from the die to the heatsink. The more heat pipes there are the faster and more efficient will be the heat transfer away from the CPU ensuring cooler temperatures which will help increase performance of the system or allowing for more overclocking headroom.

Thermodynamics of air cooling
This section will dive deeper into the thermodynamics of air cooling.
The concept of surface area is applied in the heatsink. The heat sink has fins which increases the surface area for heat transfer and allows for efficient heat transfer from the base of the heat sink to the surrounding air through convection. The fans force air through the fins which allows for even more efficient heat transfer from the heat sink to the air.
Next is the concept of conduction and convection. Heat is first conducted from the hot CPU or GPU die through a thermal interface material (like thermal paste) to a baseplate, usually made of copper or aluminum. This baseplate then transfers the heat to a heatsink, which has a large surface area of fins. Air is forced over these fins by a fan, carrying the heat away through convection, where warm air rises and is replaced by cooler air. The efficient conduction from the processors die to the heat pipes and the base of the heat sink is very important. Therefore, thermal paste is used to increase the contact between the two surfaces – the base of the heatsink and the processor’s die. This allows for better conduction of heat by better particle interactions which makes the conduction more efficient and hence lower temperatures.
The final concept is thermal conductivity. Thermal conductivity is the rate at which heat is conducted through materials. The higher the thermal conductivity, the better the heat transfer between two surfaces. This concept will dictate how efficiently heat will be transferred from a hot processor to a cooling system (same concept also applies in liquid cooling). Additionally, the second law of thermodynamics will dictate the direction of heat transfer which in this case is from the hot processor die to a cooling system.
These concepts are illustrated in the diagram below-
Applications, advantages and disadvantages
Air cooling has remained most preferred over the decades and it has dominated in both servers and computer systems at home. This is because most computer systems and servers don’t heat up to a point where air cooling is insufficient and the workloads are also minor or the hardware isn’t powerful enough to heat up. Air coolers are cheaper in price and more reliable to maintain. However, as technology advances, computers will draw more power and they will heat up more therefore air cooling will be insufficient. Air cooling is widely used in entry level home PCs and smaller data centers with lower power draw per rack (each server individually draws less power). Some larger data centers could still use air cooling because they were set up earlier. Air coolers are more reliable to maintain as they are relatively simple and have less failures. Even if they fail it is cheap and easy to replace compared to liquid coolers.
Air cooling may be reliable and cheap but it has some severe limitations. Air cooling has lesser cooling efficiency than liquid coolers (discussed further in the thermodynamics section under liquid cooling)15. Inefficient cooling can lead to overheating which can reduce the lifespan of the computer components or lead to lower performance. Air cooling sometimes cannot dissipate heat efficiently in dense server racks in which multiple components generate heat (components that generate heat other than CPU and GPU are memory, VRMs on motherboard etc). The high-speed fans involved in air cooling generate a lot of noise which can be disturbing in some scenarios and these fans also have a high energy consumption which adds to the cost of the electricity. Air cooling also has issues in scalability. As large data centers scale, they will slowly require more power and hence air cooling may not be sufficient. Scaling air cooling can be expensive and the real estate required could be much more than liquid coolers.
Liquid Cooling
Liquid cooling refers to cooling by means of the convection or circulation of a liquid. In this section we will go deeper into the concepts of liquid cooling works and discuss differences from air cooling.
Components
The core components of liquid cooling are the water block, the pump, the radiator and the coolant.
The water block is the component that is mounted directly on the heat generating component (the processors’ die). They have a metal base usually made of copper(in some cases aluminium) which sits directly on the processor. This allows the waterblock to conduct heat away from the processor into the coolant. There are channels inside the water block where the coolant flows. One channel flows away from the processor taking the absorbed heat away and the other brings in the coolant to take heat away from the processor.
The pump’s purpose is to pump or circulate coolant throughout the liquid cooling loop.
The radiator is the most important component in liquid cooling. It exposes the coolant to the air which helps it cool. The fans attached to the radiator then move the heat away from the cooler effectively removing heat from the cooling loop and the computer system (radiators in computer systems and servers are smaller in size than those found in cars but they perform a similar function in both cases). The radiator has fins that have coolant passing through them. This helps increase the surface area from which heat can be dissipated allowing for more efficient heat transfer. The fans in the radiator blow air through it allowing for the heat to be removed from the computer system thereby effectively cooling the processor. Additional information on radiators16.
The liquid coolant is where liquid cooling gets its name from and it is also what makes liquid cooling one of the most effective forms of cooling. The liquid coolant is often water which is either purified or deionised or less commonly used a water ethylene glycol mixture. Water is often preferred because it is cheap, widely available and it has high thermal conductivity and a high specific heat capacity. This makes water an efficient coolant and sufficient for the majority of cooling needs of computer systems and data centers. Water-glycol mixtures, often with ethylene or propylene glycol, offer freeze protection and increased boiling points compared to pure water, making them suitable for environments with temperature fluctuations. An interesting paper exploring coolants and radiators17.
All these components are a part of the liquid cooling loop which is shown in figure 4. In the liquid cooling loop, the reservoir holds the coolant and needs to be refilled with coolant occasionally in case of coolant loss due to evaporation or leaks. In a liquid cooling loop, coolant absorbs heat from components like the CPU or GPU, then circulates to a radiator where the heat is dissipated to the surrounding air. The cooled liquid is then pumped back to the components, completing the cycle and maintaining a consistent temperature.

Thermodynamic Principles
The principles of water’s high specific heat capacity and the concepts of conduction and convection are behind liquid cooling. This is what makes this method one of the most efficient forms of cooling.
Let us dive deep into the high specific heat capacity of water and how it helps in liquid cooling.
Specific heat capacity is the amount of heat energy required to raise the temperature of one gram of a substance by one degree Celsius (or one Kelvin) and it is calculated by the equation:
(2) 
The higher the specific heat capacity, the more energy a substance can absorb without a significant temperature change. The specific heat capacity of liquid water is approximately 4184 joules per kilogram per kelvin at 20°C. This means it takes 4184 joules of energy to raise the temperature of 1 kilogram of water by 1 degree Celsius (or 1 kelvin). Water has a very high specific heat capacity compared to most other common substances, which is why it is used in applications like car radiators and it plays a crucial role in even regulating Earth’s climate.
Therefore the thermal efficiency of liquid cooling over air cooling is rooted in the significantly higher thermal conductivity and specific heat capacity of water. Air has a thermal conductivity of 0.026 W/m.K and water’s is 0.6 W/m.K which is roughly 20 times higher than air’s. Moreover water has a specific heat capacity of 4184 J/Kg.°C whereas air has a specific heat capacity of 1005 J/Kg.°C. Thus water’s superior thermal conductivity, specific heat capacity and volumetric heat capacity make it more efficient for cooling.
Conduction and Convection:the efficient conduction from the processor to the base of the cooler is very important. The principle of convection is also applied in liquid cooling. The heated liquid, having absorbed heat via conduction, then circulates through the cooling system via a pump and tubing. As it flows, it transfers heat to the radiator, where it is dissipated into the surrounding air via convection and radiation, aided by fans. The first two laws of thermodynamics again apply here when heat is transferred. The second law dictates the direction of heat transfer and the first law dictates that the heat energy removed from the CPU is conserved as it’s transferred into the coolant and finally into the surrounding air.
Applications, Advantages, Disadvantages
Liquid cooling is most used in data centers that have a high density of server racks and a very high-power draw. Liquid cooling is also used in supercomputers, AI infrastructure19 and some high end home PCs. Liquid cooling is used to keep the temperatures of components stable that have a high workload like in servers and AI infrastructure. We know that the performance of AI infrastructure degrades when the temperature rises so cooling is very important. Liquid cooling is also used by enthusiasts who wish to overclock their CPUs and GPUs. Overclocking is increasing the clock speed of components higher than intended by the manufacturers. Since overclocking produces a lot of heat, liquid cooling allows for a higher thermal headroom allowing processors to be pushed further.
Liquid cooling has several advantages over air cooling which includes better heat transport efficiency, smaller system size and lower energy consumption. Additionally, fans don’t need to push as hard in air cooling therefore we can use cheaper fans. However, there are some major trade offs of liquid cooling. Liquid cooling has a very high initial cost and it is also less reliable because it has a more complex installation process. It has a significant risk of leaks that can damage components and has increased maintenance needs which adds to the operating costs20. Liquid cooling also comes with potential maintenance issues and costs with pumps, coolants and corrosion. These are the reasons that average users and smaller data centers use the more reliable and cheaper method of air cooling21.
Experimental Methods
This section discusses the details of the experiment set up, the apparatus and the components used in the experiment. It also presents all the constant variables and the measures taken to ensure that the set up was identical for each run of the experiment.
Experiment Hypothesis
This study employs formal hypothesis framework to evaluate the response of modern high-density architectures to different cooling solutions and workloads –
Experimental (Alternative) Hypothesis (H1): If a CPU is subjected to sustained workloads like Prime95, Cinebench R23 and AI inference tasks, then liquid cooling will provide measurable performance gains and greater thermal headroom over air cooling, particularly when used with modern consumer high density architectures like Zen 4 and Zen 5 with power caps removed.
Statistical Null Hypothesis (H0): The type of cooling solution (Stock Air, Peerless Assassin, ML240L, or Lian Li) has no statistically significant impact on the sustained thermal performance or clock speeds of the CPU. Any observed variance is attributed to random experimental error.
Components and Apparatus
This experiment has been run on a consumer PC that was built with the configurations described below:
Standard PC configuration
This configuration was constant across all the experiments
- RX 9060 XT 16GB graphics card
- 32 gigabytes of Kingston Fury Beast RGB 32GB 6000MT/s DDR5 CL30 DIMM Desktop Memory
- Motherboard – Gigabyte x870 eagle wifi7 motherboard
- Chassis – MSI MAG Forge 320 R air flow
Processors under test
(a) AMD Ryzen 7 9700X: Built on the Zen 5 architecture, the AMD Ryzen 7 9700X features a 3.8 GHz base and 5.5 GHz boost clock. It has 8 cores and 16 threads. This chip has 65W TDP and a 88W PPT by default. However it behaves more like a high TDP chip when the power is uncapped as mentioned below. This chip has a 95°C TjMax
(b) AMD Ryzen 5 7500F: Built on the Zen 4 architecture, featuring a 3.7 GHz base and 5.0 GHz boost clock. It has 6 cores and 12 threads. It also has a 65W TDP and an 88W PPT by default. However, even when the power is uncapped it still behaves like a low TDP chip. Its 6-core configuration results in lower thermal density compared to the 9700x.
Cooling solutions used
Four types of coolers were used for the experiment: two air coolers and two liquid coolers.
(a) Air Cooler 1: The first air cooler is the AMD stock air cooler (AMD Wraith Stealth (SR1)). The air cooler’s specifications are:
(i) 4 × 6 mm copper heat pipes
(ii) 120 mm heatsink with aluminium fins and a copper base
(iii) 92 mm fan, which has a max RPM of 2500
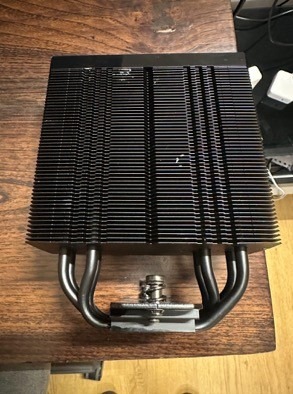
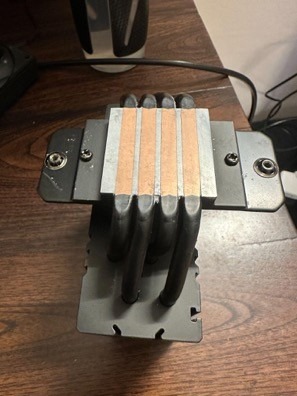
(b) Air Cooler 2: The second air cooler is the Thermalright Peerless Assassin 120 SE Black. Its specifications are:
(i) 6 × 6 mm copper heat pipes
(ii) 2 × heatsinks with dimensions of L125 mm × W110 mm × H155 mm
(iii) 2 × 120 mm fans with max RPM of 1550 RPM ±10%
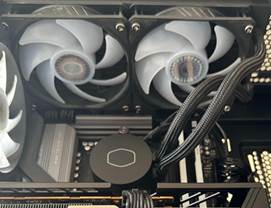
(c) Liquid Cooler 1: Cooler Master ML240L V2 AIO22. The liquid cooler’s specifications are:
(i) 240 mm radiator
(ii) 2 × 120 mm fans with a max RPM of 1800
(d) Liquid Cooler 2: Lian Li Galahad II Lite Performance 360. Its specifications are:
(i) 360 mm radiator
(ii) 3 × 120 mm fans with a max RPM of 2500 RPM
Workloads
Three different workloads were stress test and monitored:
- Prime 95: Small FFT stress test23
- Cinebench R23
- AI inference: Llama 3.1 8B via Ollama. The prompt used was ‘Write a 500 word technical explanation about CPU microarchitecture’ was run in a loop. Compute was strictly limited to CPU. The code used for the AI inference task is available in the appendix.
Monitoring and logging the results
The experiment was monitored with HW info 6424 and results were logged with the in-built logging tool. A logging interval of 0.1 seconds was chosen for a high resolution data logging. The results were exported to a Google sheets document to keep a record and graph the results.
Experiment Design
A total of 24 different experiment configurations were evaluated, comprising two CPUs, four cooling solutions and three workloads. Each configuration was tested using three independent runs, resulting in 72 total test runs. Below are the steps that were followed to run the experiments:
- Step 1: Reboot the machine from the shutdown state
- Step 2: Start only the HWinfo monitoring software with an option to record logging turned on
- Step 3: Note the idle temperature of the CPU
- Step 4: Start the stress test (workload) 1 minute after starting the monitoring software
- Step 5: Once the stress test completes its duration then stop the test immediately
- Step 6: Keep running the monitoring software for an additional 1 minute to record the cool down phase of the experiment
- Step 7: Stop logging at the end of one minute of the cool down phase
- Step 8: Shutdown the machine immediately
- Step 9: Wait for 10 minutes before restarting the machine for the next test
- Step 10: Once the stock cooler run of the experiment is finished, remove the stock cooler in the PC and swap it with the next cooler. This will be a manual process. If the cooling solution is the ml240L remove the two extra case fans because the radiator’s fans will make up for the airflow. If it is the Lianli cooler then remove the exhaust fan as well. All other variables should be kept constant
- Step 11: Repeat the exact same steps with all the coolers and note the temperature readings
- Step 12: Once all the steps have been repeated with all the 4 coolers the CPU has to be swapped from the Ryzen 7 9700x to the Ryzen 5 7500f. Then repeat all the above steps with the 4 coolers
Constant Variables
Following controls were enforced to ensure data validity:
- Atmospheric condition: The AC was turned on 30 mins prior to the experiment at 24°C to keep the temperature constant. The Ambient temperature was monitored by a digital thermometer and held constant at 24°C ±0.5°C.
- Humidity: Monitored by a digital hygrometer and maintained at 55% ±5%
- Fan curves: All fan curves were locked to a constant profile in the BIOS.
- Airflow Equilibrium: Total chassis airflow was kept constant at 3 intake and 3 exhaust fans.
- During the air cooling phase, two additional exhaust fans were added to compensate for the radiator fans.
- For the 360mm liquid cooler, one exhaust fan was removed as the radiator provided three fans.
- Power Limits: Power was uncapped for all runs, with PPT set to 630W.
- The Thermal paste used was the Arctic MX-6 thermal paste and it was kept constant throughout the experiment using a stencil. However there can still be some minor inconsistencies and variations in the amount of thermal paste added. While minor variations in mounting pressure are inherent to manual installation, all screws were tightened to the point of natural resistance to ensure uniform contact across the IHS (Integrated Heat Spreader).
Experimental Analysis
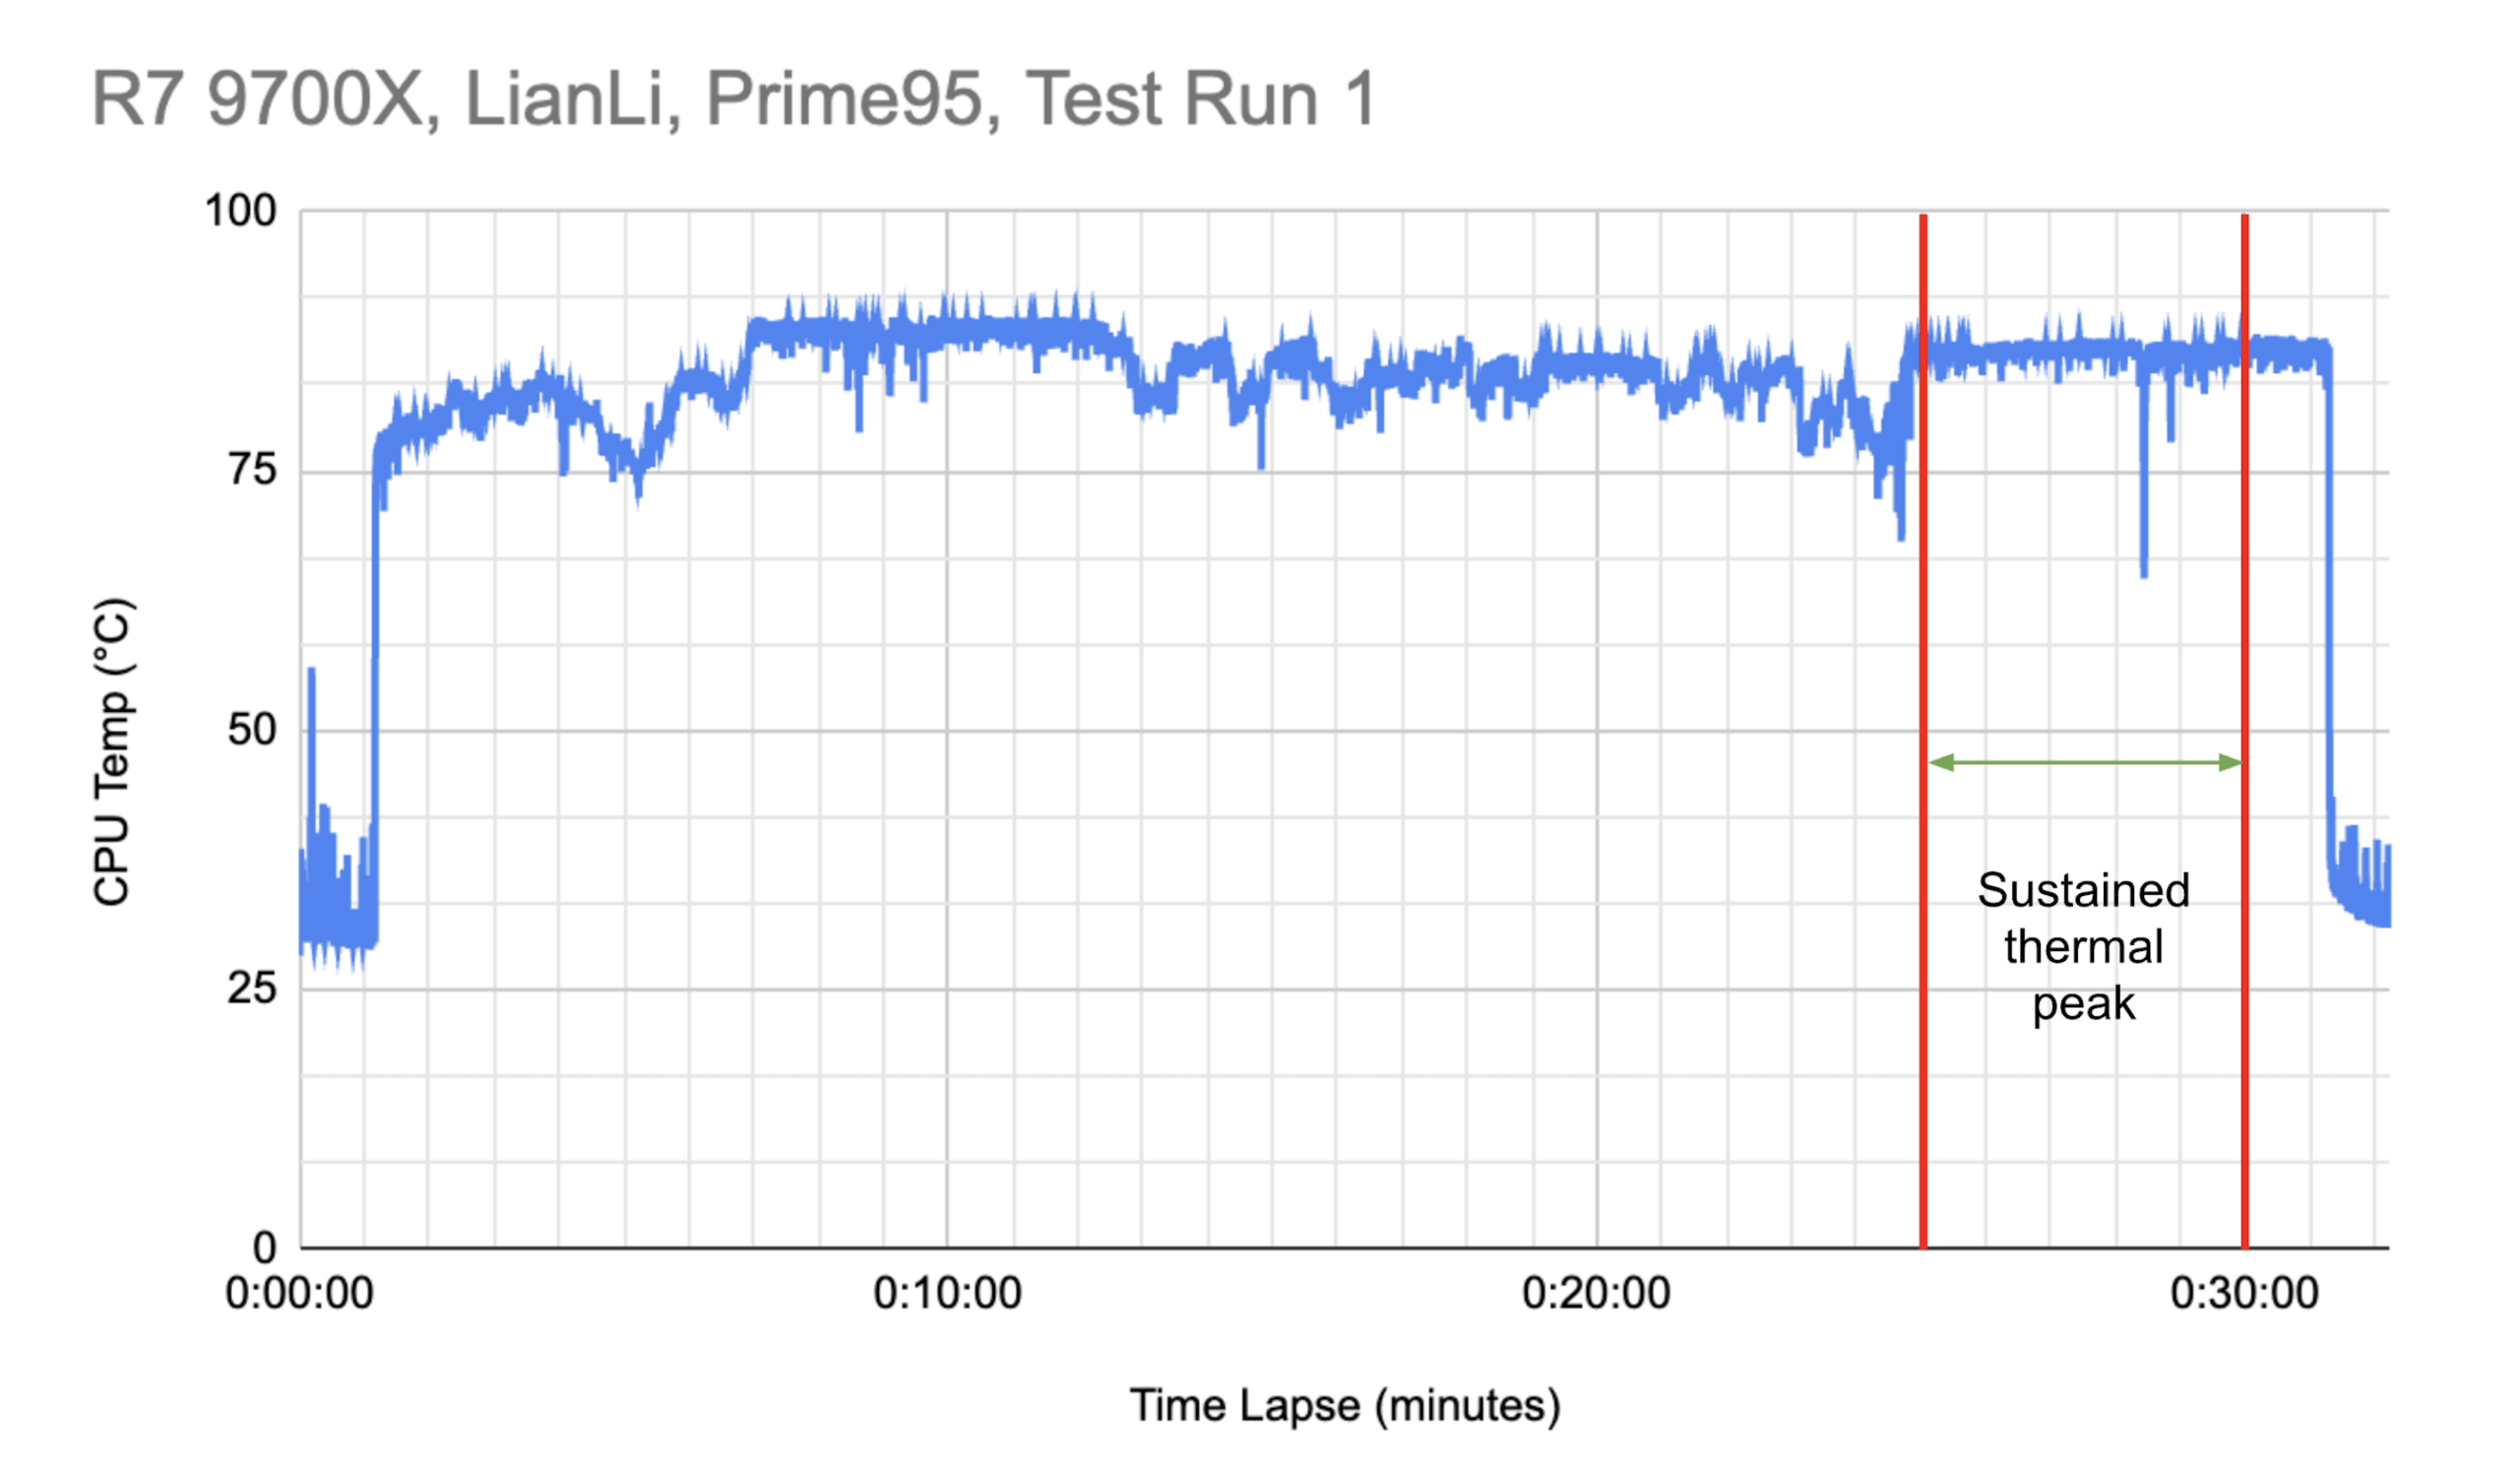
Selection of sustained thermal Peak
The analysis was focused on the sustained thermal peak of each test run.
- Prime95 & AI: 5 mins of test data was analysed
(3) 
- CineBench: 5 mins of test data was analysed
(4) 
Data Presentation
All quantitative thermal temperature of CPU in (°C) and performance data (CPU clock speed in MHz) are reported as the mean X± one standard deviation (SD) across the three independent experimental runs. The mean represents the central tendency of the sustained thermal peak, while the standard deviation indicates the experimental precision and the consistency of the cooling solution’s performance under load.
To understand the thermal impact of the cooler on the CPU for a given workload, thermal headroom that is the difference in the maximum allowed operating temperature,Tjmax (set by the manufacturer) and the mean temperature achieved during the thermal peak of the test run has been calculated as below
(5) 
Statistical Framework: One-way ANOVA
To determine if the variance in CPU performance across different cooling solutions was statistically significant, a One-Way Analysis of Variance (ANOVA) was employed. This test evaluates the Null Hypothesis (H0) by comparing the variance between the cooler groups to the variance within the groups.
Mathematical Formulas for Analysis
1. Sum of Squares between Groups ( ): Measure the variation between the four different cooling solutions.
(6) 
Where  is the number of runs per cooler,
  is the mean of a specific cooler group, and
  is the grand mean of all runs.
2. Sum of Squares within Groups ( ): Measure the variation (error) within the repeated runs of the same cooler.
(7) 
Where  is the variance of each individual group.
3. Mean Squares (MS): The Sum of Squares divided by their respective degrees of freedom ( ).
).
(8) 
(9) 
4. F-Statistic Calculation:
(10) 
Statistical Parameters and Decision Rule
The ANOVA was conducted using the following fixed parameters based on the experimental design:
- (Total test runs per coolers): 3
 (Number of cooling groups): 4
 (Total observations per CPU/Workload): 12
- Degrees of Freedom (Between):

- Degrees of Freedom (Within):

- Critical Value: Based on an alpha level of
 , the
, the  .
.
Statistical Inference: The -value is derived from the resulting
 using online p-value calculator GraphPad25 If
  (resulting in
  ), the Null Hypothesis (
 ) is rejected.This indicates that the differences in performance across the cooling solutions are statistically significant and not the result of random experimental error, thereby supporting the Experimental Hypothesis (
 ).
).
Experimental Result
In high-intensity synthetic workloads like Prime95, the type of cooler had a profound impact on the thermal headroom and the performance of the AMD Ryzen 7 9700X. The liquid coolers, Lianli and Cooler Master, typically performed better than the air coolers however the Cooler Master liquid cooler and the Thermalright air cooler performed similarly as noted below. As expected, the Lianli with a larger radiator performed much better than all the coolers. However this general behaviour was not always the case and the behaviour changed based on the workload and processor. These differences in observations are shared below.
| Stock Cooler | Thermalright Peerless Assassin | Cooler Master ML240L | Lianli GA 2 performance lite | ||
| AMD R7 9700X | Mean CPU Temp °C | 95.2 ±0.1 | 95.4 ±0.1 | 90.2 ±1.0 | 86.3 ±1.6 |
| Mean Clock Speed MHz | 3808 ±66 | 4899 ±27 | 4840 ±29 | 4966 ±17 | |
| Thermal Headroom MHz | Nil | Nil | 4.8 | 7.7 | |
| AMD R5 7500F | Mean CPU Temp °C | 91.1 ±0.2 | 75.6 ±0.7 | 78.1±1.2 | 70.3 ±0.8 |
| Mean Clock Speed MHz | 4423 ±17 | 4798 ±86 | 4766 ±13 | 4667 ±256 | |
| Thermal Headroom °C | 3.9 | 19.4 | 16.9 | 24.7 |
In Prime95 when the CPU, Ryzen 7 9700X, is cooled with the Stock Cooler (AMD Wraith SR1), the CPU achieved a mean temperature of 95.2°C ±0.1°C with a mean resulting clock speed of 3808 MHz ±66 MHz. Upgrading to the Lianli reduced mean sustained thermal peak temperatures of the CPU to 86.3°C ±1.6°C and provided approximately 7.7°C of thermal headroom while allowing the clock speed to increase to 4966 MHz ±17 MHz resulting in a meaningful performance gain of 30%. This data shows that there was negligible difference in performance gains to no performance gains between using a high end air cooler or using a lower end liquid cooler without any manual overclocking. Lianli also showed performance gains over the Thermalright with a slight improvement of 1.36% in mean clock speeds. Though it is to be noted that the greater thermal headroom that is provided by liquid cooling implies that the CPU can be pushed further to gain more performance via overclocking.
In Prime95 when the Ryzen 5 7500F was cooled with the stock cooler, it resulted in a mean temperature of 91.1°C ±0.2°C running at a mean clock speed of 4423 MHz ±17MHz. However, just using a better air cooler, Thermalright, was sufficient to drop the mean temperature to 75.6°C ±0.7°C. The clock speed of the processor, when cooled using all 4 cooling solutions during the Prime95 workload, were similar for almost all the tests. When the CPU was cooled using the stock cooler it had a slightly lower mean clock speed of 4423±17MHz compared to all the other coolers.
One-way ANOVA was performed on the clock speed data from sustained thermal peak to verify the findings
| Workload | Fstatistic\F | p-value\p | Significance | |
| AMD R7 9700X | Prime95 | 576.0 | < 0.0001 | Extreme |
| AMD R5 7500F | Prime95 | 4.7 | 0.1152 | Not Significant |
With and , the Ryzen7 9700X p-value  provides enough evidence to reject the Null Hypothesis () and accept the experimental Hypothesis (). Test outcome of R5 7500F on the other hand yielded p-value
  which is significantly higher than the set , hence the Null Hypothesis () can not be rejected in this case.
Similar results were observed during the Cinebench R23 workload test runs as that of test runs of Prime95.
| Stock Cooler | Peerless | 240ML | Lianli | ||
| AMD R7 9700X | Mean CPU Temp °C | 95.3 ±0.2 | 95.2 ±0.3 | 90.6 ±3.7 | 83.7 ±4.0 |
| Mean Clock Speed MHz | 4485 ±79 | 5258 ±41 | 5231 ±38 | 5307 ±25 | |
| Thermal Headroom °C | Nil | Nil | 4.4 | 11.3 | |
| AMD R5 7500F | Mean CPU Temp °C | 91.1 ±1.4 | 70.2 ±2.2 | 74.2 ±2.0 | 67.8 ±2.0 |
| Mean Clock Speed MHz | 4609 ±30 | 4894 ±49 | 4839 ±53 | 4918 ±51 | |
| Thermal Headroom °C | 3.9 | 24.8 | 20.8 | 27.2 |
When the LianLi was used to cool the Ryzen 7 9700x while running Cinebench test, it provided a thermal headroom of 11.3°C and it let the CPU run at a clock speed of 5307 ±25 MHz. When the stock cooler was used to cool the CPU it provided no thermal headroom and it let the CPU run at a clock speed of 4485 ±79MHz. Thus the performance gain of going from best to the worst cooler in this test sample was approximately 18.3%. There was also a slight performance gain of 0.93% when using the LianLi AIO instead of the Thermalright peerless assassin.
When the Ryzen 5 7500f was cooled using the 4 cooling solutions while running Cinebench R23 the clock speed trends were similar to the 9700x. Even when cooled with the Stock Cooler, the Ryzen 5 7500F achieved 4609 ± 30 MHz, which is much closer to its maximum boost clock speed than what was achieved in the case of the 9700X. The performance peaked at 4918 ± 51 MHz on the AIO, representing a total gain of 6.7% from stock to liquid, which is relatively lower compared to the 9700x.
One-way ANOVA analysis on the sustained thermal peak data of the Cinebench test confirmed our finding
| Workload | Fstatistic\F | p-value\p | Significance | |
| AMD R7 9700X | CineBench | 185.4 | 0.0006 | Extreme |
| AMD R5 7500F | CineBench | 28 | 0.0098 | Significant |
There was a significant evidence (p-value = 0.0006,  ) to reject the Null Hypothesis (H0) meaning that the impact of the cooling solutions was significant in case of Ryzen7 9700X. While the data from testing Ryzen5 7500F (p-value = 0.0098, ) also showed evidence to reject the Null Hypothesis (H0) but as the
  is not very large as compared to therefore the impact of the cooling solution was evident but not significant.
The AI inference workload exhibited unique thermal behavior compared to synthetic tests.
| Stock Cooler | Peerless | 240ML | Lianli | ||
| AMD R7 9700X | Mean CPU Temp °C | 96.15 ±0.2 | 63.6 ±0.9 | 60.0 ±2.5 | 51.5 ±3.1 |
| Mean Clock Speed MHz | 5114 ±98 | 5440 ±147 | 5441 ±69 | 5472 ±137 | |
| Thermal Headroom °C | Nil | 31.4 | 35.0 | 43.5 | |
| AMD R5 7500F | Mean CPU Temp °C | 77.7 ±2.6 | 51.1 ±2.1 | 55.4 ±2.3 | 48.7 ±1.9 |
| Mean Clock Speed MHz | 4747 ±155 | 4666 ±195 | 4635 ±204 | 4663 ±194 | |
| Thermal Headroom °C | 17.3 | 43.9 | 39.6 | 46.3 |
When the 9700x ran the AI inference workload while being cooled by the stock cooler it reached mean temperatures of 96.15°C ±0.2°C (going beyond the Tj Max temperature), but the mean temperatures dropped drastically to 51.5°C ±3.1°C while cooled by the Lianli AIO. The clock speed increased from 5114 ±98 to 5472 ±137 when upgrading the cooler to the Lian li AIO. This data proved that upgrading the cooler had a slight performance gain of 7% while providing a significantly high thermal head room of 43.5°C. Compare this to the performance gain of 30% in case of Prime95 when cooled with Lianli cooler.
For the Ryzen5 7500f the results were different and unique. The clock speed was slightly higher when the CPU was cooled with a stock cooler (4747 ±15MHz). The clock speed was similar for the other coolers though the CPU ran at a lower clock speed when cooled with the ML240L liquid cooler (4635 ±204). This data showed that there was no performance gain when switching to a better air cooler or upgrading to liquid cooling. However, as expected the Lianli AIO provided the greatest thermal head room of 43.5°C.
| Workload | Fstatistic\F | p-value\p | Significance | |
| AMD R7 9700X | AI | 6.3 | 0.0789 | Not significant |
| AMD R5 7500F | AI | 0.2 | 0.9694 | Not significant |
Analysis of the emerging AI Inference workload revealed a similarity in thermal dependency between the two tested architectures. For the AMD R7 9700X,  that is
  . Similarly for AMD R5 7500F p-value = 0.9694 where also . Therefore in both the cases there not enough evidence to reject the Null Hypothesis (H0).
The AI workload test data shows that the impact of coolers on the CPU performance, clock speed, is not very significant however there is a significant thermal headroom created by the cooling solutions.
Discussion
The Ryzen7 9700X along with the Stock Cooler across all the workloads reached the mean temperatures upwards of 95°C which is the CPU’s TjMax, triggering aggressive downclocking to protect the silicon (thermal throttling, see Appendix 1). This was most prevalent during the Prime95 workload, which is inherently very thermally intensive, where the temperatures were 95°C with a standard deviation of only 0.1 and the clock speeds were much lower compared to other coolers and they were 3808 MHz with a standard deviation of 66. As the coolers were upgraded both the clock speed and the thermal headroom increased.
Across the workloads there was usually only a minor difference between the thermal headroom, 2.5°C – 4.8°C, and mean clock speeds, 1MHz – 59MHz, provided by the Thermalright Peerless Assassin and the Cooler Master ML240L. This is because 240 mm AIO’s have a similar surface area to dual tower air coolers (Peerless Assassin). Therefore the advantage of liquid cooling scales much better when it is cooling a high TDP chip or if the airflow is restricted and it scales much more significantly when moving to 360mm + radiators. The Lianli AIO gave the largest thermal headroom as expected. The greater thermal headroom achieved by upgrading the class of cooler allowed the CPU’s boosting algorithm to maintain a higher voltage/frequency state, resulting in statistically significant performance gains as showcased above.
Similar results were observed in R5 7500F but they were not as drastic as the results observed in the 9700x. There was no significant thermal throttling observed (see Appendix 2) in this CPU even after using the stock cooler. The results were all statistically significant proving that there were some performance gains by using liquid cooling.
The Ryzen7 9700X is a chip with only a 65 W TDP. However, this serves like a thermal design guideline rather than a strict limit on power consumption. With a higher uncapped PPT AMD’s boosting algorithm lets the chip draw much more power and thus it behaves like a much higher TDP chip. Thus the chip tends to heat up more since it is trying to run at a higher sustained clock speed. The Ryzen5 7500F is a chip which has a 65 W TDP as well. However, even after all power caps are removed it still behaves like a lower TDP chip. It doesn’t heat up as much because it has a lesser core count and because it has a lower boost clock along with some architectural differences. It also does not draw as much power. This explains why the Ryzen 5 7500f stayed cooler than the Ryzen 7 9700x on average across the 4 cooling solutions.
During the AI tests the Ryzen5 7500F reached a deterministic frequency ceiling rather than a thermal one. Even with the stock cooler the 7500f stays cool enough to run as fast as its firmware allows and the bottleneck shifted from a thermal bottleneck to a firmware and silicon bottleneck. Through deductive reasoning, it was concluded that the firmware implemented a strict voltage frequency offset thus it did not let the CPU request for more voltage even with a greater thermal headroom. This is because the LLama 3.1 8b model utilises the AVX-512 instruction set which is mathematically intensive and is very thermally demanding. Thus across all cooling solutions there was no significant statistical difference in clock speed. Though the voltage was not monitored in this experiment, future research can further validate this claim by monitoring voltage.
From these independent experiments and from the data we can conclude that liquid cooling is more efficient than air cooling and it provides some performance gains. The experimental hypothesis (H1) of this experiment was that If a CPU is subjected to sustained workloads then liquid cooling will provide measurable performance gains and provide a significantly greater thermal headroom across all workloads. There was significant evidence (p-vale, Fstatistic) to accept this hypothesis in the case of running Prime95 & Cinebench workload on Ryzen 7 9700X. There were also some performance gains on the Ryzen 5 platform but the gains were not very significant.
The analysis of the results also proved that choosing a cooling solution depends on how CPU and workload combination behaves and that cooling only may not always provide any real performance gains that could justify investments in cooling. The p-values across the 9700x and 7500f were greater than the  set for the experiment giving no evidence to reject the Null Hypothesis (H0) implying there was no impact of cooling solutions on the performance of the AI workload. As seen from the AI experiment, AI workloads and other real world workloads perform very differently thermally with different hardware configurations, therefore workloads and their underlying hardware architecture must be kept in mind while choosing a cooling solution to maximise the performance of the system.
After a comparative analysis of the quantified data across the coolers, CPU and workload configurations, it was proved that for low intensive workloads and for lower end CPUs liquid cooling had greater diminishing returns and gave no real performance gains and to some extent thermal headroom gains.
Challenges, Limitations and Future Work
Challenges faced during the experiment
There were several challenges faced while conducting the experiment especially with liquid cooling. Initially the power cap was set very low at 88 Watts. This hindered the stress test to push the CPU to its fullest potential. This also hindered the temperature from rising substantially and therefore the gap between air cooling and liquid cooling was minimal and thus the hypothesis could not be validated. However, this failed attempt established that power has a very close relationship with temperature (this is linked to the first law of thermodynamics). In the following attempts, power caps were removed and this caused the power draw to skyrocket to 170-180 Watts causing the temperature of the CPU to rise to the maximum operating temperature of 95 degrees for most of the coolers. There were several challenges in manually installing the air coolers in the consumer PC. Running 72 different test set ups, with different cooler and CPU configurations was extremely time consuming involving manual steps of opening the PC, changing the parts, thermal paste application, re-assembling the PC. Every test run was about 20-30 minutes requiring accurate starting and stopping of the monitoring software and ensuring that the room temperature and humidity remained constant. This meant 100s of hours spent running the experiments and carefully gathering the data.
Limitations
The results of the experiment are subject to multiple methodological limitations that affect the realism and precision of the results. Workload selection is a primary limitation as more realistic workloads other than AI inference were not conducted. Prime 95 small FFT is a very thermally intensive workload and this represents a synthetic worst-case thermal load that is not representative of typical consumer usage scenarios. These stress tests are useful to analyze thermal limits but they may over emphasize peak thermal behaviour relative to real world workloads. The experiment was also severely limited in hardware selection. b. A potential selection bias may exist in favour of liquid cooling as liquid coolers typically occupied a slightly higher price bracket than the air coolers. Consequently, the results should be interpreted as indicative rather than definitive evidence of relative cooling superiority. The sample size of the experiment was very limited as the experiment evaluated a limited number of CPUs and cooling solutions, restricting the scope of the findings to the specific configurations and architectures tested. The test’s duration was limited to only 20/30 mins and 10 minutes for Cinebench and this may not capture data for a sustained thermal peak for a greater duration of time. Environmental conditions were controlled to a reasonable extent as atmospheric conditions like humidity and temperature were closely monitored and the AC was running constantly at 24 degrees Celsius. However, minor inconsistencies in the logging environmental fluctuations may have affected the results. Inaccuracies in the thermometer and hygrometer used in the experiment may have also affected the results. Errors in manual data logging may also contribute to timing inconsistencies. The AI workload was limited due to requirements of a significantly large RAM in the PC. Due to this, the model that was chosen for the experiment was with 8B parameters which has a limited effect on the CPU. There are limitations in the accuracy of the sensors on the PC and the measurement software. There is also a limitation in the scope of the experiment as it was only conducted on only 2 CPU classes and only 3 workloads were tested. This restricts broader conclusions regarding cooling performance across diverse computing scenarios. Although due care has been taken to ensure consistency in the equipment across the test runs, errors could still have also crept in due to inconsistency in application of the thermal paste, or due to over or under tightening of the coolers on the CPU or due to fan alignments and therefore airflow etc.
Future Work
Future work should expand this study by incorporating broader and more realistic workloads other than AI inference tasks like gaming bench marks, 3D rendering, image and video generation etcetera. The duration of the test could be increased as twenty to thirty minutes may not allow the liquid cooling loop and the air coolers to reach thermal saturations. The logging of the test results can be automated so that there are no minor or major inconsistencies in timings or atmospheric conditions. As more local AI models are being optimised to run on consumer PCs, future research can use these new and larger AI models for conducting similar tests. These new models can be more intensive on the hardware and reflect more real world workloads. There could be further studies on the impact of cooling on the CPU-GPU combination on a PC running more of these high intensity local AI workloads. As running AI locally becomes more prevalent, studying the impact of cooling on various hardware combinations and not only CPUs becomes more important.
Conclusion
This study investigated two primary objectives: (a) analyzing and quantifying the difference in performance (clock speed) and thermal headroom between liquid and air coolers using different CPU, coolers and workload configurations (b) examining the thermodynamic principles governing these cooling methods. The results show that for high TDP chips like the Ryzen 7 9700x, using a higher end liquid cooler could provide measurable performance gains of around 30% compared to a lower end air cooler while providing a substantially greater thermal headroom. A similar trend was observed for a lower TDP chip like the Ryzen 5 7500f where the use of a higher end liquid cooler resulted in performance gains of approximately 7%. However, when comparing a lower end liquid cooler with a similar price as the high end air cooler there was no observable performance gain. When using a lower end CPU under realistic workloads the air cooler provided a greater thermal headroom than the liquid cooler at the same price. Thus we can conclude that when using lower end hardware liquid cooling provides no real performance gain or any benefit. However, when it comes to high TDP hardware liquid cooling gives high performance gains verifying the hypothesis of the experiment. This is beneficial because it allows computer systems to run more intensive workloads better at a lower operating temperature. As AI technology advances and the demand for power increases, liquid cooling can prove to be beneficial to cool these power hungry processors and the performance gains of liquid cooling may outweigh the cost effectiveness of air cooling. There will be continuous breakthroughs in how the laws of thermodynamics are used to cool the computer systems of the future, innovation on better coolants and more sustainable growth of AI technology. These experiments show the deep connection between Physics and scaling of computer technology.
Appendix
Appendix 1
Appendix 2
Appendix 3
| Processor | Workload | Stock Cooler | Peerless | 240ML | Lianli |
| AMD R7 9700X | Prime95 | 3808 ±66 | 4899 ±27 | 4840 ±29 | 4966 ±17 |
| AMD R7 9700X | CineBench | 4485 ±79 | 5258 ±41 | 5231 ±38 | 5307 ±25 |
| AMD R7 9700X | AI | 5114 ±98 | 5440 ±147 | 5441 ±69 | 5472 ±137 |
| AMD R5 7500F | Prime95 | 4423 ±17 | 4798 ±86 | 4766 ±13 | 4667 ±256 |
| AMD R5 7500F | CineBench | 4609 ±30 | 4894 ±49 | 4839 ±53 | 4918 ±51 |
| AMD R5 7500F | AI | 4747 ±155 | 4666 ±195 | 4635 ±204 | 4663 ±194 |
Appendix 4
Test summary – means of temperature [C] in the steady state of the test
| Processor | Workload | Stock Cooler | Peerless | 240ML | Lianli |
| AMD R7 9700X | Prime95 | 95.2 ±0.1 | 95.4 ±0.1 | 90.2 ±1.0 | 86.3 ±1.6 |
| AMD R7 9700X | CineBench | 95.3 ±0.2 | 95.2 ±0.3 | 90.6 ±3.7 | 83.7 ±4.0 |
| AMD R7 9700X | AI | 96.15 ±0.2 | 63.6 ±0.9 | 60.0 ±2.5 | 51.5 ±3.1 |
| AMD R5 7500F | Prime95 | 91.1 ±0.2 | 75.6 ±0.7 | 78.1±1.2 | 70.3 ±0.8 |
| AMD R5 7500F | CineBench | 91.1 ±1.4 | 70.2 ±2.2 | 74.2 ±2.0 | 67.8 ±2.0 |
| AMD R5 7500F | AI | 77.7 ±2.6 | 51.1 ±2.1 | 55.4 ±2.3 | 48.7 ±1.9 |
Appendix 5
Test summary – means of power consumed in Watts
| Processor | Workload | Stock Cooler | Peerless | 240ML | Lianli |
| AMD R7 9700X | Prime95 | 99 ±1.3 | 174 ±3.1 | 163 ±2.0 | 180 ±3.6 |
| AMD R7 9700X | CineBench | 99 ±2.5 | 169 ±10.2 | 161 ±9.2 | 170 ±9.5 |
| AMD R7 9700X | AI | 100 ±6.6 | 111 ±10.4 | 114 ±7.9 | 111 ±10.2 |
| AMD R5 7500F | Prime95 | 101 ±1.0 | 132 ±1.7 | 128 ±1.5 | 129 ±2.9 |
| AMD R5 7500F | CineBench | 93 ±2.7 | 107 ±4.4 | 105 ±4.2 | 107 ±4.4 |
| AMD R5 7500F | AI | 85 ±6.7 | 80 ±7.2 | 82 ±6.7 | 79 ±6.4 |
Appendix 6

Appendix 7

Appendix 8
Code used for running AI inference workload


Data Availability
The datasets generated and analyzed during the current study, including raw thermal logs from HWInfo64, power consumption metrics, and statistical analysis spreadsheets, are available in the following GitHub repository: https://github.com/vivaanshrivastava/NHSJSResearch . The repository includes a readme file detailing the experimental configurations.
Acknowledgement
Thanks to my mentor, Khadija Sarguroh, who guided and mentored me throughout the process of writing this paper. Thanks to my writing coach Brantt Bridges who guided me on how best to articulate and present my findings. Thanks to Mr Ananth Narayan, Fellow at AMD, who guided me in selecting the right AMD CPU and GPU while I was building my Home PC.
References
- J. A – Amoha, Z. Khan, G. Wood, G. Knight. COVID-19 and digitalization: The great acceleration https://doi.org/10.1016/j.jbusres.2021.08.011 (2021). [↩]
- T. B.-Zvi and J. Luftman. Post-Pandemic IT: Digital transformation and sustainability Sustainability https://doi.org/10.3390/su142215275 (2022). [↩]
- S.A. Nada, M.A.Said. Effect of CRAC units layout on thermal management of data center. Applied Thermal Engineering https://doi.org/10.1016/j.applthermaleng.2017.03.003 (2017). [↩]
- E. Strubbel, A. Ganesh, A. McCallum. Energy and Policy Considerations for Deep Learning in NLP https://aclanthology.org/P19-1355.pdf (2019). [↩]
- F. Benedict, A. Kumar, K. Kadirgama, H.A. Mohammed, D. Ramasamy, M. Samyanko R. Saidur. Thermal Performance of Hybrid-Inspired Coolant for Radiator Application https://doi.org/10.3390/nano10061100 (2020). [↩]
- L-Q. Chen & J. C.Mauro.A modern statement of the first law of thermodynamics https://doi.org/10.1557/s43577-024-00802-w (2024). [↩]
- X. Huang, G. Buckinx, M.R. Vetrano, M. Baelmans. A one-dimensional numerical model for system performance prediction of loop heat pipes and its validation https://doi.org/10.1016/j.tsep.2025.103501 (2025). [↩]
- E. H. Lieb and J. Yngvason.The Physics and Mathematics of the Second Law of Thermodynamics https://doi.org/10.1016/S0370-1573(99)00082-9 (1999). [↩]
- L. Cheli, C. Carcasc. Modelling and analysis of a liquid-cooled system for thermal management application of an electronic equipment https://doi.org/10.1051/e3sconf/202019710008 (2020). [↩]
- M. Moze, A. Nemanic, P. Moredoz. Experimental and numerical heat transfer analysis of heat-pipe-based CPU coolers and performance optimization methodology doi.org/10.1016/j.applthermaleng.2020.115720 (2021). [↩]
- P. DV. Comparison Analysis of Liquid and Air-cooling Systems for GPU doi.org/10.22214/ijraset.2022.48448 (2022). [↩]
- I. Mudawar. Assessment of High-Heat-Flux Thermal Management Schemes doi.org/10.1109/6144.926375 (2001). [↩]
- H. E. Ahmed, B. H. Salman, A. Sh. Kherbeet, M. I. Ahmed. Optimization of thermal design of heat sinks: A review doi.org/10.1016/j.ijheatmasstransfer.2017.10.099 (2017). [↩]
- C. Harper. Guide to AIOs (All-In-One) liquid coolershttps://www.cgdirector.com/guide-to-aios-all-in-one-liquid-coolers/ (2023). [↩]
- J. Szulżyk-Cieplak, M. Paśnikowska-Łukaszuk, M. Wlazło. The influence of the cooling system on the efficiency of thermal management and the performance of computer components doi.org/10.1088/1742-6596/2628/1/012029 (2023). [↩]
- W. He, J. Zhang, R. Guo, C. Pei, H. Li, S. Liu, J. Wei, Y. Wang. Performance analysis and structural optimization of a finned liquid-cooling radiator for chip heat dissipation doi.org/10.1016/j.apenergy.2022.120048 (2022). [↩]
- B. Sun, H. Liu. Flow and heat transfer characteristics of nanofluids in a liquid-cooled CPU heat radiatordoi.org/10.1016/j.applthermaleng.2016.12.108 (2017). [↩]
- M. Haidekker. Water-Cooling a PC https://photonics.engr.uga.edu/watercooling/index.html (2011). [↩]
- CPU Cooler: Liquid Cooling Vs Air Cooling https://www.intel.com/content/www/us/en/gaming/resources/cpu-cooler-liquid-cooling-vs-air-cooling.html. [↩]
- J. Stojkovic, C. Zhang, I. Goiri, R. Bianchini. Rearchitecting Datacenter Lifecycle for AI: A TCO-Driven Framework doi.org/10.48550/ARXIV.2509.26534 (2025). [↩]
- The basics of liquid cooling in AI data centers https://flexpowermodules.com/the-basics-of-liquid-cooling-in-ai-data-centers#:~:text=In%20contrast%2C%20liquid%20cooling%20provides,heat%20exchanger%20is%20still%20necessary. [↩]
- MasterLiquid 240LCore ARGB https://www.coolermaster.com/en-global/products/masterliquid-240l-core-argb/. [↩]
- Prime 95 stress testing software. https://prime95.net/download/. [↩]
- HWInfo monitoring & logging software. https://www.hwinfo.com/download/. [↩]
- GraphPad – P value calculator https://www.graphpad.com/quickcalcs/pvalue1/. [↩]


