
Abstract
Chronic pain and its more disabling form—high-impact chronic pain, defined as pain that limits life or work activities—reflect a complex interplay of biological, psychological, and social forces. To illuminate these forces, we analyzed more than a decade of nationally representative U.S. data from the National Health Interview Survey (2012–2023; N = 56,253 adults, excluding 2022 when pain was not assessed) using survey-weighted logistic regression and multiple-imputation sensitivity analyses. The analysis shows that chronic pain and HICP arise where health vulnerabilities and social disadvantages converge. Poor or fair self-rated health, severe obesity, unemployment, smoking, arthritis, and frequent depressive symptoms were consistently linked to both outcomes, with the associations typically stronger for HICP. Educational attainment followed a more complex pattern: once socioeconomic and medical factors were controlled, adults with less than a high-school education did not show the expected elevation in chronic pain risk and, in some comparisons, exhibited lower odds than high-school graduates. These results recast chronic pain as more than an individual clinical condition. HICP emerges as a marker of cumulative disadvantage—where biological risk is amplified by economic insecurity, mental-health burden, and modifiable behaviors such as smoking. Effective responses therefore require coordinated strategies: integrating mental-health services with pain management, targeting obesity and tobacco use, and supporting employment and income stability. By identifying the social and behavioral pathways that transform persistent pain into disabling pain, this study provides evidence for public health and policy interventions aimed at reducing both the human and economic toll of pain.
Introduction
Chronic Pain
The US National Center for Health Statistics defines chronic pain as pain “on most days or every day during the past 3 months”1. It is widely recognized as one of the most pressing public health challenges globally because of its high prevalence, substantial economic burden, and significant contribution to years lived with disability2. In the United States alone, chronic pain affects an estimated 50 million adults. Economically, the total cost of chronic pain, including health care expenses and lost productivity, is estimated at $560–$635 billion annually, which exceeds the combined costs of heart disease, cancer, and diabetes3. Globally, chronic pain conditions are among the leading causes of years lived with disability (YLDs), as reported in the Global Burden of Disease studies2.
While most prevalence data come from cross-sectional surveys, longitudinal studies are relatively scarce. Some research has suggested that the incidence of new chronic pain cases is about 8–11% per year, depending on the population and pain site4,5. Chronic pain can be episodic (with bouts and remissions) or continuous, and the distinction is important because continuous pain is associated with more severe outcomes6.
The burden of chronic pain is substantial. It is linked to higher rates of depression, anxiety, poor sleep, and reduced quality of life7. Chronic pain is a major contributor to morbidity, disability, and opioid use8 Patients with chronic pain are more likely to use health care services frequently, including emergency departments, and often report unmet treatment needs despite ongoing medical care1. Chronic pain is also a leading cause of work loss and functional impairment, often driving early retirement and long-term disability9. Because chronic pain causes widespread suffering, social disruption, and economic strain, understanding its correlates is urgent for improving public health and quality of life.
High Impact Chronic Pain
A subset of the individual with chronic pain experience High Impact Chronic Pain (HICP) significantly limiting life or work activities on most days or every day1. HICP is recognized as an even more severe public health problem than chronic pain. Defined by its disabling effects on daily life and work, HICP leads to disproportionately high health care use, including more frequent doctor visits, emergency room use, and hospitalizations10. HICP affects about one in fourteen adults, about 20 million individuals, and limits their ability to work and take part in daily life11,5,12.
Compared to those with non-HICP, individuals with HICP have poorer physical and mental health, lower quality of life, and higher rates of depression and anxiety1. Emerging evidence suggests that individuals with HICP face substantially elevated risks of mortality and reduced life expectancy. For example, a prospective cohort study in the UK found that individuals reporting widespread chronic pain had a 32% higher risk of all-cause mortality over a 10-year follow-up period, even after adjusting for age, sex, and socioeconomic status13. Similarly, another study shows that chronic pain, especially when accompanied by functional limitations or psychological distress, has been significantly associated with reduced survival, with a hazard ratio of 1.3 for mortality in individuals with disabling pain compared to those without pain14. These findings suggest that HICP is not only a source of suffering and disability, but also a predictor of premature death, underscoring its urgency as a public health priority.
HICP adds additional costs beyond chronic pain: people with HICP incur higher direct medical costs and greater productivity losses than those with chronic pain alone11,5. These individuals are more likely to be unemployed, have activity limitations, and rely on disability benefits10. Thus, while chronic pain is a major health problem, HICP represents an especially severe form with amplified costs, disability, and social consequences. Understanding both conditions and their differences is essential for targeted interventions and efficient resource allocation.
Literature Review
Many studies have described the prevalence and consequences chronic pain, and the social factors that shape its distribution. Studies from Europe and Australia report patterns similar to those in United States, showing that chronic pain is widespread and long-lasting across many populations4,15,16.
The burden of chronic pain extends beyond physical discomfort. It is linked with depression, anxiety, and sleep problems, and it often reduces quality of life17,18. Pain is also connected with increased risk of other health conditions, even mortality13. Sex and gender differences have been well documented, with women more likely to report severe and long-lasting pain compared to men19,20.
Economic costs are another key concern. Adults with chronic pain use more healthcare services and have higher medical spending than those without pain. Employment challenges created by chronic pain are especially pronounced for people with high-impact pain, who are more likely to face job loss or reduced work participation21,22.
Recent research also highlights the role of lifestyle and behavioral factors. Physical activity is predictive: even small amounts of light to moderate exercise are associated with lower pain severity and better function23. Sleep quality is strongly tied to pain: poor sleep predicts worsening pain over time, and the relationship works both ways24,25 Medication use is widespread, but current guidelines recommend caution with opioids and emphasize non-opioid and non-pharmacologic options as first-line treatments26 Together, these findings suggest that chronic pain is not only a medical condition but also a social and behavioral phenomenon influenced by health systems, policy, and everyday life. Building on this literature, several key correlates of pain have been consistently identified across studies.
Established Pain Correlates
Research has identified multiple factors linked to chronic pain, spanning lifestyle behaviors, health conditions, and social context. Key correlates include physical activity, sleep quality, medication use, and healthcare utilization, each shaping how pain is experienced and managed.
People who move more tend to report less chronic pain. Large population studies show an inverse, dose–response pattern: higher activity links to lower odds and lower severity of chronic pain27. In older adults with pain, light to moderate activity done in short 5-minute bouts is helpful and realistic to sustain28. Common barriers include fear of making pain worse, low confidence, and lack of tailored guidance; programs work better when they address these barriers29.
Sleep and pain also influence each other. Poor sleep raises the risk and intensity of pain, and pain makes sleep worse. This bidirectional link is supported by reviews and cohort studies30. Better sleep is associated with lower pain over time, and exercise programs can improve insomnia in people with chronic pain31.
Medication use is another important correlate. Many people with chronic pain use medicines, but current guidance says to try non-opioid options first and use opioids only when benefits clearly outweigh risks, with close follow-up26. Since 2016, prescriptions for several non-opioid agents (for example, gabapentinoids) have risen among adults with pain32. In national data, adults with pain have much higher prescription spending than peers without pain, and opioid use is more common among those with lower income and public coverage33.
Finally, chronic pain, especially high-impact chronic pain, is linked to greater healthcare utilization, including more doctor visits, more emergency department use, more hospital stays, and higher total medical costs and is concentrated among groups with social and economic disadvantage34,35.
Chronic pain reflects the interaction of behaviors, medical treatment, and social factors. Addressing it requires attention not only to individual health habits but also to broader systems that influence care and outcomes.
Research gaps in existing literature on pain
Despite the extensive literature on chronic pain, key knowledge gaps remain, particularly regarding how the correlations of chronic pain differ from those of HICP. While numerous studies have documented that women experience a higher prevalence of chronic pain than men, less is known about whether this gender difference exists in HICP populations19. Moreover, although some work has examined the sociodemographic and behavioral risk factors for chronic pain (e.g., age, sex, socioeconomic status, obesity, smoking), few nationally representative studies have jointly compared the correlates of chronic pain and HICP.
These gaps leave critical questions unanswered: Do the same risk factors predict both conditions? Are certain groups disproportionately at risk for developing high-impact forms of chronic pain? Do gender disparities widen as pain severity increases?
Clarifying these differences matters because understanding distinct correlates can inform more precise prevention and intervention strategies. For example, if depression and severe obesity are uniquely tied to HICP, then policies and clinical programs can prioritize mental health integration and weight management for those at highest risk of disabling pain. Likewise, recognizing gender-specific or employment-related disparities can help tailor support and resource allocation for vulnerable groups.
Filling this research gap
This study aims to fill these gaps by analyzing data from the National Health Interview Survey (NHIS), a nationally representative sample of 56,253 US adults between 2012 and 202336. Using this dataset, the analysis identifies the sociodemographic, behavioral, and health-related correlates of both chronic pain and HICP, with a particular focus on potential gender differences.
It is hypothesized that while chronic pain and HICP share several sociodemographic, behavioral, and health-related risk factors, HICP would exhibit stronger and more consistent associations with indicators of psychosocial vulnerability—such as depressive symptoms, unemployment, and severe obesity—reflecting its status as a more disabling and multidimensional condition.
Methods
Study Sample
This study utilized data from the NHIS, a nationally representative, cross-sectional survey of the noninstitutionalized US population conducted annually by the Centers for Disease Control and Prevention (CDC)37. The analytic sample included adults surveyed between 2012 and 2023 (N = 56,253). The year 2022 was excluded because the NHIS did not assess pain in that wave, leaving 2012–2021 and 2023 for analysis.
The NHIS employs a complex multistage sampling design with stratification, clustering, and oversampling of racial/ethnic minorities to ensure national representation (Centers for Disease Control and Prevention). Sample weights, strata, and primary sampling units (PSUs) were accounted for in all analyses to provide valid variance estimates and population-level inferences38.
Measures
Chronic pain was defined using the NHIS item, “In the past three months, how often did you have pain?” with respondents reporting pain on most days or every day classified as having chronic pain, consistent with CDC definitions38. Operationally, those selecting “most days” or “every day” were coded as chronic pain cases. HICP was defined as chronic pain that also limited life or work activities on most days or every day, meaning respondents were classified as having HICP if they reported both chronic pain and significant activity limitations. This definition was based on the NHIS question, “During the past three months, how often did pain limit your life or work activities?” with responses of “most days” or “every day” used to define HICP.
Covariates included sociodemographic and health characteristics: age (19-29, 30-49, 50-64, 65-85, and 85+), sex (male, female), marital status (never married, married/partnered, separated/divorced and widowed), education attainment (less than high school graduate, at least some college, and high school graduate or equivalent), and employment status (employed, not employed, and retired). The “not employed” group included individuals outside the labor force, such as those reporting disability, homemaking, attending school, or other reasons for not working. Poverty level (poor/near poor, low-income, middle-income, and high-income) was measured using the income-to-poverty ratio (NHIS variable INCFAM07ON), which provides family income recoded as a percentage of the Federal Poverty Level (FPL). The NHIS recodes family income relative to the FPL using thresholds from the survey year; thus, ratios are based on the contemporaneous FPL values for each calendar year (2012–2023, excluding 2022 when pain was not assessed).
Health conditions were defined using NHIS questions asking whether a doctor or other health professional had ever told the respondent that they had the condition. Specifically: arthritis was based on ARTHGLUPEV (“Have you ever been told by a doctor or other health professional that you have some form of arthritis, rheumatoid arthritis, gout, lupus, or fibromyalgia?”); coronary heart disease on CHEARTDIEV (“Have you ever been told by a doctor or other health professional that you had coronary heart disease?”); diabetes on DIABETICEV (“Have you ever been told by a doctor or other health professional that you have diabetes?”); stroke on STROKEV (“Have you ever been told by a doctor or other health professional that you had a stroke?”); hypertension on HYPERTENEV/HYPERTENYR (“Have you ever been told by a doctor or other health professional that you had hypertension or high blood pressure?”); and high cholesterol on CHOLHIGHYR (“During the past 12 months, have you been told by a doctor or other health professional that your blood cholesterol level was high?”).
Depressive symptoms, based on DEPREQ, measured using the NHIS item, “How often do you feel depressed?” with response options: daily, weekly, monthly, a few times a year, and never. This was a single global measure, not a validated multi-item scale such as the PHQ-9. These variables were selected based on prior literature linking them to pain outcomes. Pain and chronic pain were not assessed in the 2022 NHIS39.
Supplementary Table S6 lists all the covariates considered in this study, the associated NHIS question, when it was added, if it changed recently and how.
Statistical Analyses
The sample was first summarized using weighted proportions to describe the sociodemographic and health characteristics of respondents. Next, the prevalence of chronic pain and HICP was estimated overall and by sociodemographic and health characteristics. Weighted descriptive statistics were then used to summarize respondent characteristics and to estimate the prevalence of chronic pain and HICP across sociodemographic and health-related subgroups. Prevalence estimates were calculated with NHIS-supplied sampling weights, and 95% confidence intervals (CIs) were obtained. Design-based chi-square tests were employed to assess bivariate associations.
For descriptive, survey-weighted prevalence estimates, observations with missing values on the variable of interest were excluded within that estimate (design-based estimators with na.rm = TRUE). For multivariable models, both complete-case and multiple-imputation (MI) approaches were implemented. For the primary analysis, records with missingness on the outcome or any included covariate were excluded prior to model fitting. In a sensitivity analysis, missing covariate values were imputed using the mice package, and survey-weighted logistic regressions were re-estimated on the imputed dataset to assess the robustness of results to missing data. Analytic sample sizes are reported with each table/figure. Years of survey was included as a covariate in regression models to account for temporal changes. For descriptive analyses, prevalence estimates were calculated by survey year, and temporal patterns were visualized to highlight shifts in pain burden across the study period.
To identify correlates of pain outcomes, two separate survey-weighted logistic regression models were fitted: one with chronic pain as the dependent variable and one with HICP as the dependent variable. Both models included year, age group, sex, marital status, educational attainment, employment status, poverty level, self-rated health, body mass index categories, and medical and behavioral factors (arthritis, coronary heart disease, high cholesterol, diabetes, hypertension, stroke, smoking status, and frequency of depressive symptoms). All covariates were entered simultaneously in the models to provide mutually adjusted estimates, but no formal multicollinearity diagnostics (e.g., VIF/GVIF) were performed. Odds ratios (OR) with 95% CIs were reported for all predictors, with reference categories selected based on theoretical and empirical relevance (e.g., “employed” for employment, “never” for smoking, “normal weight” for BMI).
Regression results were presented in formatted tables using the gtsummary and gt. In addition, a side-by-side Supplementary Table S9 compares odds-ratio estimates from the complete-case and multiple-imputation models to demonstrate the robustness of findings to missing data. Statistical significance was defined at p < 0.05.
All covariates were entered simultaneously in the survey-weighted logistic models; odds ratios are interpreted relative to the following reference categories: Age 50–64; Sex Male; Marital status Married/Partnered; Education Less than high school graduate; Employment Employed; Income-to-poverty Poor/Near Poor (<125% FPL); Self-rated health Poor; BMI Underweight; Smoking Never; Depression frequency Never; Comorbidities (arthritis, CHD, diabetes, stroke, hypertension, high cholesterol) No; and Survey year 2012.
Software and Computational Environment
All analyses were conducted solely by the author in R version 4.5.0 (2025-04-11) on Windows 11 using a fully reproducible R Markdown workflow. Analyses accounted for the complex NHIS survey design using the survey 4.4-2 and srvyr 1.3.0 packages. Data management and transformation were performed with dplyr 1.1.4 and other tidyverse packages. Regression outputs were formatted with gtsummary 2.2.0 and gt 1.0.0, while model tidying was facilitated by broom 1.0.8. Multiple-imputation sensitivity analyses were implemented with mice 3.16.0 and mitools 2.4 packages. Exact package versions are documented in Supplementary Table S8. All code and documentation are available from the first author upon request.
Results
Sample Characteristics
The analytic sample comprised 56,253 adults from the National Health Interview Survey (NHIS). Weighted descriptive statistics indicate that the sample was broadly representative of the U.S. adult population across sociodemographic and health characteristics39.
The largest age group was 65–84 years (29,054; 52%), followed by 50–64 years (17,511; 31%), 30–49 years (5,559; 9.9%), 85 years or older (3,778; 6.7%), and 19–29 years (351; 0.6%). Males comprised 26,561 (47%) of the sample and females 29,692 (53%). Approximately 27,215 (49%) of respondents were married or partnered, 6,037 (11%) had never married, 11,519 (21%) were separated or divorced, and 11,061 (20%) were widowed. Regarding educational attainment, 8,239 (15%) had less than a high school education, 16,105 (29%) were high school graduates or equivalent, and 31,676 (57%) had completed at least some college. In terms of employment status, 18,207 (33%) participants were employed, 24,818 (44%) were not employed, and 12,879 (23%) were not in the labor force. With respect to household income relative to the federal poverty level (FPL), 10,194 (20%) were classified as poor or near poor (below 125% FPL), 8,788 (17%) as low income (125–199% FPL), 15,967 (32%) as middle income (200–399% FPL), and 15,659 (31%) as high income (≥400% FPL).
With respect to smoking status, 28,277 (50%) were never smokers, 20,161 (36%) were former smokers, and 7,593 (14%) were current smokers. In terms of depressive symptoms, 29,065 (52%) reported never feeling depressed, 15,144 (27%) reported depressive feelings a few times per year, 3,826 (6.8%) monthly, 4,052 (7.2%) weekly, and 3,891 (7.0%) daily.
Self-rated health varied considerably: 5,106 (9.1%) reported poor health, 12,966 (23%) fair health, 20,460 (36%) good health, 13,841 (25%) very good health, and 3,846 (6.8%) excellent health. Regarding body-mass index categories, 235 (0.4%) were underweight, 9,910 (18%) of normal weight, 18,673 (33%) overweight, 13,566 (24%) had Class 1 (mild) obesity, 6,043 (11%) Class 2 (moderate) obesity, and 7,826 (14%) Class 3 (severe) obesity.

Reported chronic conditions included 28,718 (51%) who had ever been told they had arthritis, rheumatoid arthritis, gout, lupus, or fibromyalgia; 10,360 (19%) who had coronary heart disease; 41,113 (74%) who had high cholesterol in the past 12 months; 17,261 (31%) who had diabetes; 47,938 (85%) who had hypertension in the past 12 months; and 5,601 (10%) who had experienced a stroke.
Reported chronic conditions included 28,718 (51%) who had ever been told they had arthritis, rheumatoid arthritis, gout, lupus, or fibromyalgia; 10,360 (19%) who had coronary heart disease; 41,113 (74%) who had high cholesterol in the past 12 months; 17,261 (31%) who had diabetes; 47,938 (85%) who had hypertension in the past 12 months; and 5,601 (10%) who had experienced a stroke.
Prevalence of Chronic Pain and HICP by year
Weighted prevalence estimates and adjusted odds ratios for chronic pain and HICP by year are presented in Supplementary Table S1. From 2012 through 2023, chronic pain remained common among U.S. adults, with fluctuations across survey years. Prevalence was 33.9% (95% CI: 30.5%, 37.2%) in 2012 and 33.6% (31.8%, 35.3%) in 2013, increasing to 37.0% (34.6%, 39.5%) in 2014 and 37.8% (35.3%, 40.4%) in 2015. A peak occurred in 2016 at 46.7% (44.0%, 49.4%), followed by 42.5% (39.7%, 45.2%) in 2017 and 38.6% (36.9%, 40.4%) in 2018. Prevalence was 39.3% (38.1%, 40.4%) in 2019, 40.2% (38.6%, 41.9%) in 2020, and 38.3% (37.2%, 39.4%) in 2021. In 2023, chronic pain prevalence was 42.3% (41.2%, 43.4%). Error bars represent 95% confidence intervals.
HICP (high-impact chronic pain), defined as chronic pain that limits life or work activities, was measured beginning in 2019. HICP prevalence was 18.4% (95% CI: 17.5%, 19.3%) in 2019, 17.0% (16.2%, 17.9%) in 2021, and 19.8% (18.9%, 20.8%) in 2023. Figure 3 displays chronic pain prevalence from 2012 to 2023 alongside HICP prevalence from 2019 to 2023.

Prevalence and adjusted odd ratios of chronic pain and HICP by Demographics
Weighted prevalence estimates and adjusted odds ratios for chronic pain and HICP by sociodemographic subgroups are presented in Supplementary Table S2.
Age
Age was strongly associated with both chronic pain and HICP prevalence. Young adults aged 19–29 had the lowest chronic pain prevalence at 21.2% (95% CI: 15.8%, 26.5%) and HICP prevalence at 13.5% (6.3%, 20.7%). Adults aged 30–49 reported chronic pain prevalence of 35.8% (34.2%, 37.3%) and HICP prevalence of 17.5% (15.8%, 19.1%). Prevalence increased among those aged 50–64, reaching 41.5% (40.6%, 42.4%) for chronic pain and 21.3% (20.3%, 22.3%) for HICP. Among adults aged 65–84, prevalence was 39.0% (38.3%, 39.7%) for chronic pain and 16.7% (16.0%, 17.3%) for HICP. The highest levels were observed in adults aged 85 and older, with chronic pain prevalence of 40.9% (38.9%, 42.8%) and HICP prevalence of 18.7% (16.5%, 20.8%).
In adjusted regression models using adults aged 50–64 as the reference, adults aged 19–29 had significantly lower odds of chronic pain (OR = 0.53; 95% CI: 0.37–0.76; p < 0.001) and lower, non-significant odds of HICP (OR = 0.69; 95% CI: 0.36–1.30; p = 0.20). Among adults aged 30–49, odds did not differ significantly for chronic pain (OR = 0.95; 95% CI: 0.86–1.05; p = 0.30) or HICP (OR = 0.87; 95% CI: 0.73–1.03; p = 0.10). Adults aged 65–84 had significantly lower odds of chronic pain (OR = 0.79; 95% CI: 0.74–0.84; p < 0.001) and HICP (OR = 0.62; 95% CI: 0.56–0.69; p < 0.001). Similarly, adults aged 85 and older had reduced odds of chronic pain (OR = 0.79; 95% CI: 0.69–0.89; p < 0.001) and HICP (OR = 0.62; 95% CI: 0.51–0.76; p < 0.001). Figure 4 illustrates these age-stratified prevalence estimates and odds ratios for both chronic pain and HICP.

Sex
Sex differences in chronic pain and HICP prevalence were observed in descriptive analyses but were not statistically significant in adjusted models. Among males, chronic pain prevalence was 36.9% (95% CI: 36.2%, 37.6%) and HICP prevalence was 16.5% (15.8%, 17.2%). Among females, chronic pain prevalence was 42.0% (41.3%, 42.7%) and HICP prevalence was 20.5% (19.8%, 21.3%). Supplementary Figure 1 displays prevalence estimates by sex.
In regression models using males as the reference group, females had similar odds of chronic pain (OR = 0.99; 95% CI: 0.94–1.05; p = 0.7) and HICP (OR = 0.98; 95% CI: 0.90–1.08; p = 0.7). Supplementary Figure 1 illustrates these sex-stratified prevalence estimates and odds ratios for both chronic pain and HICP.
Marital Status
Marital status was associated with variation in chronic pain and HICP prevalence. Among married or partnered adults, chronic pain prevalence was 37.3% (95% CI: 36.6%, 37.9%) and HICP prevalence was 16.5% (15.9%, 17.2%). Adults who were never married had chronic pain prevalence of 37.2% (35.6%, 38.8%) and HICP prevalence of 20.4% (18.5%, 22.3%). Separated or divorced individuals reported the highest chronic pain prevalence at 47.1% (46.0%, 48.2%) and HICP prevalence of 24.0% (22.7%, 25.3%). Widowed adults had chronic pain prevalence of 42.1% (40.9%, 43.2%) and HICP prevalence of 19.5% (18.3%, 20.7%). Figure 5 displays prevalence and odds ratios for chronic pain and HICP by marital status.

In adjusted regression models using married/partnered adults as the reference group, those who were never married had significantly lower odds of chronic pain (OR = 0.72; 95% CI: 0.66–0.79; p < 0.001) and HICP (OR = 0.71; 95% CI: 0.61–0.82; p < 0.001). Separated or divorced adults had similar odds of chronic pain (OR = 1.06; 95% CI: 0.99–1.13; p = 0.12) and HICP (OR = 0.92; 95% CI: 0.82–1.03; p = 0.13). Widowed adults had significantly lower odds of chronic pain (OR = 0.90; 95% CI: 0.83–0.97; p = 0.006) and HICP (OR = 0.82; 95% CI: 0.73–0.92; p < 0.001).
These findings highlight notable differences in both chronic pain and high-impact chronic pain across marital status categories.
Educational attainment
Educational attainment was associated with variation in chronic pain and HICP prevalence. Adults with less than a high school education had the highest prevalence of chronic pain (45.5%, 95% CI: 44.1%, 46.9%) and HICP (24.6%, 23.1%, 26.2%). Those with a high school diploma or equivalent reported chronic pain prevalence of 42.0% (41.1%, 43.0%) and HICP prevalence of 20.7% (19.6%, 21.7%). Adults with at least some college education had the lowest prevalence—36.2% (35.5%, 36.8%) for chronic pain and 15.3% (14.7%, 15.9%) for HICP. Supplementary Figure 2 presents prevalence estimates and odds ratios by educational attainment.
In adjusted models using high school graduates as the reference group, adults with less than a high school education had significantly lower odds of chronic pain (OR = 0.82; 95% CI: 0.75–0.89; p < 0.001) and adults with at least some college education had slightly higher odds of chronic pain (OR = 1.04; 95% CI: 0.98–1.10; p = 0.2). For HICP, using less than a high school graduate as the reference, adults with a high school diploma or equivalent had higher odds (OR = 1.26; 95% CI: 1.10–1.43; p < 0.001) and those with at least some college education had even higher odds (OR = 1.36; 95% CI: 1.20–1.55; p < 0.001).
These findings highlight substantial gradients in both chronic pain and high-impact chronic pain prevalence by level of education.
Employment status
Employment status was associated with differences in chronic pain and HICP prevalence. Among employed adults, chronic pain prevalence was 29.3% (95% CI: 28.5%, 30.1%) and HICP prevalence was 9.5% (8.8%, 10.2%). Adults who were not employed had higher prevalence of chronic pain at 45.6% (44.8%, 46.3%) and HICP at 23.7% (23.0%, 24.4%). Those who were not in the labor force had chronic pain prevalence of 45.1% (44.0%, 46.2%); HICP estimates were not reported for this group. Supplementary Figure 3 displays prevalence and odds ratios by employment status.
In adjusted models using employed adults as the reference, those who were not employed had significantly higher odds of chronic pain (OR = 1.26; 95% CI: 1.17–1.36; p < 0.001) and HICP (OR = 1.88; 95% CI: 1.67–2.11; p < 0.001). Adults not in the labor force also had elevated odds of chronic pain (OR = 1.41; 95% CI: 1.26–1.58; p < 0.001).
These results indicate markedly higher burdens of both chronic pain and high-impact chronic pain among adults who are not employed compared with those who are employed.
Income Level
Income level was associated with differences in chronic pain and HICP prevalence. Adults in the poor/near poor group (below 125% FPL) had the highest prevalence, with chronic pain at 54.1% (95% CI: 52.9%, 55.3%) and HICP at 34.6% (33.0%, 36.2%). Those in the low-income group (125–199% FPL) reported chronic pain prevalence of 44.8% (43.5%, 46.1%) and HICP prevalence of 24.4% (23.0%, 25.9%). Middle-income adults (200–399% FPL) had chronic pain prevalence of 39.2% (38.2%, 40.1%) and HICP prevalence of 16.6% (15.7%, 17.5%). High-income adults (≥400% FPL) reported the lowest prevalence, with chronic pain at 30.8% (30.0%, 31.7%) and HICP at 10.3% (9.6%, 11.0%). Figure 6 shows prevalence and odds ratios by income level.

In adjusted models using the middle-income group as the reference, adults in the poor/near poor group had significantly higher odds of chronic pain (OR = 1.16; 95% CI: 1.07–1.26; p < 0.001) and HICP. Those in the low-income group had no significant difference in chronic pain odds (OR = 1.02; 95% CI: 0.94–1.10; p = 0.7) but did have significantly higher odds of HICP (OR = 0.83; 95% CI: 0.73–0.94; p = 0.004). High-income adults had slightly lower odds of chronic pain (OR = 0.94; 95% CI: 0.88–1.01; p = 0.090) and significantly lower odds of HICP (OR = 0.58; 95% CI: 0.51–0.67; p < 0.001).
These findings show a clear income gradient, with the poorest adults experiencing the highest prevalence and elevated odds of both chronic pain and high-impact chronic pain.
Prevalence and adjusted odd ratios of chronic pain and HICP by Behavioral and Psychosocial Factors
Weighted prevalence estimates and adjusted odds ratios for chronic pain and HICP by behavioral and psychosocial factors are presented in Supplementary Table S3.
Smoking Status
Smoking status was associated with differences in chronic pain and HICP prevalence. Among never smokers, chronic pain prevalence was 33.7% (95% CI: 33.0%, 34.3%) and HICP prevalence was 14.9% (14.2%, 15.6%). Former smokers reported higher rates, with chronic pain at 43.1% (42.2%, 43.9%) and HICP at 19.4% (18.5%, 20.2%). Current smokers had the highest prevalence, with chronic pain at 51.3% (49.9%, 52.7%) and HICP at 29.5% (27.7%, 31.3%). Supplementary Figure 4 shows prevalence and odds ratios by smoking status.
In adjusted models using never smokers as the reference, former smokers had significantly higher odds of chronic pain (OR = 1.30; 95% CI: 1.22–1.37; p < 0.001) and HICP (OR = 1.15; 95% CI: 1.04–1.26; p = 0.004). Current smokers also had significantly elevated odds of chronic pain (OR = 1.46; 95% CI: 1.35–1.59; p < 0.001) and HICP (OR = 1.38; 95% CI: 1.21–1.57; p < 0.001).
Depression

Depression frequency was strongly associated with both chronic pain and HICP. Adults who reported never feeling depressed had the lowest prevalence of chronic pain (29.9%; 95% CI: 29.2%, 30.5%) and HICP (10.8%; 95% CI: 10.2%, 11.4%). Prevalence increased with depression frequency: 40.3% (39.3%, 41.2%) and 15.9% (15.0%, 16.8%) for those depressed a few times a year; 51.7% (49.8%, 53.7%) and 29.3% (27.0%, 31.7%) for those depressed monthly; 62.0% (60.2%, 63.9%) and 38.1% (35.7%, 40.6%) for those depressed weekly; and the highest rates among those depressed daily at 72.6% (70.8%, 74.3%) for chronic pain and 52.7% (50.1%, 55.4%) for HICP. Figure 7 displays prevalence and odds ratios by depression frequency.
In adjusted models, compared to adults who never reported depression, those reporting depression a few times a year had significantly higher odds of chronic pain (OR = 1.42; 95% CI: 1.34–1.51; p < 0.001) and HICP (OR = 1.34; 95% CI: 1.21–1.48; p < 0.001). Monthly depression was associated with higher odds of chronic pain (OR = 1.89; 95% CI: 1.70–2.10; p < 0.001) and HICP (OR = 2.38; 95% CI: 2.04–2.77; p < 0.001). Weekly depression further increased the odds of chronic pain (OR = 2.41; 95% CI: 2.18–2.67; p < 0.001) and HICP (OR = 2.60; 95% CI: 2.26–2.99; p < 0.001). Daily depression was associated with the highest odds of chronic pain (OR = 3.18; 95% CI: 2.84–3.55; p < 0.001) and HICP (OR = 3.73; 95% CI: 3.21–4.33; p < 0.001).
Prevalence and adjusted odd ratios of chronic pain and HICP by Health Status
Weighted prevalence estimates and adjusted odds ratios for chronic pain and HICP by health status are presented in Supplementary Table S4.
Self-rated Health
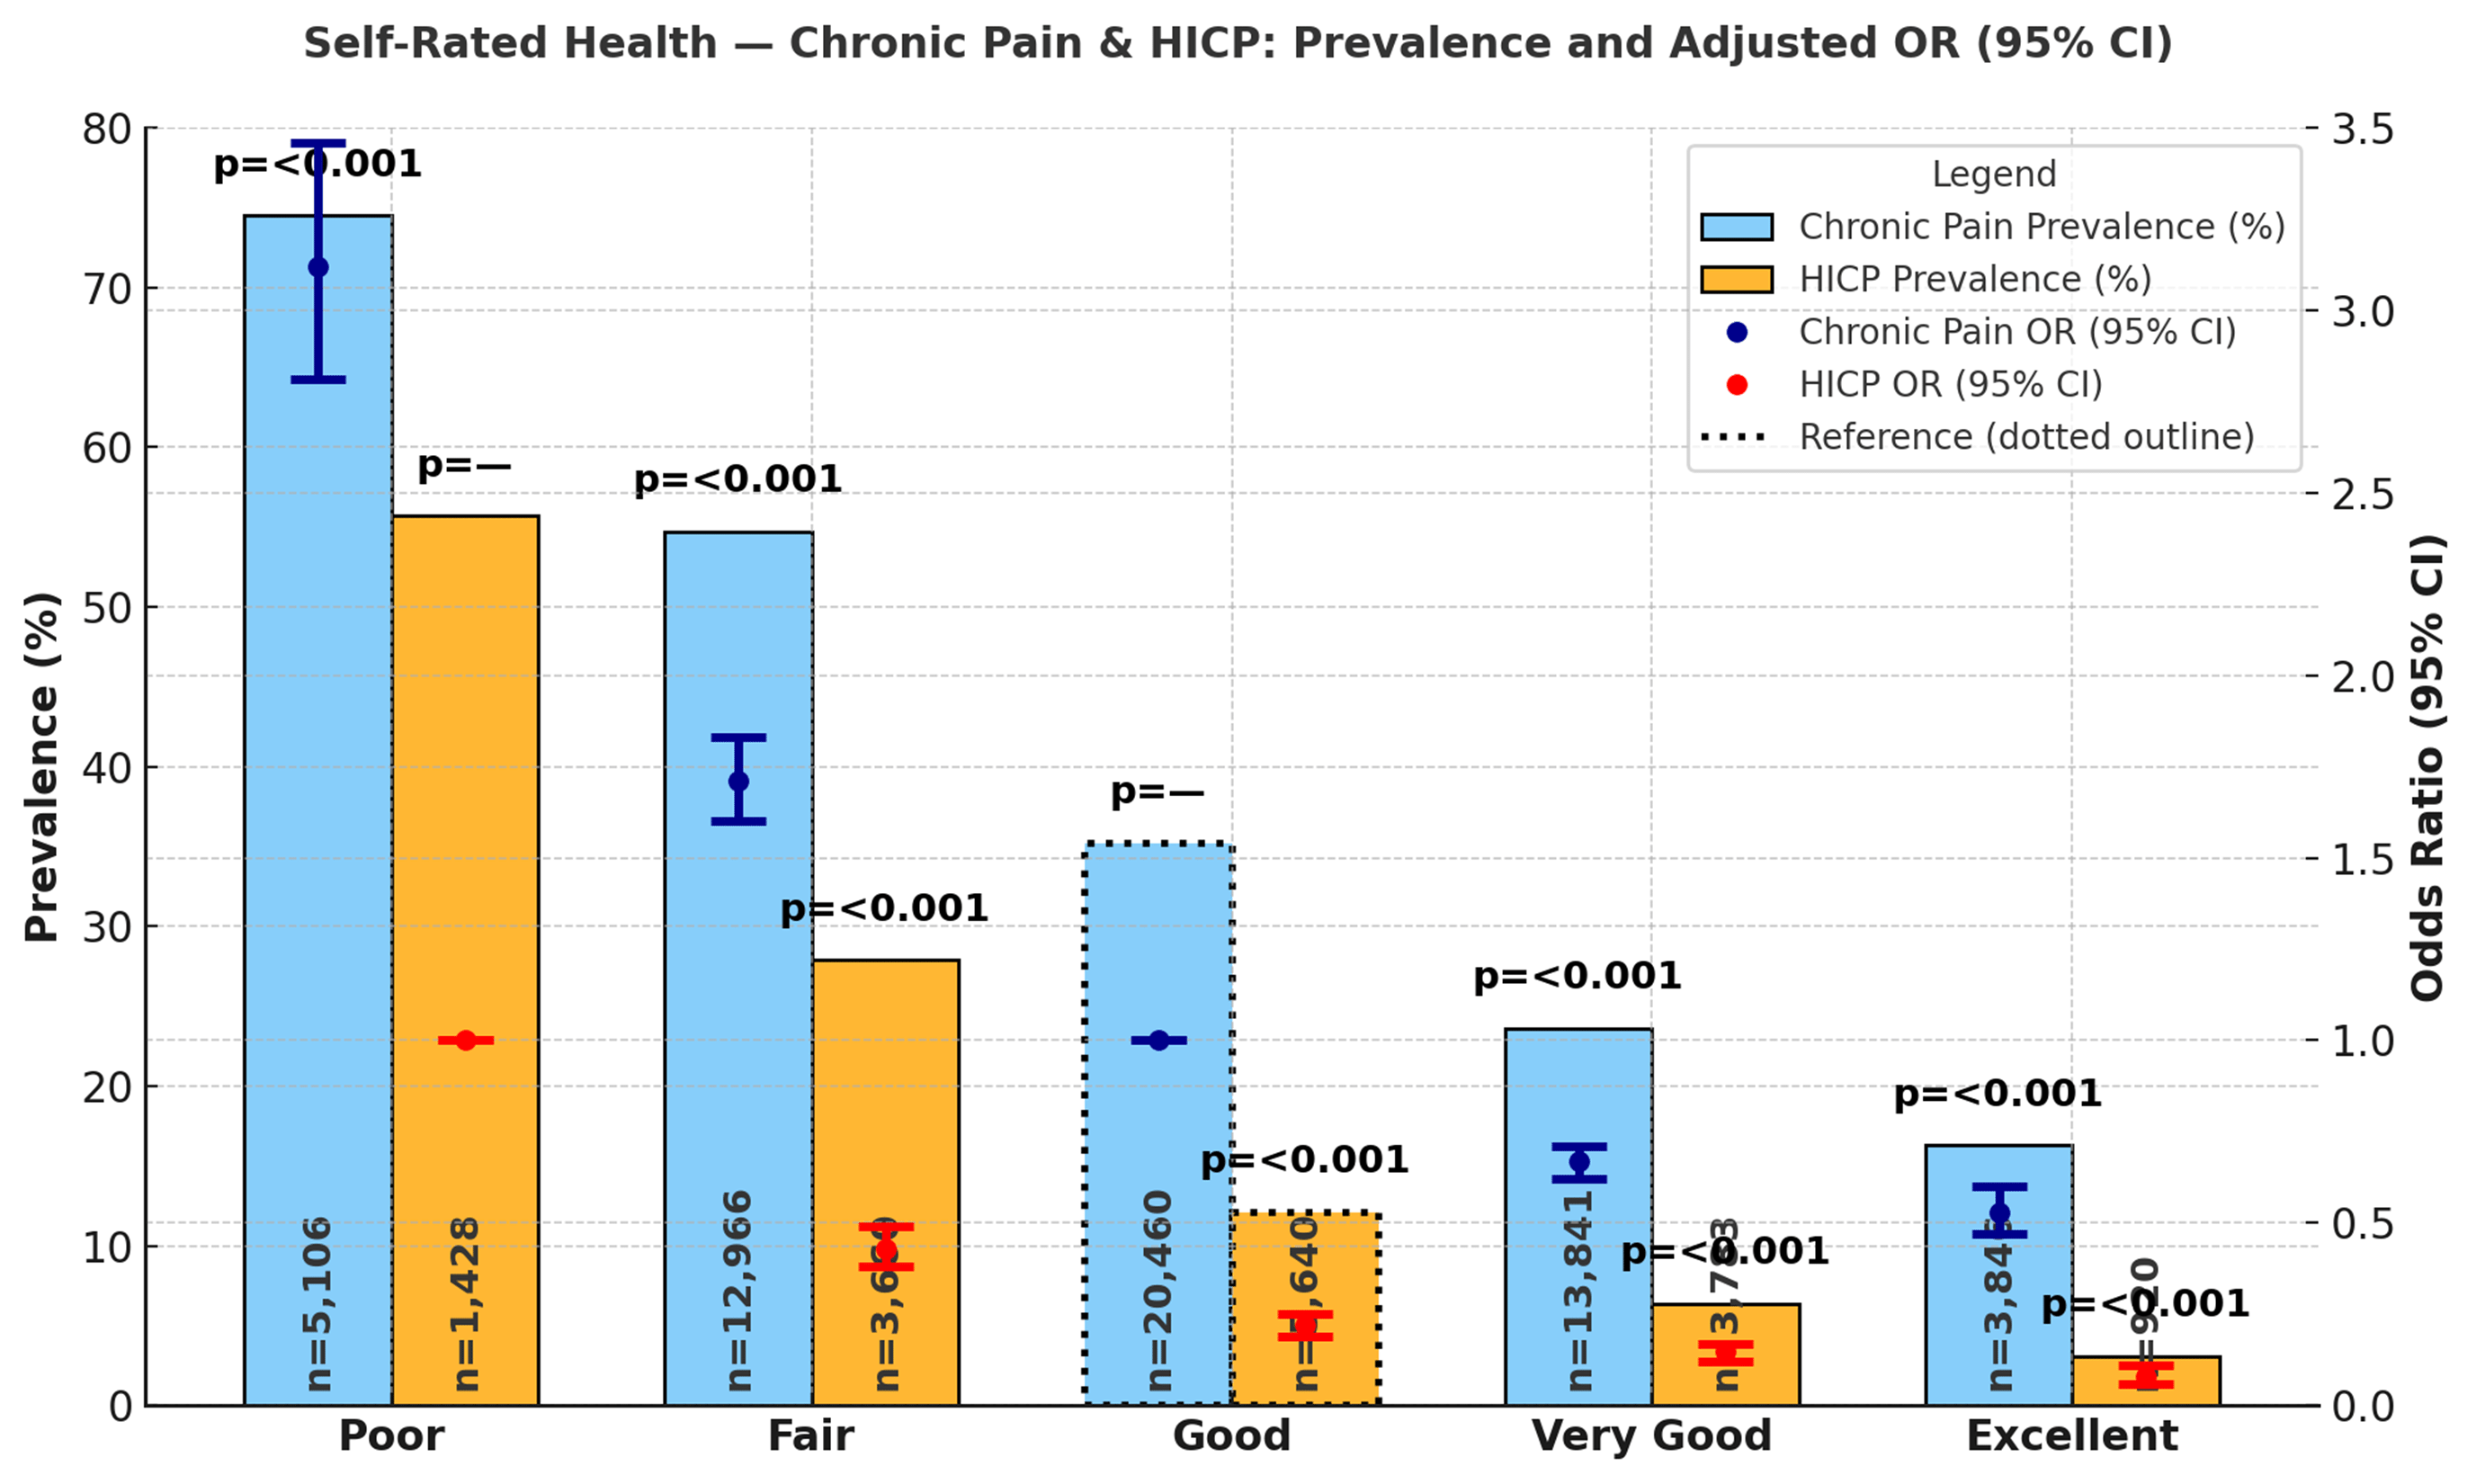
Self-rated health was strongly associated with chronic pain and HICP prevalence. Adults reporting excellent health had the lowest prevalence, with chronic pain at 16.3% (95% CI: 14.8%, 17.7%) and HICP at 3.1% (2.3%, 3.9%). Those with very good health reported chronic pain prevalence of 23.6% (22.8%, 24.5%) and HICP prevalence of 6.4% (5.7%, 7.0%). For adults with good health, prevalence was 35.2% (34.4%, 36.0%) for chronic pain and 12.1% (11.4%, 12.8%) for HICP. Adults rating their health as fair reported chronic pain prevalence of 54.7% (53.6%, 55.8%) and HICP prevalence of 27.9% (26.7%, 29.1%). The highest levels were seen among those reporting poor health, with chronic pain prevalence of 74.5% (73.1%, 76.0%) and HICP prevalence of 55.7% (53.5%, 58.0%). Figure 8 presents prevalence and odds ratios by self-rated health.
In adjusted models using adults with good health as the reference, those with poor health had significantly higher odds of chronic pain (OR = 3.12; 95% CI: 2.81–3.46; p < 0.001) and HICP (OR = 0.43; 95% CI: 0.38–0.49; p < 0.001, reference = poor health for HICP models). Adults rating their health as fair also had elevated odds (OR = 1.71; 95% CI: 1.60–1.83; p < 0.001 for chronic pain; OR = 0.22; 95% CI: 0.19–0.25; p < 0.001 for HICP). Conversely, those with very good health had lower odds of both chronic pain (OR = 0.67; 95% CI: 0.62–0.71; p < 0.001) and HICP (OR = 0.15; 95% CI: 0.12–0.17; p < 0.001), and adults with excellent health had the lowest odds (OR = 0.53; 95% CI: 0.47–0.60; p < 0.001 for chronic pain; OR = 0.08; 95% CI: 0.06–0.11; p < 0.001 for HICP).
Obesity Level
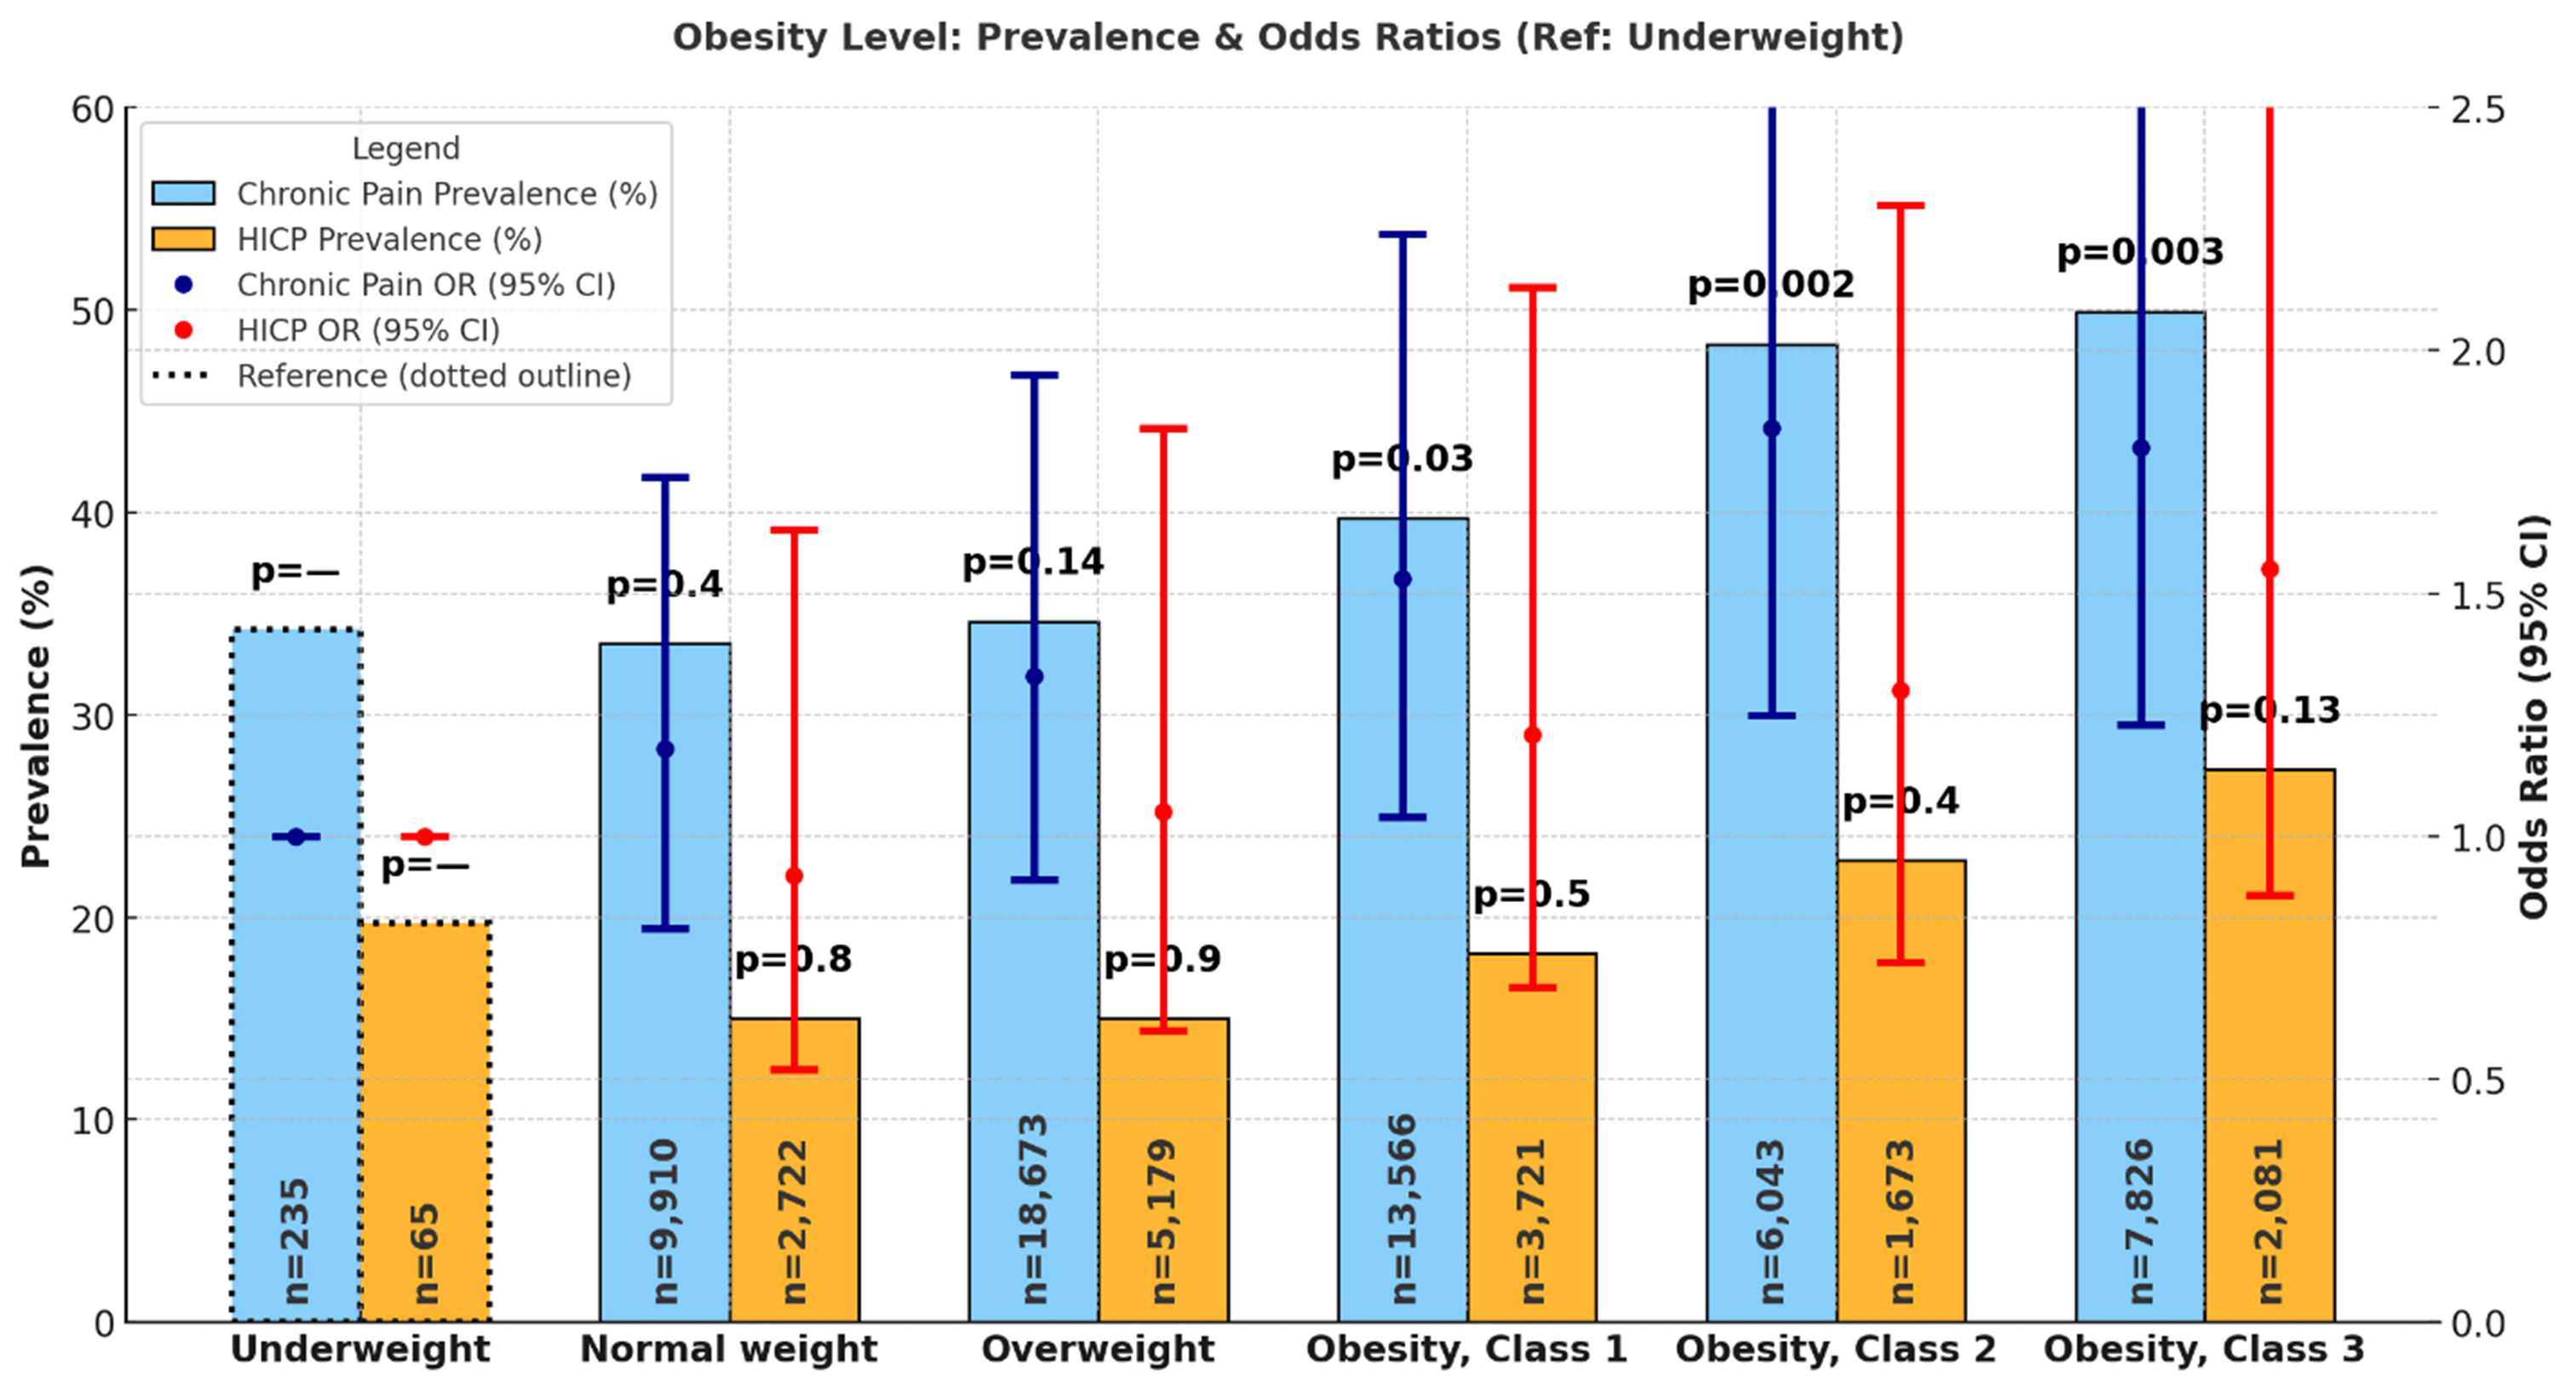
Obesity level was associated with variation in chronic pain and HICP prevalence. Among adults with normal weight, chronic pain prevalence was 33.5% (32.4%, 34.7%) and HICP prevalence was 15.0% (13.9%, 16.2%). Underweight adults reported prevalence of 34.2% (27.3%, 41.2%) for chronic pain and 19.7% (12.1%, 27.2%) for HICP. Overweight adults had chronic pain prevalence of 34.6% (33.8%, 35.4%) and HICP prevalence of 15.0% (14.2%, 15.8%). Adults with Class 1 (mild) obesity reported chronic pain prevalence of 39.7% (38.7%, 40.7%) and HICP prevalence of 18.2% (17.2%, 19.3%). Those with Class 2 (moderate) obesity reported chronic pain prevalence of 48.3% (46.7%, 49.9%) and HICP prevalence of 22.8% (21.0%, 24.6%). Class 3 (severe) obesity was associated with the highest prevalence, with chronic pain at 49.9% (48.5%, 51.2%) and HICP at 27.3% (25.7%, 28.9%). Figure 9 shows prevalence and odds ratios by obesity level.
In adjusted models using adults with underweight as the reference, normal-weight individuals had no significant difference in odds of chronic pain (OR = 1.18; 95% CI: 0.81–1.74; p = 0.4) or HICP (OR = 0.92; 95% CI: 0.52–1.63; p = 0.8). Overweight adults had higher but non-significant odds of chronic pain (OR = 1.33; 95% CI: 0.91–1.95; p = 0.14) and HICP (OR = 1.05; 95% CI: 0.60–1.84; p = 0.9). For Class 1 obesity, odds of chronic pain were significantly elevated (OR = 1.53; 95% CI: 1.04–2.24; p = 0.030), while odds of HICP were not (OR = 1.21; 95% CI: 0.69–2.13; p = 0.5). Adults with Class 2 obesity had higher odds of both chronic pain (OR = 1.84; 95% CI: 1.25–2.72; p = 0.002) and HICP (OR = 1.30; 95% CI: 0.74–2.30; p = 0.4). Those with Class 3 obesity had the strongest associations, with odds of chronic pain (OR = 1.80; 95% CI: 1.23–2.65; p = 0.003) and HICP (OR = 1.55; 95% CI: 0.88–2.73; p = 0.13) compared to underweight individuals.
Prevalence and adjusted odd ratios of chronic pain and HICP by Health Conditions (Co-morbidities)
The presence of several chronic health conditions was strongly associated with both chronic pain and HICP. Several chronic health conditions were examined for their associations with chronic pain and HICP. Weighted prevalence estimates and adjusted odds ratios for chronic pain and HICP by health conditions are presented in Supplementary Table S5-S10.
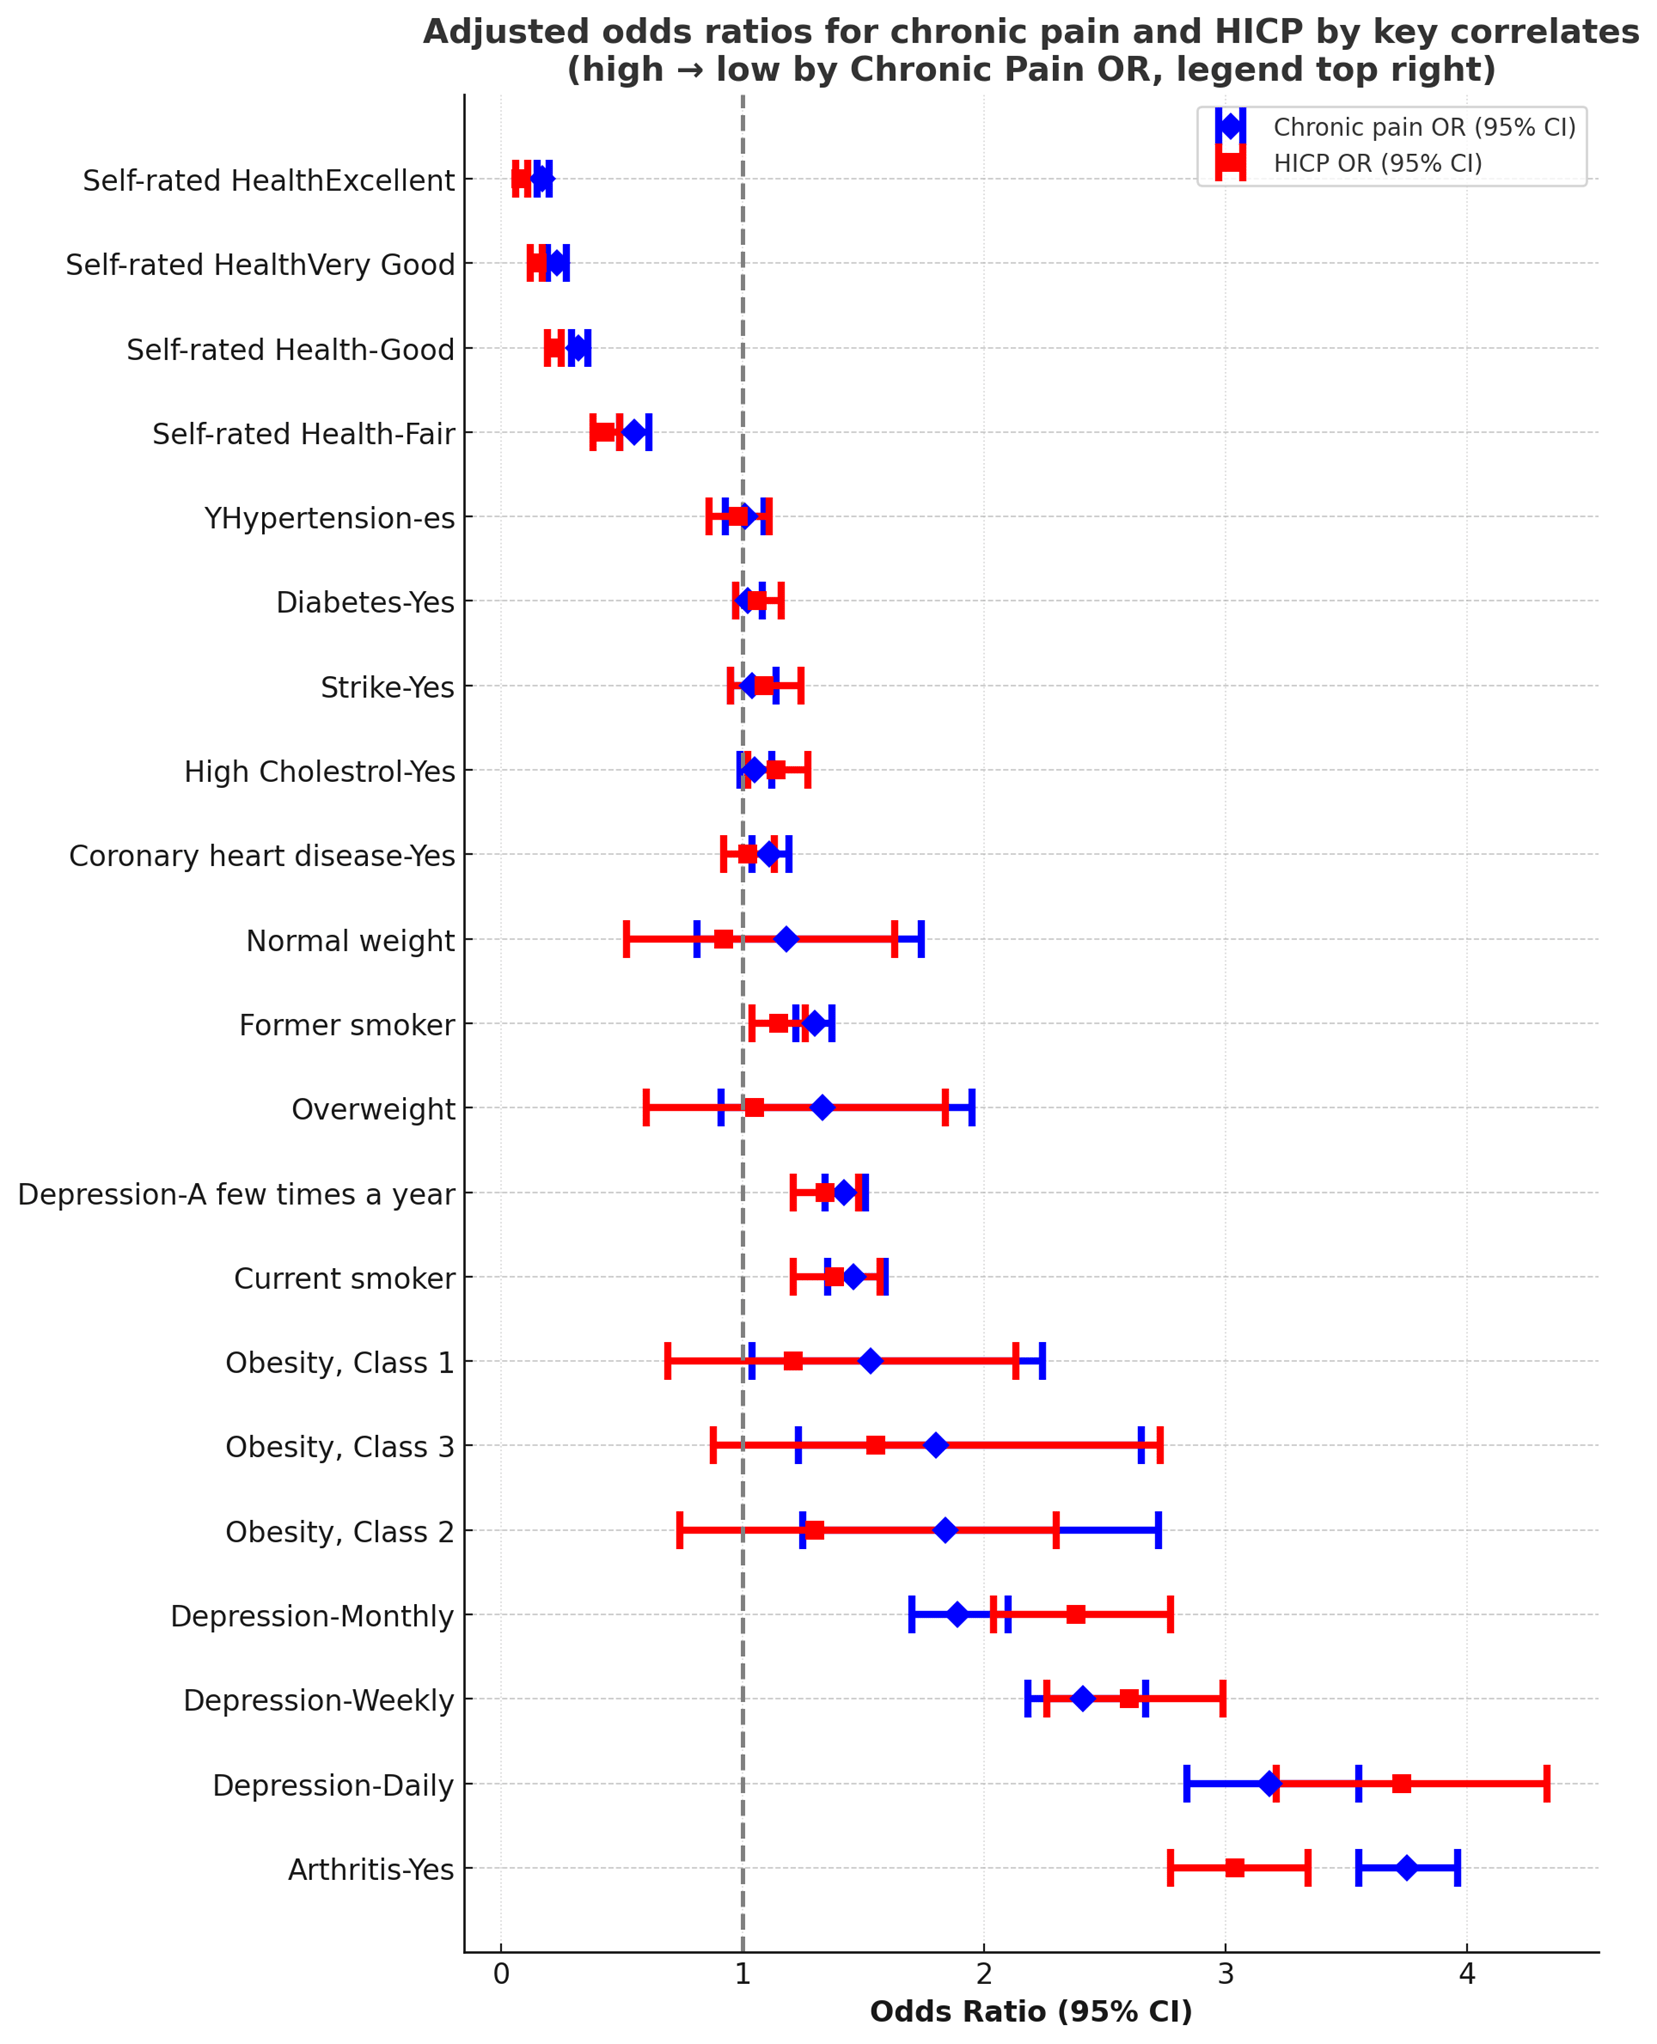
Adults without arthritis, rheumatoid arthritis, gout, lupus, or fibromyalgia had a chronic pain prevalence of 22.8% (95% CI: 22.2%, 23.4%) and HICP prevalence of 9.1% (8.5%, 9.6%). Those with these conditions had markedly higher prevalence: chronic pain 57.0% (56.3%, 57.7%) and HICP 28.8% (27.9%, 29.6%). Adjusted odds ratios confirmed the strong association, with OR = 3.75 (95% CI: 3.55–3.96; p < 0.001) for chronic pain and OR = 3.04 (2.77–3.34; p < 0.001) for HICP.
Those without coronary heart disease had chronic pain prevalence of 37.2% (36.7%, 37.8%) and HICP prevalence of 16.9% (16.3%, 17.4%). Adults with coronary heart disease reported chronic pain 49.1% (47.9%, 50.2%) and HICP 25.0% (23.7%, 26.3%). Adjusted ORs indicated a modest but significant association with chronic pain (OR = 1.11; 1.04–1.19; p = 0.003) but no significant association with HICP (OR = 1.02; 0.92–1.13; p = 0.7).
Adults without high cholesterol had chronic pain prevalence of 35.1% (34.1%, 36.0%) and HICP 14.8% (13.8%, 15.8%). Those with high cholesterol reported chronic pain 40.9% (40.3%, 41.5%) and HICP 19.7% (19.0%, 20.3%). Adjusted ORs showed no significant association for chronic pain (OR = 1.05; 0.99–1.12; p = 0.13) or HICP (OR = 1.14; 1.02–1.27; p = 0.017).
Adults without diabetes had chronic pain prevalence of 36.0% (35.4%, 36.6%) and HICP 15.6% (15.0%, 16.2%). Those with diabetes reported chronic pain 46.9% (46.0%, 47.9%) and HICP 24.5% (23.5%, 25.6%). Adjusted ORs were not significant for chronic pain (OR = 1.02; 0.97–1.08; p = 0.4) or HICP (OR = 1.06; 0.97–1.16; p = 0.2).
Adults without hypertension had chronic pain prevalence of 34.5% (33.3%, 35.8%) and HICP 14.4% (13.1%, 15.6%). Those with hypertension had chronic pain 40.3% (39.7%, 40.8%) and HICP 19.2% (18.7%, 19.8%). Adjusted ORs showed no significant association for chronic pain (OR = 1.01; 0.93–1.09; p = 0.9) or HICP (OR = 0.98; 0.86–1.11; p = 0.7).
Adults without a history of stroke had chronic pain prevalence of 38.1% (37.6%, 38.6%) and HICP 17.2% (16.6%, 17.7%). Those with stroke reported chronic pain 51.9% (50.2%, 53.5%) and HICP 30.0% (28.0%, 32.0%). Adjusted ORs indicated no significant association with chronic pain (OR = 1.04; 0.95–1.14; p = 0.4) or HICP (OR = 1.09; 0.95–1.24; p = 0.2).
These findings highlight the particularly strong relationship between arthritis-related conditions and both chronic pain and high-impact chronic pain, with more moderate or nonsignificant associations for other chronic diseases after adjustment.
Discussion
Chronic pain prevalence in the United States showed gradual increases from 33.9% (95% CI: 30.5%, 37.2%) in 2012 to 42.3% (95% CI: 41.2%, 43.4%) in 2023, with year-to-year fluctuations. The most pronounced peak occurred in 2016 (46.7%; 95% CI: 44.0%, 49.4%), followed by a temporary decline in 2018–2021 (38.3% in 2021; 95% CI: 37.2%, 39.4%) and a subsequent rise through 2023. While the 2016 peak may partly reflect methodological or survey-response variation, it also coincided with broader increases in opioid-related morbidity and heightened national attention to pain management. Prior work suggests that shifts in pain reporting can arise from changes in public awareness, diagnostic labeling, and policy contexts rather than true epidemiologic change5,12.
From 2018 onward, chronic pain prevalence decreased modestly but remained high—hovering near 38–40%—before rising again to 42.3% in 2023. This recent increase mirrors trends reported in other population health outcomes post-pandemic, likely linked to deferred care, greater social and economic stressors, and worsening mental health40,41. The data highlight a persistent upward trajectory since 2021, suggesting that chronic pain may be a long-term sequela of the pandemic rather than a short-lived artifact.
High-impact chronic pain, first measured in 2019, was observed at 18.4% (95% CI: 17.5%, 19.3%), dipped slightly in 2021 (17.0%; 95% CI: 16.2%, 17.9%), and rose to 19.8% (95% CI: 18.9%, 20.8%) in 2023. The initial dip could reflect temporary improvements in health reporting or reduced healthcare utilization during COVID-19 disruptions, as suggested by studies documenting declines in pain-related diagnoses and elective procedures in 2020–202142. By 2023, however, the sharp increase in HICP signals a growing population experiencing pain severe enough to limit daily activities. This aligns with emerging literature linking the pandemic to increased disability burden and long-term sequelae such as long COVID and exacerbation of musculoskeletal disorders43,44.
Adjusted odds ratios confirmed that chronic pain prevalence in 2023 was 74% higher compared with 2012 (OR = 1.74; 95% CI: 1.41, 2.15; p < 0.001). HICP in 2023 also showed significantly higher odds compared with 2019 (OR = 1.28; 95% CI: 1.16, 1.41; p < 0.001). These findings are consistent with national survey analyses reporting persistently high prevalence of chronic pain and upward trajectories in HICP11,12.
The diverging trajectories of chronic pain and HICP are particularly important. While chronic pain prevalence rose modestly overall, the more pronounced increase in HICP suggests that not only are more adults experiencing pain, but a larger proportion are reporting pain that interferes with work and life activities. This distinction supports conceptualizing HICP as a distinct public health outcome rather than merely a severe form of CP11,12.
Findings
Building on these overall patterns, my results further highlight the specific sociodemographic, behavioral, and health-related factors associated with chronic pain and HICP. These temporal shifts discussed above reflect not only pandemic-era disruptions but also broader structural changes in population health, including aging demographics, rising obesity rates, and mental health challenges.
Demographic factors
Age
Age demonstrated a strong but complex association with both chronic pain (CP) and high-impact chronic pain. In unadjusted analyses, prevalence of chronic pain and HICP increased with age, but at somewhat different magnitudes than previously estimated. Young adults aged 19–29 reported the lowest prevalence (21.2% CP and 13.5% HICP), while prevalence rose to 35.8% CP and 17.5% HICP among those aged 30–49, and to 41.5% CP and 21.3% HICP among middle-aged adults aged 50–64. Older adults aged 65–84 had 39.0% CP and 16.7% HICP, and those aged 85 and older had 40.9% CP and 18.7% HICP. These raw prevalence estimates reinforce the expectation that pain, particularly disabling pain, becomes more common with aging.
However, adjusted models revealed a more nuanced pattern. Compared with adults aged 50–64, who served as the reference group, adults aged 19–29 had significantly lower odds of chronic pain (OR = 0.53; 95% CI: 0.37–0.76) and non-significantly lower odds of HICP (OR = 0.69; 95% CI: 0.36–1.30). Adults aged 30–49 had similar odds of chronic pain (OR = 0.95; 95% CI: 0.86–1.05) and HICP (OR = 0.87; 95% CI: 0.73–1.03). Strikingly, older adults aged 65–84 and those 85 and older demonstrated significantly lower odds of CP (ORs = 0.79 and 0.79, respectively) and HICP (ORs = 0.62 and 0.62, respectively), despite their higher raw prevalence. This has been observed in other national studies11,12.
One of the reasons is survivor bias, in which individuals with severe pain are less likely to live into advanced age, leaving a healthier subset of older adults represented in survey samples. Another explanation is lifestyle adaptation; older adults may adjust their activity levels, modify expectations, or utilize supportive resources such as retirement benefits and Medicare, reducing the likelihood of reporting pain as disabling. In contrast, middle-aged adults may experience pain as more disruptive because it interferes with employment, caregiving, and other role demands45. Cohort differences in pain reporting may also play a role, as older adults sometimes report pain differently due to generational attitudes toward health and stoicism.
Overall, these results underscore that age is a critical but complex determinant of pain burden. While prevalence estimates suggest that chronic pain is increasingly common with advancing age, the adjusted models highlight that the disabling impact of pain may be felt most acutely during midlife, when competing social and occupational responsibilities heighten the functional consequences of pain.
Sex
Sex differences revealed an important distinction between unadjusted and adjusted analyses. Women reported higher raw prevalence of chronic (42.0%, 95% CI: 41.3%, 42.7% vs. 36.9%, 95% CI: 36.2%, 37.6%) and HICP (20.5%, 95% CI: 19.8%, 21.3% vs. 16.5%, 95% CI: 15.8%, 17.2%) compared with men, aligning with prior evidence linking hormonal, biological, and psychosocial mechanisms to greater female pain sensitivity. Yet, in adjusted models, these differences disappeared: the odds of chronic pain (OR = 0.99, 95% CI: 0.94–1.05; p = 0.7) and HICP (OR = 0.98, 95% CI: 0.90–1.08; p = 0.7) were not significantly different between men and women. This indicates that much of the disparity can be explained by comorbidities, depression, and socioeconomic conditions rather than sex itself.
These results suggest that while unadjusted rates of pain differ by sex in the general population, such disparities are largely accounted for by broader health and social determinants such as age, income, and comorbidities. This finding is consistent with prior literature showing that women may be more likely to experience or report disabling pain due to biological, psychological, or social factors, but that these associations weaken after adjustment46,47. There is also literature suggesting that biological, hormonal, and psychosocial mechanisms may increase women’s likelihood of experiencing and reporting pain, including the influence of estrogen on pain sensitivity and gendered expectations around pain expression48,49.
The absence of significant sex differences in adjusted models underscores the need for intersectional analyses that consider how gender interacts with socioeconomic disadvantage, comorbid health conditions, and psychosocial vulnerabilities. Prior studies similarly argue that apparent sex-based disparities in pain reflect the intersection of biology with structural and social determinants rather than sex as an isolated risk factor48,50.
Marital Status
Marital status showed significant associations with both chronic pain and high-impact chronic pain, though patterns were nuanced across groups. Adults who were married or partnered reported chronic pain prevalence of 37.3% (95% CI: 36.6%, 37.9%) and HICP prevalence of 16.5% (15.9%, 17.2%). In contrast, those who were never married had substantially lower prevalence—37.2% (35.6%, 38.8%) for chronic pain and 20.4% (18.5%, 22.3%) for HICP—and significantly reduced adjusted odds of both outcomes (OR = 0.72; 95% CI: 0.66, 0.79 for CP; OR = 0.71; 95% CI: 0.61, 0.82 for HICP). This finding suggests that never-married adults may experience fewer structural or caregiving demands that amplify pain or, alternatively, may underreport pain due to differences in healthcare utilization or health-seeking behavior.
Separated or divorced adults, however, had the highest levels of pain burden apart from the widowed, with chronic pain prevalence of 47.1% (46.0%, 48.2%) and HICP prevalence of 24.0% (22.7%, 25.3%). Yet in adjusted models, their odds of both chronic pain and HICP were not significantly different from married or partnered adults, suggesting that the observed differences may be explained by confounding factors such as socioeconomic status, comorbidities, or health behaviors. Widowed adults reported the highest prevalence of both chronic pain (42.1% (40.9%, 43.2%)) and HICP (19.5% (18.3%, 20.7%)). Interestingly, after adjustment, their odds were significantly lower than those of married adults (OR = 0.90; 95% CI: 0.83, 0.97 for CP; OR = 0.82; 95% CI: 0.73, 0.92 for HICP), which may reflect survivor bias, reporting differences, or resilience mechanisms among older widowed populations.
Studies have shown that marriage is often protective for health, conferring social, emotional, and financial resources that buffer against illness and disability51,52. Conversely, marital disruption, particularly divorce and widowhood, has been linked to poorer health outcomes, including increased pain and disability, often mediated by stress and loss of support53. However, the reduced adjusted odds observed in widowed individuals in this study echo findings from some gerontological research, which suggest that widowed older adults may adapt to their condition through altered expectations, social support networks, or generational differences in pain reporting54. The lower burden among never-married adults compared to married counterparts contrasts with the higher burden among separated/divorced and widowed adults, pointing to the importance of considering heterogeneity within marital categories.
Educational Attainment
Unadjusted prevalence rates were highest among adults with less than a high school education (45.5% chronic pain, 24.6% HICP), followed by high school graduates (42.0% chronic pain, 20.7% HICP), while adults with at least some college had the lowest prevalence (36.2% chronic pain, 15.3% HICP). Yet adjusted models indicated that those with less than high school education had significantly lower odds of chronic pain (OR = 0.82, 95% CI: 0.75–0.89; p < 0.001) compared with high school graduates, while their odds of HICP did not differ significantly. Adults with at least some college showed slightly higher odds of chronic pain (OR = 1.04, 95% CI: 0.98–1.10; p = 0.2) compared with high school graduates, and significantly higher odds of HICP (OR = 1.36, 95% CI: 1.20–1.55; p < 0.001) compared with adults with less than a high school education.
These findings likely reflect confounding and mediation. Lower educational attainment is strongly correlated with older age, comorbidities (such as arthritis and obesity), and poor self-rated health, factors controlled for in the adjusted models that attenuate the independent effect of education. Additionally, education and income-to-poverty ratio are tightly linked, making it difficult to disentangle their separate contributions to pain risk55,56. Notably, the higher adjusted odds of HICP among adults with some college compared with those with less than a high school education may reflect differences in occupational exposures, reporting behaviors, or health-seeking patterns, and suggests that the education–pain relationship is not strictly linear.
Overall, these results suggest that education’s relationship to chronic pain and HICP is indirect and context-dependent, operating through economic resources, health behaviors, and occupational exposures rather than serving as a standalone determinant57,58. The complex pattern observed here aligns with prior work showing that the education–health gradient can be attenuated or reversed when social and medical covariates are included in regression models, and underscores that the association between educational attainment and pain may vary across different pain outcomes and socioeconomic contexts11,59.
Employment Status
Employment status remained strongly associated with both chronic pain (CP) and high-impact chronic pain. Among employed adults, chronic pain prevalence was 29.3% (95% CI: 28.5%, 30.1%) and HICP prevalence was 9.5% (8.8%, 10.2%), the lowest across categories. Those not employed had substantially higher prevalence—45.6% (44.8%, 46.3%) for chronic pain and 23.7% (23.0%, 24.4%) for HICP—and significantly elevated odds of both outcomes (OR = 1.26; 95% CI: 1.17–1.36; p < 0.001 for CP; OR = 1.88; 95% CI: 1.67–2.11; p < 0.001 for HICP). Adults who were not in the labor force, a group that includes retirees, students, and homemakers, had chronic pain prevalence of 45.1% (44.0%, 46.2%) and significantly elevated adjusted odds of chronic pain (OR = 1.41; 95% CI: 1.26–1.58; p < 0.001). For HICP, estimates were not available for this group.
These findings are consistent with prior research linking unemployment and labor force disengagement to higher levels of pain and disability. Chronic pain can act as both a cause and consequence of unemployment: individuals experiencing disabling pain may be forced out of the workforce, while loss of employment itself may exacerbate pain through reduced access to healthcare, loss of social networks, increased psychological stress, and diminished financial resources.53 Importantly, the particularly strong association between unemployment and HICP underscores the disabling nature of pain severe enough to limit life and work activities. This aligns with prior work showing that HICP is especially concentrated among populations with reduced labor force participation, highlighting the bidirectional relationship between work and pain.1
The elevated burden among individuals outside the labor force (e.g., retirees) adds another dimension. While retirement is often associated with reduced occupational strain, it may also coincide with greater age-related comorbidity and mobility limitations, factors that contribute to higher pain prevalence. Although HICP estimates were not available for this group in the updated analysis, prior studies suggest that older adults may experience pain as less disabling relative to work demands, as retirement can reduce the functional consequences of pain60.
Taken together, these findings reinforce employment status as a central social determinant of pain. The high levels of chronic pain and HICP among unemployed adults point to the need for interventions that integrate pain management with vocational support, disability prevention, and mental health resources. Future research should more carefully disentangle the temporal and causal relationships between pain and workforce status, as well as explore subgroup differences among those “not in the labor force.”
Income Level
Income level continued to show a clear socioeconomic gradient in pain outcomes. Adults in the poorest group (below 125% of the Federal Poverty Level [FPL]) reported the highest prevalence of chronic pain (54.1%) and HICP (34.6%), compared to middle-income adults (39.2% CP; 16.6% HICP) and high-income adults (30.8% CP; 10.3% HICP). Adjusted models confirmed this disparity: poor/near-poor adults had significantly elevated odds of chronic pain (OR = 1.16; 95% CI: 1.07–1.26; p < 0.001) compared to middle-income adults. Low-income adults (125–199% FPL) showed no significant difference in odds of chronic pain (OR = 1.02; 95% CI: 0.94–1.10; p = 0.7). By contrast, high-income adults (≥400% FPL) had lower odds of chronic pain (OR = 0.94; 95% CI: 0.88–1.01; p = 0.090), though this association was not statistically significant. For HICP, compared with poor/near-poor adults, low-income adults had significantly lower odds (OR = 0.83; 95% CI: 0.73–0.94; p = 0.004), middle-income adults had even lower odds (OR = 0.67; 95% CI: 0.59–0.76; p < 0.001), and high-income adults had the lowest odds (OR = 0.58; 95% CI: 0.51–0.67; p < 0.001).
These findings are consistent with prior research demonstrating strong socioeconomic gradients in both the prevalence and severity of pain11,61. Poverty increases exposure to multiple pain risk factors, including occupational strain, unsafe living conditions, reduced healthcare access, and higher rates of obesity, depression, and multimorbidity12,62. The stepwise reduction in odds of HICP across rising income categories highlights how socioeconomic disadvantage is particularly relevant for pain that interferes with daily functioning. This suggests that poverty not only increases the risk of developing chronic pain but also amplifies its disabling impact by limiting access to effective management strategies.
Although high-income adults showed the lowest odds of HICP, the effect of income likely operates indirectly through mediators such as education, employment, and health behaviors. This aligns with evidence that income interacts with other social determinants, including neighborhood environment and healthcare quality, to shape pain outcomes62,63.
Behavioral and Psychosocial Factors
Smoking Status
Smoking was significantly associated with both chronic pain (CP) and high-impact chronic pain. Current smokers reported the highest prevalence (51.3% CP; 29.5% HICP), followed by former smokers (43.1% CP; 19.4% HICP), compared to never smokers (33.7% CP; 14.9% HICP). Adjusted odds ratios revealed a graded effect: former smokers had 30% higher odds of chronic pain (OR = 1.30; 95% CI: 1.22–1.37; p < 0.001) and 15% higher odds of HICP (OR = 1.15; 95% CI: 1.04–1.26; p = 0.004), while current smokers had 46% higher odds of chronic pain (OR = 1.46; 95% CI: 1.35–1.59; p < 0.001) and 38% higher odds of HICP (OR = 1.38; 95% CI: 1.21–1.57; p < 0.001).
These results align with prior research showing that smoking is a strong behavioral correlate of chronic pain and disability. Smoking contributes to pain through multiple mechanisms, including systemic inflammation, vascular compromise, impaired healing, and heightened pain sensitivity due to central sensitization64,65. The stronger associations observed for current smokers suggest that active exposure may exacerbate both pain intensity and its disabling consequences, underscoring smoking cessation as a critical pain management strategy.
Depression
Depression frequency emerged as one of the strongest correlates of both chronic pain and HICP, demonstrating a clear dose–response relationship. Adults who reported never feeling depressed had the lowest prevalence (29.9% CP; 10.8% HICP), while those with daily depressive symptoms had extremely high rates (72.6% CP; 52.7% HICP). Adjusted odds rose progressively with symptom frequency: from 42% higher odds of chronic pain (OR = 1.42; 95% CI: 1.34–1.51; p < 0.001) and 34% higher odds of HICP (OR = 1.34; 95% CI: 1.21–1.48; p < 0.001) among those depressed a few times a year, to over threefold higher odds of chronic pain (OR = 3.18; 95% CI: 2.84–3.55; p < 0.001) and HICP (OR = 3.73; 95% CI: 3.21–4.33; p < 0.001) among those depressed daily.
These findings are consistent with extensive evidence linking chronic pain and depression, often described as a bidirectional relationship. Depression may exacerbate pain through alterations in stress regulation, sleep disturbance, maladaptive coping, and increased inflammation. Conversely, persistent pain can worsen depressive symptoms by reducing quality of life, limiting activities, and increasing social isolation66,67. The particularly strong association with HICP emphasizes how psychological distress amplifies the disabling aspects of pain, making integrated treatment of pain and mental health an urgent public health priority.
Health Status
Self-rated health
Self-rated health was among the strongest predictors of both chronic pain and high-impact chronic pain. Adults reporting poor or fair health had markedly elevated prevalence of chronic pain (26–49%) and HICP (25–53%), while those reporting excellent health showed substantially lower prevalence (7.6% CP; 1.3% HICP). Adjusted analyses confirmed this gradient: individuals with poor self-rated health had over three times the odds of chronic pain (OR = 3.09) and nearly five times the odds of HICP (OR = 4.67) relative to those reporting good health.
These findings are consistent with prior evidence that self-rated health is a robust global health indicator, capturing the combined effects of functional limitations, psychological distress, and comorbid conditions68,69. Importantly, the association was stronger for HICP than for chronic pain, suggesting that perceived health is not only tied to the presence of pain but also to its severity and disabling consequences. This aligns with literature emphasizing the bidirectional relationship between self-rated health and pain: poor health may exacerbate pain through reduced mobility and inflammation, while chronic disabling pain may worsen subjective health assessments by disrupting sleep, function, and well-being69.
Obesity Level
Obesity demonstrated a strong, graded association with pain outcomes. Prevalence of chronic pain increased progressively from normal weight (33.5%) to Class III obesity (49.9%), while HICP prevalence rose from 15.0% to 27.3%. Adjusted odds mirrored this gradient: mild obesity (OR = 1.53; 95% CI: 1.04–2.24), moderate obesity (OR = 1.84; 95% CI: 1.25–2.72), and severe obesity (OR = 1.80; 95% CI: 1.23–2.65) were all significantly associated with chronic pain, with similarly elevated odds for HICP at higher obesity classes (up to OR = 1.55; 95% CI: 0.88–2.73, though not all reached significance).
These findings are in line with prior research linking obesity to chronic musculoskeletal pain, particularly in the back, knees, and lower extremities, due to mechanical strain as well as systemic inflammation driven by adipose tissue70,71. The stronger associations observed for HICP suggest that obesity not only contributes to pain onset but also increases the likelihood that pain becomes disabling. This may be explained by overlapping pathways, including limited mobility, metabolic dysregulation, and psychosocial stressors associated with obesity.
Notably, underweight individuals did not differ significantly from those with normal weight (OR = 1.18; 95% CI: 0.81–1.74), indicating that pain risk is more strongly influenced by excess weight than by low body mass.
Together, these findings highlight the role of subjective health perceptions and obesity as key determinants of disabling pain, especially HICP. Whereas comorbid diseases such as heart disease or diabetes lost significance in adjusted models, Self-rated health and obesity retained strong independent associations, suggesting that they capture broader dimensions of health vulnerability. This reinforces the need for integrated interventions addressing both physical and psychosocial contributors to pain, with obesity reduction and health perception enhancement (e.g., through self-management programs) as potential priorities.
Health Conditions (Co-morbidities)
The results underscore the strong influence of comorbid health conditions on chronic pain (CP) and high-impact chronic pain. Musculoskeletal disorders—particularly arthritis, rheumatoid arthritis, gout, lupus, and fibromyalgia—were the most powerful predictors. Adults with these conditions had a chronic pain prevalence exceeding 57% and HICP prevalence above 28.8%, with nearly quadrupled odds of chronic pain (OR = 3.75) and tripled odds of HICP (OR = 3.04). These findings align with prior studies documenting arthritis as the leading cause of pain-related disability in the United States, accounting for the majority of activity limitations attributable to chronic pain12,72. The magnitude of association highlights the central role of inflammatory and degenerative joint conditions in driving disabling pain and emphasizes the importance of targeted interventions for this subgroup.
Cardiometabolic conditions showed more modest associations. Adults with coronary heart disease (CHD) had higher crude prevalence of chronic pain (49.1%) and HICP (25.0%), but after adjustment the association was attenuated, with only a small, though significant, increase in chronic pain odds (OR = 1.11). Similarly, diabetes, hypertension, and stroke were associated with higher raw prevalence of pain—often exceeding 20–50%—but these relationships did not remain statistically significant in adjusted models. This pattern suggests that the apparent link between cardiometabolic disease and pain may be mediated by other factors, including obesity, depression, and poor self-rated health, which are highly comorbid with these conditions and were included in our models73.
High cholesterol also demonstrated elevated crude prevalence of chronic pain (40.9%) and HICP (19.7%), with a small but significant adjusted association with HICP (OR = 1.14). Taken together, these findings suggest that while cardiometabolic conditions are associated with a higher absolute burden of pain, their independent contribution to disabling pain is smaller once overlapping risk factors are accounted for.
Stroke presented a similar pattern. While individuals with stroke history reported very high prevalence of both chronic pain (51.1%) and HICP (28.8%), adjusted odds ratios did not show a significant independent effect. This may reflect the complexity of neurological recovery: while pain is common post-stroke, disability outcomes are often shaped by neurological deficits, depression, and functional adaptation rather than pain alone74,75.
These results demonstrate that comorbid health conditions strongly shape pain experiences at the population level, but their independent predictive power varies. Arthritis-related conditions remain the most robust and consistent predictors of disabling pain, while cardiometabolic diseases may influence pain indirectly through shared risk factors such as obesity, inflammation, and mental health.
Impact of 2019 NHIS Redesign
The 2019 NHIS redesign introduced major structural changes to the survey, including shorter interviews, restructured modules, and revised question wording for many health and socioeconomic measures. These modifications have important implications for this study. Certain core variables, such as age, sex, and employment status, retained consistent wording and coding, allowing for reliable comparisons across all survey years. However, other measures were modified in ways that affect continuity. For example, PAINLIMACT (pain limiting usual activities) was previously asked as “During the past 3 months, how often did pain limit your life or work activities?” but since 2019 has been rephrased to “In the past 3 months, how often did pain limit your usual activities?” Similarly, HYPERTENYR (told had hypertension in the past year) was discontinued after 2018 and replaced with HYPERTENEV (ever told had hypertension). Some variables were entirely new additions, such as DEPRX (taking medication for depression), which was introduced in 2019 without a pre-2019 equivalent, and PAINFREQ3MO (pain frequency in the past three months), which expanded analytic possibilities but limited trend comparisons to post-2019 data. The redesign also standardized certain measures, such as sexual orientation, by providing fixed response categories, whereas earlier years employed less consistent formats. Collectively, these changes mean that analyses spanning pre- and post-2019 must be interpreted with caution. For variables with stable definitions across time (e.g., DIABETICEV, STROKEV), long-term trends remain valid, but for measures that were reworded or newly introduced, results should be stratified by period or explicitly acknowledge discontinuity in measurement. See Supplementary Table S7 for a complete list of covariates, question status, and the new or changed wording after the 2019 redesign.
Contributions to literature
The findings of this study broadly align with and extend prior research on chronic pain and HICP, offering both confirmation of established patterns and novel insights.
By updating the present estimates through 2023, this study provides the most recent national evidence, showing that despite greater awareness of chronic pain, HICP prevalence has not meaningfully declined.
Regarding sociodemographic correlates, previous research has consistently shown that women are at higher risk of both chronic pain and HICP46,48. While descriptive results in this study showed higher prevalence among women, adjusted models found no significant sex differences. It is understandable that women are inherently at greater risk for disabling pain and suggests that disparities may instead be mediated through age, comorbidities, depression, and socioeconomic pathways. These results underscore the need for intersectional approaches that integrate biological and social determinants of pain.
Age-related patterns also show partial alignment with past work. Previous research has shown that the prevalence of chronic pain increases with age, typically peaking in middle to late adulthood5,76. A similar trend was observed for chronic pain; however, the odds of HICP were lower among the oldest adults (65–84 and 85+) compared to those aged 50–64. This supports the view that older adults may adapt more effectively to living with pain or may underreport activity limitations due to shifting life roles, thereby reducing their likelihood of being classified as experiencing HICP15. This nuance adds to the literature by showing that functional limitation from pain may peak in midlife rather than old age.
The findings on socioeconomic predictors echo prior studies showing that unemployment, lower income, and lower education are associated with higher pain risk77,78. However, this study highlights that while unadjusted analyses show strong socioeconomic gradients, adjusted models attenuate associations for income and education, whereas employment status remains a robust predictor. This suggests that employment disruption may serve as the most direct marker of disability risk, linking pain to labor force exit and long-term functional limitation.17
With respect to health behaviors, the strong associations observed between smoking, obesity, and pain outcomes are well documented in the literature12,78. Similarly, the dose-response relationship between depressive symptoms and both chronic pain and HICP reflects prior findings emphasizing the close bidirectional relationship between pain and mental health79,66. However, this study adds to the evidence base by demonstrating that these associations are consistently stronger for HICP than for chronic pain overall, underscoring the role of behavioral and psychosocial factors in distinguishing disabling from non-disabling pain.
Finally, the dominant role of arthritis in predicting HICP, compared to other chronic conditions, reflects broader evidence that musculoskeletal conditions are among the leading contributors to disabling pain worldwide12,78. This analysis reinforces arthritis as the strongest condition-level predictor of HICP and highlights it as a priority public health target for reducing disabling pain16,78.
Overall, this study builds upon and extends prior research by using a comprehensive national dataset, systematically comparing chronic pain and HICP predictors side by side and highlighting both established and underappreciated patterns. Future research should build on this work by examining longitudinal pathways, exploring modifiable risk factors, and designing targeted interventions for high-risk populations.
Strengths and Limitations
This study has several notable strengths. First, it uses a large, nationally representative sample, allowing for population-level estimates and generalizability to the broader US adult population1. By combining data across multiple years (2012–2023), the analysis captures trends and patterns over time, providing an updated and comprehensive view of chronic pain and HICP prevalence and correlates. Additionally, the use of survey-weighted logistic regression ensures that estimates account for the NHIS’s complex sampling design, nonresponse, and post-stratification adjustments, reducing potential biases80. Importantly, the study systematically compares correlates of chronic pain and HICP, an approach rarely seen in prior research, which typically examines these outcomes separately11,48. This comparative design offers new insights into how sociodemographic, health, and behavioral factors shape not just the presence of pain, but its disabling impact.
Several limitations were noted. First, the cross-sectional design precludes causal inference, and the observed associations should be interpreted as correlational. Second, all measures were self-reported, which introduces the potential for recall bias, reporting bias, and misclassification in both exposure and outcome variables. Third, pain and chronic pain were not assessed in the 2022 NHIS, which created a gap in the trend analyses. While the proportion of missingness was small, listwise deletion was used to handle missing data, which assumes data are missing completely at random and may introduce bias if this assumption does not hold. Because some NHIS items (e.g., income or depressive-symptom frequency) are prone to non-random missingness, future work could use multiple imputation strategies tailored to complex surveys to assess robustness.
Complete-case analysis assumes data are missing completely at random (MCAR); if this assumption is not met, estimates may be biased and precision reduced. Because some NHIS items (e.g., income or depressive-symptom frequency) can exhibit non-random missingness, results should be interpreted with this caveat. Future analyses could employ multiple imputation strategies designed for complex surveys to evaluate robustness to alternative missing-data mechanisms.
Depressive symptoms were assessed using a single global frequency question from NHIS (“How often do you feel depressed?” with response options: daily, weekly, monthly, a few times a year, or never), rather than a validated multi-item scale such as the PHQ-2 or PHQ-9. This reliance on a single-item measure may increase the potential for misclassification when compared to standardized instruments.
A further limitation is that the “not employed” category combines individuals with diverse circumstances (students, homemakers, disabled, and others not in the labor force). This heterogeneity may mask subgroup-specific risks and complicate interpretation. While sensitivity analyses excluding these subgroups were beyond the scope of the present study, they represent an important avenue for future research.
Additionally, the income-to-poverty ratio was based on NHIS’s recoding of reported family income into categories relative to the survey year’s Federal Poverty Level thresholds. Because FPL values are adjusted annually, income comparisons across years should be interpreted as relative to year-specific poverty standards rather than fixed-dollar cutoffs.
Because all health conditions were self-reported based on recall of a prior doctor’s diagnosis, they may be under-ascertained relative to clinical or medical record confirmation. This limitation is common in survey-based research and may underestimate true prevalence of comorbidities.
Finally, although many sociodemographic and health variables were adjusted for, residual confounding is possible, and some relevant factors (such as access to care, pain management strategies, or social support) were not available in the dataset.
Despite these limitations, the findings carry important clinical and public health implications. Interventions aiming to reduce the burden of chronic pain should pay particular attention to modifiable factors like obesity, smoking, and depression, which show strong associations with more disabling pain. Moreover, the lack of gender differences after adjustment highlights the need to move beyond simple demographic categories and instead focus on underlying mechanisms and pathways that explain disparities.
Directions for future research
This study underscores the need for longitudinal studies to clarify causal pathways between chronic pain and its associated risk factors. While cross-sectional analyses like ours highlight key correlates, they cannot determine directionality; future research should explore longitudinal patterns, identify protective factors that prevent the progression from chronic pain to HICP, and develop tailored interventions for those most at risk. Future research should also explore whether interventions targeting smoking, obesity, and depression can effectively prevent the transition from chronic pain to HICP. In particular, intervention trials should test whether reducing behavioral and psychosocial risks—such as smoking cessation, obesity management, and treatment of depression—can alter pain trajectories. Additionally, research should investigate the surprising lack of adjusted sex differences found in this study, as prior literature has consistently reported higher pain prevalence among women. Intersectional and life-course analyses that explore how sex interacts with race, socioeconomic status, and cultural factors would provide more nuanced insights into disparities.
At the policy level, the persistent burden of HICP calls for stronger national strategies, including dedicated funding streams for chronic pain research and enhanced access to integrated pain management services. Policymakers should consider implementing public health campaigns that raise awareness of high-impact pain and promote early intervention, particularly among socioeconomically disadvantaged populations. Moreover, social safety nets and disability policies should be evaluated to ensure they adequately support individuals facing disabling chronic pain without discouraging workforce participation. Overall, bridging the gap between research, practice, and policy will be essential to reducing the growing burden of chronic pain on individuals and society. Future work should also examine structural interventions, such as workplace accommodations and insurance reforms, to reduce pain-related disability. My findings further suggest that health policies and interventions should prioritize addressing depression and severe obesity as key correlates of both chronic pain and HICP, and that targeted pain management strategies may be particularly important for unemployed individuals and those with lower socioeconomic resources. Such efforts may reduce disparities in disabling pain and improve overall population health.
Recommended Actions
The findings of this study point to several actionable steps for clinicians, healthcare systems, and public health practitioners aiming to reduce the burden of chronic pain and HICP in the US population. First, interventions targeting modifiable risk factors, such as smoking cessation, weight management, and treatment of depression, should be prioritized, as these factors were consistently associated with higher odds of both chronic pain and HICP4,66. Routine clinical screening should therefore include not only assessments of pain presence but also questions about activity limitations, to better identify individuals at risk of progressing to disabling pain11.
Additionally, arthritis management should be strengthened, as arthritis emerged as the strongest medical predictor of HICP in this study and has been shown in prior research to drive a substantial portion of disability-related health care use16,78. Expanding access to multidisciplinary pain management programs—combining physical therapy, pharmacologic care, mental health services, and self-management education—may reduce functional impacts and improve quality of life18.
Importantly, employment and vocational support should also be considered, as unemployment was strongly linked to disabling pain; Policies that promote workplace accommodations, protect against job loss, and strengthen vocational rehabilitation could reduce both personal and societal burdens22.
Conclusion
This study provides a comprehensive and up-to-date analysis of the prevalence and correlates of chronic pain and HICP in the United States, using nationally representative NHIS data across multiple years. Then findings confirm that chronic pain affects approximately one in five US adults, with nearly one-third of these individuals experiencing disabling, high-impact pain that significantly limits life and work activities. Importantly, while many sociodemographic, health, and behavioral factors were associated with both chronic pain and HICP, the strength and pattern of these associations differed, revealing that HICP is not simply “more pain” but represents a distinct and more severe burden.
The study’s results highlight several modifiable risk factors, including obesity, smoking, and depressive symptoms, that are strongly linked to disabling pain and represent actionable targets for intervention. At the same time, assumptions about persistent sex-based disparities, suggesting the need for more nuanced, intersectional research approaches.
Despite the strengths of the dataset and analytical approach, this study underscores ongoing challenges, including the need for longitudinal data, improved measures of pain severity and management, and better understanding of how social and economic contexts shape pain outcomes. Addressing these gaps is critical for informing the design of interventions and policies that can reduce the enormous personal, clinical, and economic burdens imposed by chronic and HICP. Ultimately, advancing research, clinical practice, and policy in tandem will be essential not only to improve outcomes for individuals, but also to reduce the broader clinical and economic burden of chronic pain and HICP in the United States.
Supplementary Materials
Additional figures and tables are in a separate file (Figures S1 to S10, Tables S1 to S9).
Supplementary Figures


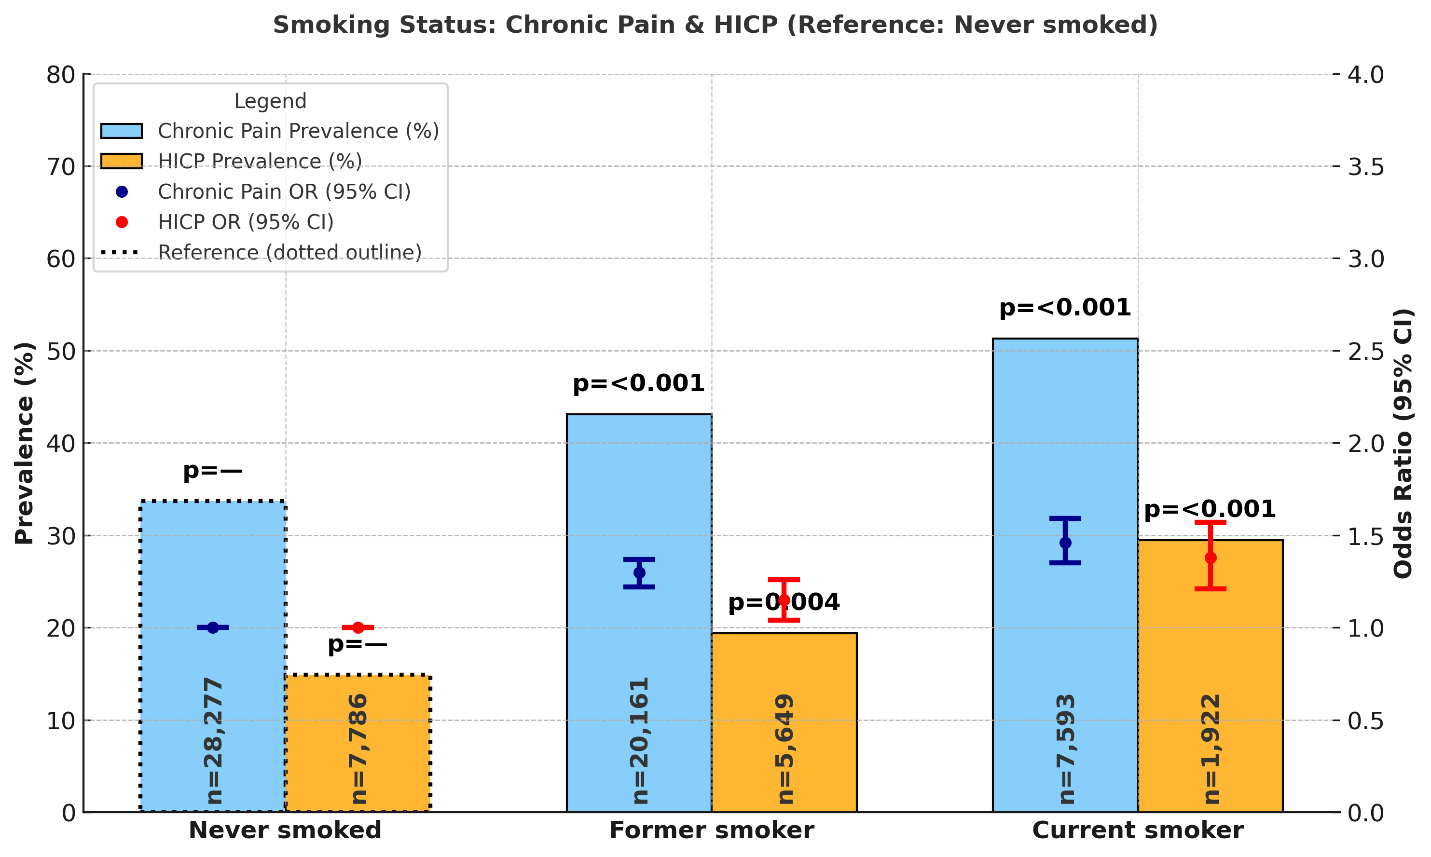


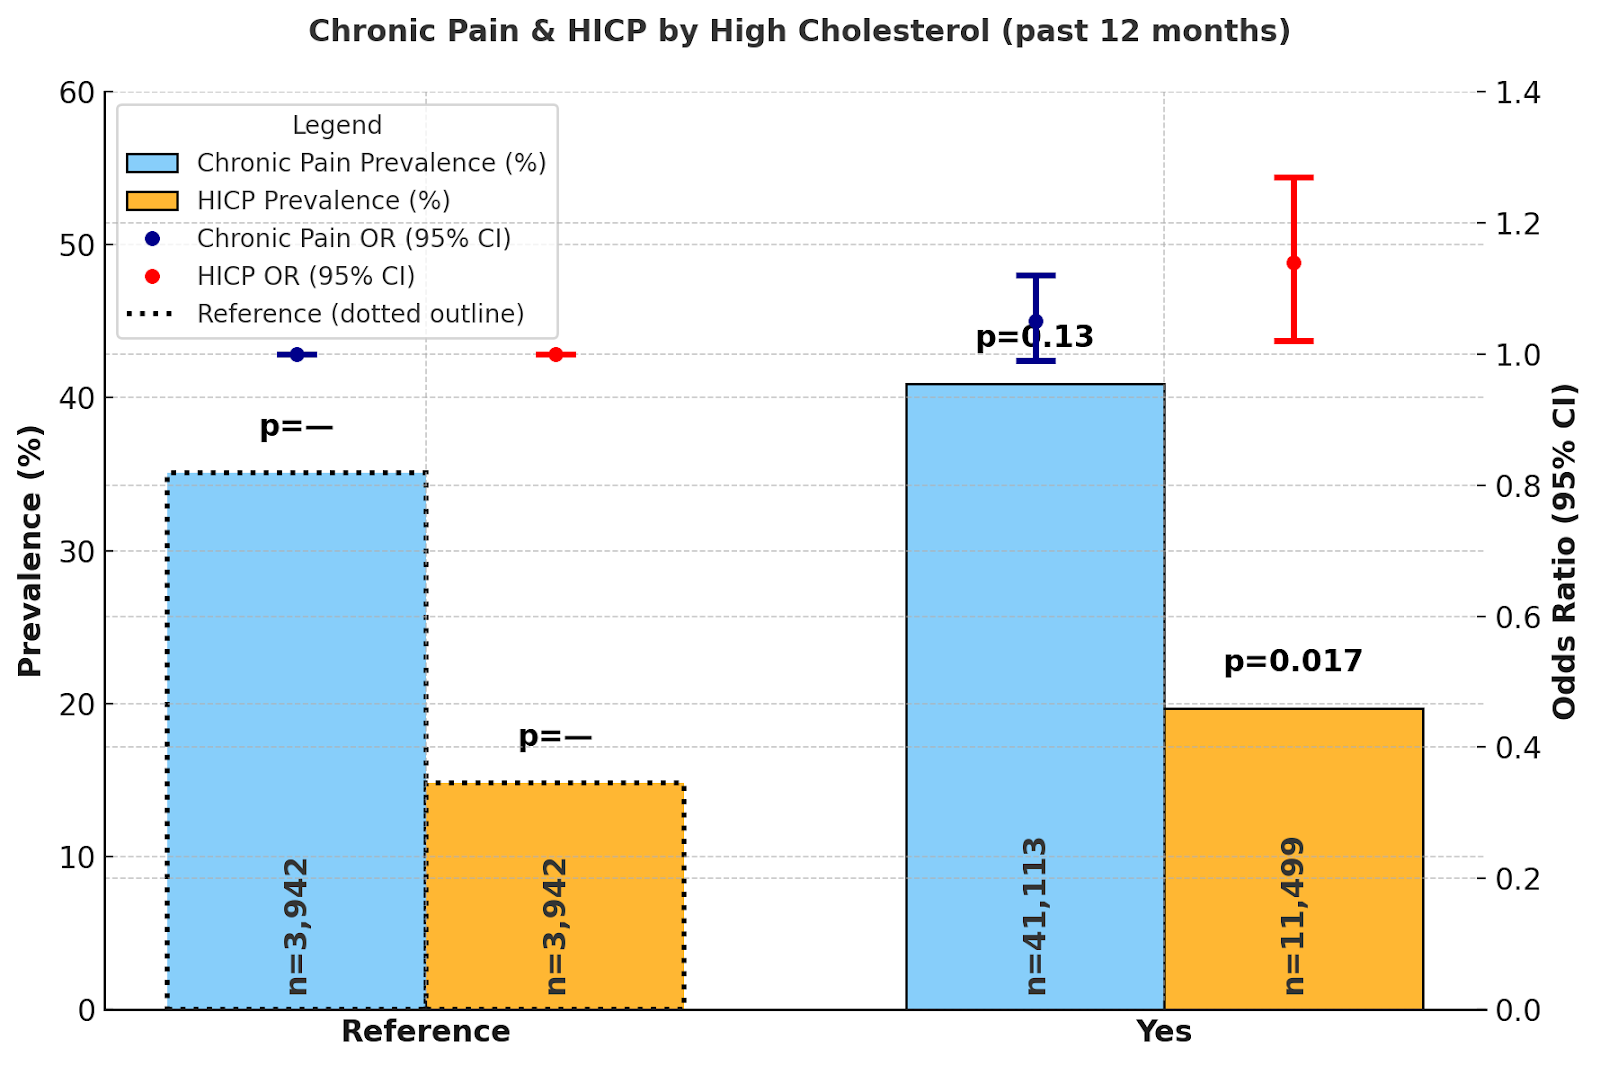


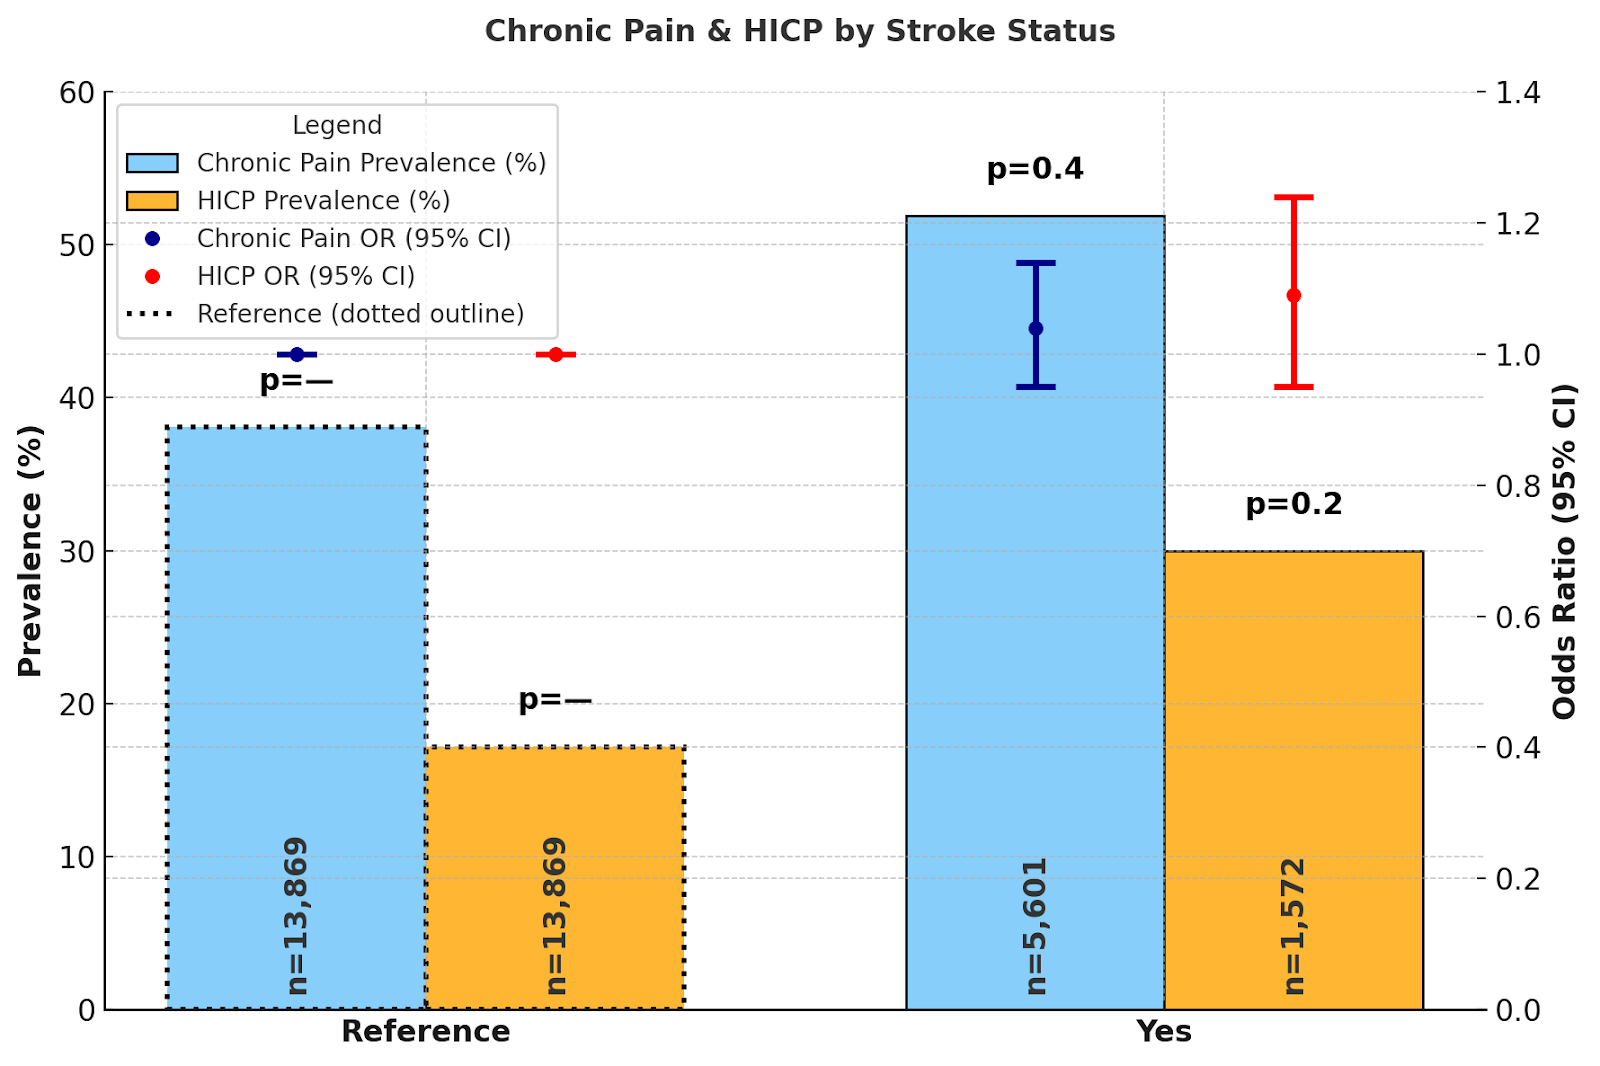
Supplementary Tables
| Chronic Pain (N=56,253) | HICP (N=15,441) | |||||||||
| n | Prevalence (95% CI) | OR | (95% CI) | p-value | n | Prevalence (95% CI) | OR | (95% CI) | p-value | |
| 2012 | 1,242 (2.2%) | 33.9% (30.5%, 37.2%) | — | — | — | |||||
| 2013 | 4,734 (8.4%) | 33.6% (31.8%, 35.3%) | 1.14 | 0.92, 1.42 | 0.2 | |||||
| 2014 | 2,863 (5.1%) | 37.0% (34.6%, 39.5%) | 1.32 | 1.04, 1.66 | 0.023 | |||||
| 2015 | 2,695 (4.8%) | 37.8% (35.3%, 40.4%) | 1.27 | 1.00, 1.62 | 0.048 | |||||
| 2016 | 2,275 (4.0%) | 46.7% (44.0%, 49.4%) | 1.72 | 1.35, 2.18 | <0.001 | |||||
| 2017 | 1,800 (3.2%) | 42.5% (39.7%, 45.2%) | 1.43 | 1.12, 1.83 | 0.004 | |||||
| 2018 | 4,399 (7.8%) | 38.6% (36.9%, 40.4%) | 1.34 | 1.09, 1.66 | 0.007 | |||||
| 2019 | 10,490 (19%) | 39.3% (38.1%, 40.4%) | 1.36 | 1.10, 1.69 | 0.004 | 5,243 (34%) | 18.4% (17.5%, 19.3%) | — | — | — |
| 2020 | 5,355 (9.5%) | 40.2% (38.6%, 41.9%) | 1.51 | 1.21, 1.89 | <0.001 | — | — | — | — | |
| 2021 | 9,863 (18%) | 38.3% (37.2%, 39.4%) | 1.37 | 1.10, 1.69 | 0.004 | 4,931 (32%) | 17.0% (16.2%, 17.9%) | 0.98 | 0.88, 1.08 | 0.7 |
| 2022 | 0 (0%) | — | — | — | — | — | — | — | — | — |
| 2023 | 10,537 (19%) | 42.3% (41.2%, 43.4%) | 1.74 | 1.41, 2.15 | <0.001 | 5,267 (34%) | 19.8% (18.9%, 20.8%) | 1.28 | 1.16, 1.41 | <0.001 |
| Chronic Pain (N=56,253) | HICP (N=15,441) | |||||||||
| n | Prevalence (95% CI) | OR | (95% CI) | pvalue | n | Prevalence (95% CI) | OR | (95% CI) | pvalue | |
| Age | ||||||||||
| 50–64 | 17,511 (31%) | 41.5% (40.6%, 42.4%) | — | — | — | 4,608 (30%) | 21.3% (20.3%, 22.3%) | — | — | — |
| 19–29 | 351 (0.6%) | 21.2% (15.8%, 26.5%) | 0.53 | 0.37, 0.76 | <0.001 | 66 (0.4%) | 13.5% (6.3%, 20.7%) | 0.69 | 0.36, 1.30 | 0.2 |
| 30–49 | 5,559 (9.9%) | 35.8% (34.2%, 37.3%) | 0.95 | 0.86, 1.05 | 0.3 | 1,355 (8.8%) | 17.5% (15.8%, 19.1%) | 0.87 | 0.73, 1.03 | 0.1 |
| 65–84 | 29,054 (52%) | 39.0% (38.3%, 39.7%) | 0.79 | 0.74, 0.84 | <0.001 | 8,331 (54%) | 16.7% (16.0%, 17.3%) | 0.62 | 0.56, 0.69 | <0.001 |
| 85+ | 3,778 (6.7%) | 40.9% (38.9%, 42.8%) | 0.79 | 0.69, 0.89 | <0.001 | 1,081 (7.0%) | 18.7% (16.5%, 20.8%) | 0.62 | 0.51, 0.76 | <0.001 |
| Sex | ||||||||||
| Male | 26,561 (47%) | 36.9% (36.2%, 37.6%) | — | — | — | 7,422 (48%) | 16.5% (15.8%, 17.2%) | — | — | — |
| Female | 29,692 (53%) | 42.0% (41.3%, 42.7%) | 0.99 | 0.94, 1.05 | 0.7 | 8,019 (52%) | 20.5% (19.8%, 21.3%) | 0.98 | 0.90, 1.08 | 0.7 |
| Marital Status | ||||||||||
| Married/Partnered | 27,215 (49%) | 37.3% (36.6%, 37.9%) | — | — | — | 7,594 (50%) | 16.5% (15.9%, 17.2%) | — | — | — |
| Never Married | 6,037 (11%) | 37.2% (35.6%, 38.8%) | 0.72 | 0.66, 0.79 | <0.001 | 1,638 (11%) | 20.4% (18.5%, 22.3%) | 0.71 | 0.61, 0.82 | <0.001 |
| Separated/Divorced | 11,519 (21%) | 47.1% (46.0%, 48.2%) | 1.06 | 0.99, 1.13 | 0.12 | 3,032 (20%) | 24.0% (22.7%, 25.3%) | 0.92 | 0.82, 1.03 | 0.13 |
| Widowed | 11,061 (20%) | 42.1% (40.9%, 43.2%) | 0.9 | 0.83, 0.97 | 0.006 | 3,037 (20%) | 19.5% (18.3%, 20.7%) | 0.82 | 0.73, 0.92 | <0.001 |
| Educational Attainment | ||||||||||
| Less than HS graduate | 8,239 (15%) | 45.5% (44.1%, 46.9%) | — | — | — | 2,022 (13%) | 24.6% (23.1%, 26.2%) | — | — | — |
| HS graduate or equivalent | 16,105 (29%) | 42.0% (41.1%, 43.0%) | 1.22 | 1.12, 1.33 | <0.001 | 4,382 (28%) | 20.7% (19.6%, 21.7%) | 1.26 | 1.10, 1.43 | <0.001 |
| At least some college | 31,676 (57%) | 36.2% (35.5%, 36.8%) | 1.27 | 1.17, 1.38 | <0.001 | 8,977 (58%) | 15.3% (14.7%, 15.9%) | 1.36 | 1.20, 1.55 | <0.001 |
| Employment Status | ||||||||||
| Employed | 18,207 (33%) | 29.3% (28.5%, 30.1%) | — | — | — | 4,963 (32%) | 9.5% (8.8%, 10.2%) | — | — | — |
| Not Employed | 24,818 (44%) | 45.6% (44.8%, 46.3%) | 1.26 | 1.17, 1.36 | <0.001 | 10,356 (68%) | 23.7% (23.0%, 24.4%) | 1.88 | 1.67, 2.11 | <0.001 |
| Not in Labor force | 12,879 (23%) | 45.1% (44.0%, 46.2%) | 1.41 | 1.26, 1.58 | <0.001 | 0 (0%) | ||||
| Income Level | ||||||||||
| Poor/Near (< 125% FPL) | 10,194 (20%) | 54.1% (52.9%, 55.3%) | — | — | — | 2,644 (18%) | 34.6% (33.0%, 36.2%) | — | — | — |
| Low (125–199% FPL) | 8,788 (17%) | 44.8% (43.5%, 46.1%) | 0.88 | 0.80, 0.95 | 0.003 | 2,607 (18%) | 24.4% (23.0%, 25.9%) | 0.83 | 0.73, 0.94 | 0.004 |
| Middle (200–399% FPL) | 15,967 (32%) | 39.2% (38.2%, 40.1%) | 0.86 | 0.79, 0.94 | <0.001 | 4,705 (32%) | 16.6% (15.7%, 17.5%) | 0.67 | 0.59, 0.76 | <0.001 |
| High (> 400% FPL ) | 15,659 (31%) | 30.8% (30.0%, 31.7%) | 0.81 | 0.74, 0.89 | <0.001 | 4,713 (32%) | 10.3% (9.6%, 11.0%) | 0.58 | 0.51, 0.67 | <0.001 |
| Chronic Pain (N=56,253) | HICP (N=15,441) | |||||||||
| n | Prevalence (95% CI) | OR | (95% CI) | pvalue | n | Prevalence (95% CI) | OR | (95% CI) | pvalue | |
| Smoking Status | ||||||||||
| Never smoked | 28,277 (50%) | 33.7% (33.0%, 34.3%) | — | — | — | 7,786 (51%) | 14.9% (14.2%, 15.6%) | — | — | — |
| Former smoker | 20,161 (36%) | 43.1% (42.2%, 43.9%) | 1.30 | 1.22, 1.37 | <0.001 | 5,649 (37%) | 19.4% (18.5%, 20.2%) | 1.15 | 1.04, 1.26 | 0.004 |
| Current smoker | 7,593 (14%) | 51.3% (49.9%, 52.7%) | 1.46 | 1.35, 1.59 | <0.001 | 1,922 (13%) | 29.5% (27.7%, 31.3%) | 1.38 | 1.21, 1.57 | <0.001 |
| Depression | ||||||||||
| Never | 29,065 (52%) | 29.9% (29.2%, 30.5%) | — | — | 7,777 (51%) | 10.8% (10.2%, 11.4%) | — | — | — | |
| A few times a year | 15,144 (27%) | 40.3% (39.3%, 41.2%) | 1.42 | 1.34, 1.51 | <0.001 | 4,363 (28%) | 15.9% (15.0%, 16.8%) | 1.34 | 1.21, 1.48 | <0.001 |
| Monthly | 3,826 (6.8%) | 51.7% (49.8%, 53.7%) | 1.89 | 1.70, 2.10 | <0.001 | 1,074 (7.0%) | 29.3% (27.0%, 31.7%) | 2.38 | 2.04, 2.77 | <0.001 |
| Weekly | 4,052 (7.2%) | 62.0% (60.2%, 63.9%) | 2.41 | 2.18, 2.67 | <0.001 | 1,115 (7.3%) | 38.1% (35.7%, 40.6%) | 2.6 | 2.26, 2.99 | <0.001 |
| Daily | 3,891 (7.0%) | 72.6% (70.8%, 74.3%) | 3.18 | 2.84, 3.55 | <0.001 | 1,039 (6.8%) | 52.7% (50.1%, 55.4%) | 3.73 | 3.21, 4.33 | <0.001 |
| Chronic Pain (N=56,253) | HICP (N=15,441) | |||||||||
| n | Prevalence (95% CI) | OR | (95% CI) | pvalue | n | Prevalence (95% CI) | OR | (95% CI) | pvalue | |
| Health Status | ||||||||||
| Poor | 5,106 (9.1%) | 74.5% (73.1%, 76.0%) | — | — | — | 1,428 (9.3%) | 55.7% (53.5%, 58.0%) | — | — | |
| Fair | 12,966 (23%) | 54.7% (53.6%, 55.8%) | 3.12 | 2.81, 3.46 | <0.001 | 3,660 (24%) | 27.9% (26.7%, 29.1%) | 0.43 | 0.38, 0.49 | <0.001 |
| Good | 20,460 (36%) | 35.2% (34.4%, 36.0%) | 1.71 | 1.60, 1.83 | <0.002 | 5,640 (37%) | 12.1% (11.4%, 12.8%) | 0.22 | 0.19, 0.25 | <0.001 |
| Very Good | 13,841 (25%) | 23.6% (22.8%, 24.5%) | 0.67 | 0.62, 0.71 | <0.001 | 3,783 (25%) | 6.4% (5.7%, 7.0%) | 0.15 | 0.12, 0.17 | <0.001 |
| Excellent | 3,846 (6.8%) | 16.3% (14.8%, 17.7%) | 0.53 | 0.47, 0.60 | <0.001 | 920 (6.0%) | 3.1% (2.3%, 3.9%) | 0.08 | 0.06, 0.11 | <0.001 |
| Obesity-Level | ||||||||||
| Underweight | 235 (0.4%) | 34.2% (27.3%, 41.2%) | — | — | — | 65 (0.4%) | 19.7% (12.1%, 27.2%) | — | — | |
| Normal weight | 9,910 (18%) | 33.5% (32.4%, 34.7%) | 1.18 | 0.81, 1.74 | 0.4 | 2,722 (18%) | 15.0% (13.9%, 16.2%) | 0.92 | 0.52, 1.63 | 0.8 |
| Overweight | 18,673 (33%) | 34.6% (33.8%, 35.4%) | 1.33 | 0.91, 1.95 | 0.14 | 5,179 (34%) | 15.0% (14.2%, 15.8%) | 1.05 | 0.60, 1.84 | 0.9 |
| Obesity, Class 1 | 13,566 (24%) | 39.7% (38.7%, 40.7%) | 1.53 | 1.04, 2.24 | 0.03 | 3,721 (24%) | 18.2% (17.2%, 19.3%) | 1.21 | 0.69, 2.13 | 0.5 |
| Obesity, Class 2 | 6,043 (11%) | 48.3% (46.7%, 49.8%) | 1.84 | 1.25, 2.72 | 0.002 | 1,673 (11%) | 22.8% (21.0%, 24.6%) | 1.3 | 0.74, 2.30 | 0.4 |
| Obesity, Class 3 | 7,826 (14%) | 49.9% (48.5%, 51.2%) | 1.8 | 1.23, 2.65 | 0.003 | 2,081 (13%) | 27.3% (25.7%, 28.9%) | 1.55 | 0.88, 2.73 | 0.13 |
| Chronic Pain (N=56,253) | HICP (N=15,441) | |||||||||
| n | Prevalence (95% CI) | OR | (95% CI) | pvalue | n | Prevalence (95% CI) | OR | (95% CI) | pvalue | |
| Arthritis/rheumatoid arthritis/gout/lupus/fibromyalgia | ||||||||||
| No | 22.8% (22.2%, 23.4%) | — | — | — | 7690 (50%) | 9.1% (8.5%, 9.6%) | — | — | — | |
| Yes | 28,718 | 57.0% (56.3%, 57.7%) | 3.75 | 3.55, 3.96 | <0.001 | 7,751 (50%) | 28.8% (27.9%, 29.6%) | 3.04 | 2.77, 3.34 | <0.001 |
| Coronary heart disease | ||||||||||
| No | 37.2% (36.7%, 37.8%) | — | — | — | 12478 (81%) | 16.9% (16.3%, 17.4%) | — | — | — | |
| Yes | 10,360 | 49.1% (47.9%, 50.2%) | 1.11 | 1.04, 1.19 | 0.003 | 2,963 (19%) | 25.0% (23.7%, 26.3%) | 1.02 | 0.92, 1.13 | 0.7 |
| High cholesterol in past 12 months | ||||||||||
| No | 35.1% (34.1%, 36.0%) | — | — | — | 3942 (25%) | 14.8% (13.8%, 15.8%) | — | — | — | |
| Yes | 41,113 | 40.9% (40.3%, 41.5%) | 1.05 | 0.99, 1.12 | 0.13 | 11,499 (75%) | 19.7% (19.0%, 20.3%) | 1.14 | 1.02, 1.27 | 0.017 |
| Diabetes | ||||||||||
| No | 36.0% (35.4%, 36.6%) | — | — | — | 10658 (69%) | 15.6% (15.0%, 16.2%) | — | — | — | |
| Yes | 17,261 | 46.9% (46.0%, 47.9%) | 1.02 | 0.97, 1.08 | 0.4 | 4,783 (31%) | 24.5% (23.5%, 25.6%) | 1.06 | 0.97, 1.16 | 0.2 |
| Hypertension in past 12 months | ||||||||||
| No | 34.5% (33.3%, 35.8%) | — | — | — | 2463 (16%) | 14.4% (13.1%, 15.6%) | — | — | — | |
| Yes | 47,938 | 40.3% (39.7%, 40.8%) | 1.01 | 0.93, 1.09 | 0.9 | 12,978 (84%) | 19.2% (18.7%, 19.8%) | 0.98 | 0.86, 1.11 | 0.7 |
| Stroke | ||||||||||
| No | 38.1% (37.6%, 38.6%) | — | — | — | 13869 (90%) | 17.2% (16.6%, 17.7%) | — | — | — | |
| Covariate | Variable | Survey Question | Original Response Levels | Analysis Levels | |
| 1 | Age | AGE | What is [your/subject’s] age? | Reported as a continuous variable in years (0, 1, 2, …, 85).Ages 85 and older are top-coded to 85.Special codes:97 = Refused98 = Not Ascertained99 = Don’t Know | AGE >= 19 & AGE <= 29 ~ “19–29″AGE >= 30 & AGE <= 49 ~ “30–49″AGE >= 50 & AGE <= 64 ~ “50–64″AGE >= 65 & AGE <= 84 ~ “65–84″AGE >= 85 ~ “85+” |
| 2 | Arthritis | ARTHGLUPEV | Have you ever been told by a doctor or other health professional that you have some form of arthritis, rheumatoid arthritis, gout, lupus, or fibromyalgia? | 0 NIU1 No2 Yes7 Unknown-refused8 Unknown-not ascertained9 Unknown-don’t know | ARTHGLUPEV==1 ~ “No”ARTHGLUPEV==2 ~ “Yes” |
| 3 | Coronary heart disease | CHEARTDIEV | Have you ever been told by a doctor or other health professional that you had coronary heart disease? | 0 NIU1 No2 Yes7 Unknown–refused8 Unknown–not ascertained9 Unknown–don’t know | CHEARTDIEV==1 ~ “No”CHEARTDIEV==2 ~ “Yes” |
| 4 | High cholesterol | CHOLHIGHYR | During the past 12 months, have you been told by a doctor or other health professional that your blood cholesterol level was high? | 0 NIU1 No2 Yes7 Unknown-refused8 Unknown-not ascertained9 Unknown-don’t know | CHOLHIGHYR==1 ~ “No”CHOLHIGHYR==2 ~ “Yes” |
| 5 | Depression | DEPFREQ | How often do you feel depressed? | 0 NIU1 Daily2 Weekly3 Monthly4 A few times a year5 Never7 Unknown-refused8 Unknown-not ascertained9 Unknown-don’t know | DEPFREQ==1 ~ “Daily”DEPFREQ==2 ~ “Weekly”DEPFREQ==3 ~ “Monthly”DEPFREQ==4 ~ “A few times a year”DEPFREQ==5 ~ “Never” |
| 6 | Medication for depression | DEPRX | During the past 12 months, have you taken prescription medication for depression? | 0 NIU1 No2 Yes7 Unknown-refused8 Unknown-not ascertained9 Unknown-don’t know | DEPRX==1 ~ “No”DEPRX==2 ~ “Yes” |
| 7 | Diabetes | DIABETICEV | Have you ever been told by a doctor or other health professional that you have diabetes? | 0 NIU1 No or not mentioned2 Yes or mentioned3 Borderline7 Unknown-refused8 Unknown-not ascertained9 Unknown-don’t know | DIABETICEV==1 ~ “No”DIABETICEV==2 ~ “Yes” |
| 8 | Education | EDUC | What is the highest level of school you have completed or the highest degree you have received? | 000 NIU100 Grade 12 or less, no high school diploma or equivalent101 Grade 8 or less (no further detail)102 Never attended/kindergarten only103 Grades 1-11 (no further detail)104 Grade 1105 Grade 2106 Grade 3107 Grade 4108 Grade 5109 Grade 6110 Grade 7111 Grade 8112 Grade 9-12, no diploma (no further detail)113 Grade 9114 Grade 10115 Grade 11116 12th grade, no diploma200 High school diploma or GED201 High school graduate202 GED or equivalent300 Some college, no 4yr degree301 Some college, no degree302 AA degree: technical/vocational/occupational303 AA degree: academic program400 Bachelor’s degree (BA,AB,BS,BBA)500 Master’s, Professional, or Doctoral Degree501 Master’s degree (MA,MS,Med,MBA)502 Professional (MD,DDS,DVM,JD)503 Doctoral degree (PhD, EdD)504 Other degree9505 Professional School or Doctoral d10egree, top coded (MD, DDS, DVM, JD, PhD, EdD)996 No degree, years of education unknown997 Unknown–refused998 Unknown–not ascertained999 Unknown–don’t know | EDUC (100:116) ~ “Less than high school graduate”EDUC (200:202) ~ “High school graduate or equivalent”,EDUC (300:505) ~ “At least some college”, |
| 9 | Employment Status | EMPSTAT | LAST WEEK, did you work for pay at a job or business?Did you have a job or business LAST WEEK, but were temporarily absent due to illness, vacation, family or maternity leave, or some other reason?What is the MAIN reason you were not working for pay at a job or business last week?Does [sample adult] work for pay at a job or business? | 000 NIU100 Employed110 Working111 Working for pay at job/business112 Working, w/out pay, at job/business120 With job, but not at work121 With job, not at work: not laid-off, not looking122 With job, not at work: looking200 Not employed210 Unemployed211 Unemployed: On layoff212 Unemployed: On layoff and looking213 Unemployed: Unk if looking or laid off214 Unemployed: Looking or on layoff215 Unemployed: Have job to return to216 Unemployed: Had job during the round217 Unemployed: No job during reference period220 Not in labor force900 Unknown-all causes997 Unknown-refused998 Unknown-not ascertained999 Unknown-don’t know | EMPSTAT (100:122) ~ “Employed”EMPSTAT (200) ~ “Not Employed”EMPSTAT (210:217) ~ “Unemployed”EMPSTAT (220) ~ “Not in labor force” |
| 10 | Health Status | HEALTH | Would you say your health in general is excellent, very good, good, fair, or poor? | 1 Excellent2 Very Good3 Good4 Fair5 Poor7 Unknown-refused8 Unknown-not ascertained9 Unknown-don’t know | HEALTH==1 ~ “5. Excellent”HEALTH==2 ~ “4. Very Good”HEALTH==3 ~ “3. Good”HEALTH==4 ~ “2. Fair”HEALTH==5 ~ “1. Poor” |
| 11 | Hypertension | HYPERTENYR | During the past 12 months, have you been told by a doctor or other health professional that you had hypertension, also called high blood pressure? | 0 NIU1 No2 Yes7 Unknown-refused8 Unknown-not ascertained9 Unknown-don’t know | HYPERTENYR==1 ~ “No”HYPERTENYR==2 ~ “Yes” |
| 12 | Combined Family Income | POVERTY | Which of these groups represents your total combined family income during the past 12 months? This includes money from jobs, Social Security, retirement income, unemployment payments, public assistance, and so forth. | 10 $0 – $49,999 (no further detail)11 $0 – $34,99912 $35,000 – $49,99920 $50,000 and over (no further detail; available 2007-2013)21 $50,000 – $99,999 (no further detail)22 $50,000 – $74,99923 $75,000 – $99,99924 $100,000 and over96 Undefined99 Unknown | POVERTY (10:21) ~ < 125% FPLPOVERTY (22-24) ~ 125-199% FPLPOVERTY (30-34) ~200-399% FPL POVERTY (35,37) ~ > 125% FPL |
| 13 | Pain frequency in 3 months | PAINFREQ3MO | During the past 3 months, how often did you have pain? | 0 NIU1 Never2 Some days3 Most days4 Every day7 Unknown-refused8 Unknown-not ascertained9 Unknown-don’t know | PAINFREQ3MO (3,4) ~ 1PAINFREQ3MO (1,2) ~ 0 |
| 14 | Pain Impact | PAINLIMACT | During the past 3 months, how often did pain limit your normal work or activities? | 0 NIU1 Never2 Some days3 Most days4 Every day7 Unknown-refused8 Unknown-not ascertained9 Unknown-don’t know | PAINLIMACT (3,4) ~ 1PAINLIMACT (1,2) ~ 0 |
| 15 | Pain frequency | PAINLIMFAM | During the past 3 months, how often did pain limit your life or family activities? | 0 NIU1 Never2 Some days3 Most days4 Every day7 Unknown-refused8 Unknown-not ascertained9 Unknown-don’t know | PAINLIMFAM (3,4) ~ 1PAINLIMFAM (1,2) ~ 0 |
| 16 | Sex | SEX | Are you male or female? | 1 = Male2 = Female7 = Refused8 = Not Ascertained9 = Don’t Know | SEX==1 ~ “Male”SEX==2 ~ “Female” |
| 17 | Smoking Status | SMOKESTATUS2 | Have you smoked at least 100 cigarettes in your entire life?Do you now smoke cigarettes every day, some days, or not at all? | 00 NIU10 Current smoker11 Current every day smoker12 Current some day smoker13 Current smoker, unknown how often smokes20 Former smoker30 Never smoked40 Has smoked, current smoking status unknown90 Unknown if ever smoked | SMOKESTATUS2 (10:13) ~ “Current”SMOKESTATUS2 (“20”, “40”) ~ “Former”SMOKESTATUS2 (“30”) ~ “Never” |
| 18 | Stroke | STROKEV | Have you ever been told by a doctor or other health professional that you had a stroke? | 0 NIU1 No2 Yes7 Unknown-refused8 Unknown-not ascertained9 Unknown-don’t know | STROKEV==1 ~ “No”STROKEV==2 ~ “Yes” |
| Covariate | Variable | Question Status | New or changed Question | ||
| 1 | Age | AGE | No change since 1963 | ||
| 2 | Arthritis | ARTHGLUPEV | No change since 1997 | ||
| 3 | Coronary heart disease | CHEARTDIEV | No change since 1997 | ||
| 4 | High cholesterol | CHOLHIGHYR | Introduced in 1997 but has not changed since then. | ||
| 5 | Depression | DEPFREQ | How often do you feel depressed? | ||
| 6 | Medication for depression | DEPRX | Introduced in 2019 | During the past 12 months, have you taken prescription medication for depression? | |
| 7 | Diabetes | DIABETICEV | Almos the same since 1997. In 2001, Added explicit distinction between “borderline diabetes” and diabetes in some survey years. Respondents who said “borderline” were captured separately in coding. | ||
| 8 | Education | EDUC | No change since 1997 | ||
| 9 | Employment Status | EMPSTAT | No change since 1997. First introduced in 1963. | ||
| 10 | Health Status | HEALTH | No change since 1982 when it was first introduced. | ||
| 11 | Hypertension | HYPERTENYR | HYPERTENYR was dropped in 2019 and HYPERTENEV must be used. | ||
| 12 | Combined Family Income | INCFAM07ON | No change since 2007. Base year was chosen as 2007. | ||
| 13 | Pain frequency in 3 months | PAINFREQ3MO | Wording changed in 2019 | During the past 3 months, how often did you have pain? | In the past 3 months, how often did you have pain? |
| 14 | Pain Impact | PAINLIMACT | During the past 3 months, how often did pain limit your normal work or activities? | During the past 3 months, how often did pain interfere with your usual activities? | How often did pain limit your life or work activities in the past 3 months? |
| 15 | Pain frequency | PAINLIMFAM | During the past 3 months, how often did pain limit your life or family activities? | How often did pain limit your family or home responsibilities in the past 3 months? | How often did pain limit your family or home responsibilities in the past 3 months? |
| 16 | Sex | SEX | No change since 1963 | ||
| 17 | Sexual Orientation | SEXORIEN | Introduced in 2013. Wording remained the same in 2019 redesign, but survey structure changed—sexual orientation (SEXORIEN) and gender identity (TRANSGEN) were grouped under new SOGI (Sexual Orientation and Gender Identity) items. | ||
| 18 | Smoking Status | SMOKESTATUS2 | No change since 1997 | ||
| 19 | Stroke | STROKEV | No changes since 1997 it was first introduced. | ||
| 20 | Work loss days | WLDAYR | No changes since 1969 it was first introduced. |
| Package | Version | How it has been used | Citation |
| plyr | 1.1.4 | data wrangling, pipes, joins | Wickham H, François R, Henry L, Müller K, Vaughan D. dplyr: A Grammar of Data Manipulation. R package version 1.1.4. |
| gt | 1.0.0 | publication tables | Iannone R, Cheng J, Schloerke B, et al. gt: Easily Create Presentation-Ready Display Tables. R package version 1.0.0. |
| gtsummary | 2.2.0 | model and summary tables | Sjoberg DD, et al. gtsummary: Presentation-Ready Data Summary and Analytic Result Tables. R package version 2.2.0. |
| survey | 4.4-2 | complex survey design & estimation | Lumley T. survey: Analysis of Complex Survey Samples. R package version 4.4-2; see also Lumley (2004, JSS). |
| srvyr | 1.3.0 | tidy interface to survey | Ellis GF. srvyr: ‘dplyr’-Like Syntax for Summary Statistics of Survey Data. R package version 1.3.0. |
| purrr | 1.0.4 | functional programming (map/iterate) | Henry L, Wickham H. purrr: Functional Programming Tools. R package version 1.0.4. |
| scales | 1.3.0 | labeling and transformations | Wickham H, Seidel D. scales: Scale Functions for Visualization. R package version 1.3.0. |
| broom | 1.0.8 | tidying model outputs | Robinson D, Hayes A, et al. broom: Convert Statistical Objects into Tidy Tibbles. R package version 1.0.8. |
| Label | Chronic Pain | HICP | |||||
| Year | OverallN = 56,253 | Complete CaseN = 47,9031 | Missing CaseN = 8,350 | Complete Case | Imputed (d1) | Complete Case | Imputed (d1) |
| 2012 | 1,242 (2.2%) | 925 (1.9%) | 317 (3.8%) | – | – | – | – |
| 2013 | 4,734 (8.4%) | 3,603 (7.5%) | 1,131 (14%) | NA | 1.06 (0.88–1.29) | – | – |
| 2014 | 2,863 (5.1%) | 2,147 (4.5%) | 716 (8.6%) | NA | 1.21 (0.98–1.50) | – | – |
| 2015 | 2,695 (4.8%) | 2,061 (4.3%) | 634 (7.6%) | NA | 1.23 (1.00–1.52) | – | – |
| 2016 | 2,275 (4.0%) | 1,700 (3.5%) | 575 (6.9%) | NA | 1.67 (1.34–2.06) | – | – |
| 2017 | 1,800 (3.2%) | 1,303 (2.7%) | 497 (6.0%) | NA | 1.35 (1.09–1.68) | – | – |
| 2018 | 4,399 (7.8%) | 3,278 (6.8%) | 1,121 (13%) | NA | 1.26 (1.04–1.52) | – | – |
| 2019 | 10,490 (19%) | 9,541 (20%) | 949 (11%) | NA | 1.29 (1.06–1.58) | – | – |
| 2020 | 5,355 (9.5%) | 4,760 (9.9%) | 595 (7.1%) | NA | 1.42 (1.16–1.74) | – | – |
| 2021 | 9,863 (18%) | 8,975 (19%) | 888 (11%) | 1.00 (0.88–1.13) | 1.30 (1.06–1.59) | 0.98 (0.84–1.14) | 1.01 (0.87–1.16) |
| 2022 | 0 (0%) | 0 (0%) | 0 (0%) | ||||
| 2023 | 10,537 (19%) | 9,610 (20%) | 927 (11%) | 1.23 (1.09–1.38) | 1.64 (1.35–2.01) | 1.25 (1.08–1.44) | 1.30 (1.13–1.49) |
| Age group | |||||||
| 50-64 | 17,511 (31%) | 15,027 (31%) | 2,484 (30%) | – | – | – | – |
| 19–29 | 0 (0%) | 0 (0%) | 0 (0%) | 0.47 (0.21–1.06) | 0.72 (0.49–1.08) | 0.75 (0.29–1.94) | 0.90 (0.35–2.31) |
| 30–49 | 351 (0.6%) | 296 (0.6%) | 55 (0.7%) | 0.91 (0.76–1.10) | 0.95 (0.86–1.06) | 0.89 (0.70–1.13) | 0.85 (0.67–1.07) |
| 65–84 | 5,559 (9.9%) | 4,800 (10%) | 759 (9.1%) | 0.83 (0.74–0.95) | 0.78 (0.72–0.84) | 0.64 (0.55–0.74) | 0.63 (0.55–0.73) |
| 85+ | 29,054 (52%) | 24,713 (52%) | 4,341 (52%) | 0.82 (0.65–1.04) | 0.81 (0.70–0.93) | 0.68 (0.51–0.90) | 0.63 (0.48–0.83) |
| Sex | |||||||
| Male | 26,561 (47%) | 22,592 (47%) | 3,969 (48%) | ||||
| Female | 29,692 (53%) | 25,311 (53%) | 4,381 (52%) | 0.92 (0.83–1.02) | 1.00 (0.94–1.06) | 0.95 (0.84–1.09) | 0.99 (0.87–1.12) |
| Marital status | |||||||
| Married | 27,215 (49%) | 23,102 (48%) | 4,113 (52%) | – | – | – | – |
| Never Married | 6,037 (11%) | 5,274 (11%) | 763 (9.6%) | 0.73 (0.61–0.87) | 0.73 (0.66–0.81) | 0.71 (0.57–0.88) | 0.75 (0.61–0.92) |
| Separated/Divorced | 11,519 (21%) | 10,110 (21%) | 1,409 (18%) | 1.14 (0.99–1.30) | 0.99 (0.92–1.07) | 0.88 (0.75–1.04) | 0.93 (0.79–1.09) |
| Widowed | 11,061 (20%) | 9,417 (20%) | 1,644 (21%) | 0.95 (0.82–1.10) | 0.89 (0.82–0.97) | 0.83 (0.70–0.98) | 0.85 (0.72–1.00) |
| Unknown | 421 | 0 | 421 | ||||
| Education | |||||||
| Less than high school graduate | 8,239 (15%) | 7,162 (15%) | 1,077 (13%) | – | – | – | – |
| High school graduate or equivalent | 16,105 (29%) | 13,723 (29%) | 2,382 (29%) | 1.23 (1.04–1.45) | 1.20 (1.09–1.32) | 1.23 (1.02–1.49) | 1.19 (0.99–1.43) |
| At least some college | 31,676 (57%) | 27,018 (56%) | 4,658 (57%) | 1.22 (1.03–1.43) | 1.27 (1.15–1.39) | 1.31 (1.09–1.58) | 1.27 (1.06–1.52) |
| Unknown | 233 | 0 | 233 | ||||
| Employment status | |||||||
| Employed | 18,207 (33%) | 15,534 (32%) | 2,673 (33%) | – | – | – | – |
| Not Employed | 24,818 (44%) | 22,788 (48%) | 2,030 (25%) | 1.21 (1.06–1.38) | 1.28 (1.17–1.40) | 1.85 (1.56–2.19) | 1.95 (1.66–2.30) |
| Not in Labor Force | 12,879 (23%) | 9,581 (20%) | 3,298 (41%) | NA | 1.41 (1.27–1.56) | ||
| Unknown | 349 | 0 | 349 | ||||
| Income (FPL) | |||||||
| Poor/Near-Poor (< 125$ FPL) | 10,194 (20%) | 9,498 (20%) | 696 (26%) | – | – | – | – |
| Low-income (125–199% FPL) | 8,788 (17%) | 8,253 (17%) | 535 (20%) | 0.83 (0.70–0.99) | 0.87 (0.79–0.96) | 0.83 (0.69–0.99) | 0.85 (0.72–1.01) |
| Middle-income (200–399% FPL) | 15,967 (32%) | 15,150 (32%) | 817 (30%) | 0.79 (0.67–0.93) | 0.88 (0.80–0.96) | 0.65 (0.55–0.78) | 0.70 (0.59–0.82) |
| High-income (400% FPL or greater) | 15,659 (31%) | 15,002 (31%) | 657 (24%) | 0.76 (0.64–0.90) | 0.81 (0.73–0.89) | 0.55 (0.45–0.68) | 0.60 (0.49–0.73) |
| Unknown | 5,645 | 0 | 5,645 | ||||
| Self-rated health | |||||||
| Poor | 5,106 (9.1%) | 4,469 (9.3%) | 637 (7.7%) | – | – | – | – |
| Fair | 12,966 (23%) | 11,144 (23%) | 1,822 (22%) | 0.58 (0.48–0.71) | 0.54 (0.48–0.60) | 0.43 (0.36–0.51) | 0.42 (0.35–0.50) |
| Good | 20,460 (36%) | 17,375 (36%) | 3,085 (37%) | 0.35 (0.29–0.43) | 0.31 (0.28–0.35) | 0.23 (0.19–0.28) | 0.22 (0.18–0.26) |
| Very Good | 13,841 (25%) | 11,725 (24%) | 2,116 (25%) | 0.25 (0.20–0.31) | 0.21 (0.18–0.24) | 0.16 (0.12–0.20) | 0.15 (0.12–0.19) |
| Excellent | 3,846 (6.8%) | 3,190 (6.7%) | 656 (7.9%) | 0.22 (0.16–0.30) | 0.16 (0.14–0.19) | 0.10 (0.06–0.16) | 0.08 (0.05–0.12) |
| Unknown | 34 | 0 | 34 | ||||
| BMI | |||||||
| Underweight | 235 (0.4%) | 196 (0.4%) | 39 (0.5%) | – | – | – | – |
| Normal weight | 9,910 (18%) | 8,384 (18%) | 1,526 (18%) | 1.49 (0.69–3.23) | 1.20 (0.76–1.91) | 1.01 (0.42–2.40) | 0.96 (0.44–2.08) |
| Overweight | 18,673 (33%) | 15,897 (33%) | 2,776 (33%) | 1.58 (0.73–3.42) | 1.38 (0.87–2.18) | 1.14 (0.48–2.71) | 1.11 (0.52–2.39) |
| Obesity, Class 1 (Mild) | 13,566 (24%) | 11,601 (24%) | 1,965 (24%) | 1.74 (0.80–3.76) | 1.56 (0.98–2.46) | 1.27 (0.54–3.02) | 1.28 (0.59–2.76) |
| Obesity, Class 2 (Moderate) | 6,043 (11%) | 5,175 (11%) | 868 (10%) | 2.28 (1.04–4.98) | 1.92 (1.21–3.06) | 1.38 (0.58–3.32) | 1.37 (0.63–2.99) |
| Obesity, Class 3 (Severe) | 7,826 (14%) | 6,650 (14%) | 1,176 (14%) | 2.02 (0.93–4.39) | 1.81 (1.14–2.87) | 1.57 (0.66–3.75) | 1.60 (0.74–3.47) |
| Unknown | 5,106 (9.1%) | 4,469 (9.3%) | 4,208 (51%) | ||||
| Arthritis (ever) | |||||||
| Yes | 28,718 (51%) | 24,510 (51%) | 4,208 (51%) | 2.93 (2.64–3.24) | 3.79 (3.56–4.03) | 2.48 (2.16–2.84) | 3.04 (2.67–3.45) |
| Unknown | 63 | 63 | |||||
| Coronary heart disease (ever) | |||||||
| Yes | 10,360 (19%) | 8,912 (19%) | 1,448 (18%) | 1.15 (1.02–1.31) | 1.08 (1.00–1.17) | 1.01 (0.87–1.17) | 1.02 (0.89–1.17) |
| Unknown | 269 | 269 | |||||
| High cholesterol (past year) | |||||||
| Yes | 41,113 (74%) | 35,593 (74%) | 5,520 (72%) | 1.06 (0.94–1.19) | 1.04 (0.97–1.11) | 1.13 (0.97–1.32) | 1.12 (0.96–1.29) |
| Unknown | 729 | 729 | |||||
| Diabetes (ever) | |||||||
| Yes | 17,261 (31%) | 15,150 (32%) | 2,111 (29%) | 1.03 (0.93–1.15) | 1.02 (0.95–1.08) | 1.06 (0.93–1.21) | 1.05 (0.93–1.19) |
| Unknown | 969 | 969 | |||||
| Hypertension (past year) | |||||||
| Yes | 47,938 (85%) | 40,954 (85%) | 6,984 (85%) | 0.98 (0.85–1.13) | 1.00 (0.91–1.09) | 0.98 (0.81–1.17) | 0.99 (0.83–1.18) |
| Unknown | 167 | 167 | |||||
| Stroke (ever) | |||||||
| Yes | 5,601 (10.0%) | 4,805 (10%) | 796 (9.6%) | 1.01 (0.85–1.20) | 1.04 (0.94–1.15) | 1.09 (0.90–1.31) | 1.05 (0.88–1.26) |
| Unknown | 73 | 73 | |||||
| Smoking status | |||||||
| Never | 28,277 (50%) | 24,038 (50%) | 4,239 (52%) | – | – | – | – |
| Former | 20,161 (36%) | 17,261 (36%) | 2,900 (36%) | 1.24 (1.12–1.38) | 1.30 (1.22–1.39) | 1.09 (0.96–1.25) | 1.13 (1.00–1.29) |
| Current | 7,593 (14%) | 6,604 (14%) | 989 (12%) | 1.35 (1.15–1.59) | 1.48 (1.35–1.62) | 1.28 (1.06–1.54) | 1.39 (1.16–1.65) |
| Unknown | 222 | 0 | 222 | ||||
| Depression frequency | |||||||
| Never | 29,065 (52%) | 24,587 (51%) | 4,478 (55%) | – | – | – | – |
| A few times a year | 15,144 (27%) | 13,053 (27%) | 2,091 (26%) | 1.20 (1.07–1.34) | 1.41 (1.31–1.51) | 1.21 (1.04–1.40) | 1.36 (1.18–1.57) |
| Monthly | 3,826 (6.8%) | 3,310 (6.9%) | 516 (6.4%) | 1.62 (1.34–1.95) | 1.88 (1.67–2.11) | 2.16 (1.75–2.68) | 2.46 (2.00–3.03) |
| Weekly | 4,052 (7.2%) | 3,519 (7.3%) | 533 (6.6%) | 2.19 (1.79–2.67) | 2.33 (2.08–2.62) | 2.35 (1.92–2.87) | 2.65 (2.19–3.20) |
| Daily | 3,891 (7.0%) | 3,434 (7.2%) | 457 (5.7%) | 2.84 (2.27–3.54) | 3.24 (2.85–3.68) | 3.32 (2.68–4.12) | 3.80 (3.09–4.67) |
| Unknown | 275 | 0 | 275 | ||||
References
- Pitcher MH, Von Korff M, Bushnell MC, Porter L. Prevalence and Profile of High-Impact Chronic Pain in the United States. J Pain. 2019;20(2):146-160. doi:10.1016/j.jpain.2018.07.006. [↩] [↩] [↩] [↩] [↩]
- Vos T, Lim SS, Abbafati C, et al. Global burden of 369 diseases and injuries in 204 countries and territories, 1990–2019: a systematic analysis for the Global Burden of Disease Study 2019. The Lancet. 2020;396(10258):1204-1222. doi:10.1016/S0140-6736(20)30925-9. [↩] [↩]
- Papageorgiou AC, Silman AJ, Macfarlane GJ. Chronic widespread pain in the population: a seven year follow up study. Ann Rheum Dis. 2002;61(12):1071-1074. doi:10.1136/ard.61.12.1071. [↩]
- Papageorgiou AC, Silman AJ, Macfarlane GJ. Chronic widespread pain in the population: a seven year follow up study. Ann Rheum Dis. 2002;61(12):1071-1074. doi:10.1136/ard.61.12.1071. [↩] [↩] [↩]
- Nahin RL, Feinberg T, Kapos FP, Terman GW. Estimated Rates of Incident and Persistent Chronic Pain Among US Adults, 2019-2020. JAMA Netw Open. 2023;6(5):e2313563. doi:10.1001/jamanetworkopen.2023.13563. [↩] [↩] [↩] [↩] [↩]
- Von Korff M, Dunn KM. Chronic pain reconsidered. Pain. 2008;138(2):267-276. doi:10.1016/j.pain.2007.12.010. [↩]
- Blyth FM, March LM, Brnabic AJM, Jorm LR, Williamson M, Cousins MJ. Chronic pain in Australia: a prevalence study. Pain. 2001;89(2):127-134. doi:10.1016/S0304-3959(00)00355-9. [↩]
- Gaskin DJ, Richard P. The Economic Costs of Pain in the United States. J Pain. 2012;13(8):715-724. doi:10.1016/j.jpain.2012.03.009. [↩]
- Mäntyselkä P. Pain today – Disability tomorrow. Pain. 2012;153(3):507-508. doi:10.1016/j.pain.2011.12.002. [↩]
- Dahlhamer J, Lucas J, Zelaya, C, et al. Prevalence of Chronic Pain and High-Impact Chronic Pain Among Adults — United States, 2016. MMWR Morb Mortal Wkly Rep. 2018;67(36):1001-1006. doi:10.15585/mmwr.mm6736a2. [↩] [↩]
- Pitcher MH, Von Korff M, Bushnell MC, Porter L. Prevalence and Profile of High-Impact Chronic Pain in the United States. J Pain. 2019;20(2):146-160. doi:10.1016/j.jpain.2018.07.006. [↩] [↩] [↩] [↩] [↩] [↩] [↩] [↩] [↩]
- Dahlhamer J, Lucas J, Zelaya, C, et al. Prevalence of Chronic Pain and High-Impact Chronic Pain Among Adults — United States, 2016. MMWR Morb Mortal Wkly Rep. 2018;67(36):1001-1006. doi:10.15585/mmwr.mm6736a2. [↩] [↩] [↩] [↩] [↩] [↩] [↩] [↩] [↩]
- McBeth J, Symmons DP, Silman AJ, et al. Musculoskeletal pain is associated with a long-term increased risk of cancer and cardiovascular-related mortality. Rheumatology. 2008;48(1):74-77. doi:10.1093/rheumatology/ken424. [↩] [↩]
- Torrance N, Elliott AM, Lee AJ, Smith BH. Severe chronic pain is associated with increased 10 year mortality. A cohort record linkage study. Eur J Pain. 2010;14(4):380-386. doi:10.1016/j.ejpain.2009.07.006. [↩]
- Blyth FM, March LM, Brnabic AJM, Jorm LR, Williamson M, Cousins MJ. Chronic pain in Australia: a prevalence study. Pain. 2001;89(2):127-134. doi:10.1016/S0304-3959(00)00355-9. [↩] [↩]
- Breivik H, Collett B, Ventafridda V, Cohen R, Gallacher D. Survey of chronic pain in Europe: Prevalence, impact on daily life, and treatment. Eur J Pain. 2006;10(4):287-287. doi:10.1016/j.ejpain.2005.06.009. [↩] [↩] [↩]
- Blair SN, Sallis RE, Hutber A, Archer E. Exercise therapy – the public health message. Scand J Med Sci Sports. 2012;22(4). doi:10.1111/j.1600-0838.2012.01462.x. [↩]
- Kroenke K, Wu J, Bair MJ, Krebs EE, Damush TM, Tu W. Reciprocal Relationship Between Pain and Depression: A 12-Month Longitudinal Analysis in Primary Care. J Pain. 2011;12(9):964-973. doi:10.1016/j.jpain.2011.03.003. [↩] [↩]
- Fillingim RB, King CD, Ribeiro-Dasilva MC, Rahim-Williams B, Riley JL. Sex, Gender, and Pain: A Review of Recent Clinical and Experimental Findings. J Pain. 2009;10(5):447-485. doi:10.1016/j.jpain.2008.12.001. [↩] [↩]
- Bartley EJ, Fillingim RB. Sex differences in pain: a brief review of clinical and experimental findings. Br J Anaesth. 2013;111(1):52-58. doi:10.1093/bja/aet127. [↩]
- Bevan S. Reducing Temporary Work Incapacity: The Evidence Base for Policy and Practice. 2013 https://www.lancaster.ac.uk/media/lancaster-university/content-assets/documents/lums/workfoundation/ReducingTemporaryWorkIncapacity.pdf. [↩]
- Holmes MM, Stanescu SC, Linaker C, et al. Individualised placement support as an employment intervention for individuals with chronic pain: a qualitative exploration of stakeholder views. BJGP Open. 2020;4(3):bjgpopen20X101036. doi:10.3399/bjgpopen20X101036. [↩] [↩]
- Geneen LJ, Moore RA, Clarke C, Martin D, Colvin LA, Smith BH. Physical activity and exercise for chronic pain in adults: an overview of Cochrane Reviews. In: The Cochrane Collaboration, ed. Cochrane Database of Systematic Reviews. John Wiley & Sons, Ltd; 2017:CD011279.pub2. doi:10.1002/14651858.CD011279.pub2. [↩]
- Finan PH, Goodin BR, Smith MT. The Association of Sleep and Pain: An Update and a Path Forward. J Pain. 2013;14(12):1539-1552. doi:10.1016/j.jpain.2013.08.007. [↩]
- Haack M, Simpson N, Sethna N, Kaur S, Mullington J. Sleep deficiency and chronic pain: potential underlying mechanisms and clinical implications. Neuropsychopharmacology. 2020;45(1):205-216. doi:10.1038/s41386-019-0439-z. [↩]
- Dowell D, Ragan KR, Jones CM, Baldwin GT, Chou R. CDC Clinical Practice Guideline for Prescribing Opioids for Pain — United States, 2022. MMWR Recomm Rep. 2022;71(3):1-95. doi:10.15585/mmwr.rr7103a1. [↩] [↩]
- Fjeld MK, Årnes AP, Engdahl B, et al. Consistent pattern between physical activity measures and chronic pain levels: the Tromsø Study 2015 to 2016. Pain. 2023;164(4):838-847. doi:10.1097/j.pain.0000000000002773. [↩]
- Fanning J, Brooks AK, Robison JT, et al. Associations between patterns of physical activity, pain intensity, and interference among older adults with chronic pain: a secondary analysis of two randomized controlled trials. Front Aging. 2023;4:1216942. doi:10.3389/fragi.2023.1216942. [↩]
- Leese C, Gupte D, Christogianni A, et al. Barriers and facilitators for physical activity in people living with chronic pain: a systematic review and combined analysis. Pain. 2024;165(12):2721-2732. doi:10.1097/j.pain.0000000000003314. [↩]
- Runge N, Ahmed I, Saueressig T, et al. The bidirectional relationship between sleep problems and chronic musculoskeletal pain: a systematic review with meta-analysis. Pain. 2024;165(11):2455-2467. doi:10.1097/j.pain.0000000000003279. [↩]
- Wiklund T, Linton SJ, Alföldi P, Gerdle B. Is sleep disturbance in patients with chronic pain affected by physical exercise or ACT-based stress management? – A randomized controlled study. BMC Musculoskelet Disord. 2018;19(1):111. doi:10.1186/s12891-018-2020-z. [↩]
- Gorfinkel LR, Hasin D, Saxon AJ, et al. Trends in Prescriptions for Non-opioid Pain Medications Among U.S. Adults With Moderate or Severe Pain, 2014-2018. J Pain. 2022;23(7):1187-1195. doi:10.1016/j.jpain.2022.01.006. [↩]
- Moriya A, Fang Z. Any Use and “Frequent Use” of Opioids among Adults Aged 18–64 in 2020–2021, by Socioeconomic Characteristics.; 2023. Accessed August 22, 2025. https://meps.ahrq.gov/data_files/publications/st552/stat552.shtml. [↩]
- Dépelteau A, Racine-Hemmings F, Lagueux É, Hudon C. Chronic pain and frequent use of emergency department: A systematic review. Am J Emerg Med. 2020;38(2):358-363. doi:10.1016/j.ajem.2019.158492. [↩]
- Rikard M, Strahan A, Schmit K, Guy G. Chronic Pain Among Adults — United States, 2019–2021.; 2023. Accessed August 18, 2025. https://www.cdc.gov/mmwr/volumes/72/wr/mm7215a1.htm. [↩]
- National Center for Health Statistics. Health, United States. Centers for Disease Control and Prevention; 2023. Accessed April 25, 2025. https://www.cdc.gov/nchs/hus/. [↩]
- Use of Sampling Weights with IPUMS NHIS. Accessed April 22, 2025. https://nhis.ipums.org/nhis/userNotes_weights.shtml. [↩]
- National Center for Health Statistics. Health, United States. Centers for Disease Control and Prevention; 2023. Accessed April 25, 2025. https://www.cdc.gov/nchs/hus/. [↩] [↩]
- National Health Interview Survey. Centers for Disease Control and Prevention, US Department of Health and Human Services; 2023. Accessed April 25, 2025. https://www.cdc.gov/nchs/nhis/. [↩] [↩]
- Farina MP, Ailshire JA. Sociodemographic and health status differences in delaying medical care during the COVID-19 pandemic among older adults: findings from the Health and Retirement Study. BMC Public Health. 2022;22(1):1720. doi:10.1186/s12889-022-14118-4. [↩]
- Murray CB, Groenewald CB, De La Vega R, Palermo TM. Long-term impact of adolescent chronic pain on young adult educational, vocational, and social outcomes. Pain. 2020;161(2):439-445. doi:10.1097/j.pain.0000000000001732. [↩]
- Shah S, Diwan S, Soin A, et al. Evidence-Based Risk Mitigation and Stratification During COVID-19 for Return to Interventional Pain Practice: American Society of Interventional Pain Physicians (ASIPP) Guidelines. Pain Physician. 2020;23(4S):S161-S182. [↩]
- Yong RJ, Mullins PM, Bhattacharyya N. Prevalence of chronic pain among adults in the United States. Pain. 2022;163(2):e328-e332. doi:10.1097/j.pain.0000000000002291. [↩]
- Clauw DJ, Häuser W, Cohen SP, Fitzcharles MA. Considering the potential for an increase in chronic pain after the COVID-19 pandemic. Pain. 2020;161(8):1694-1697. doi:10.1097/j.pain.0000000000001950. [↩]
- Patel KV, Guralnik JM, Dansie EJ, Turk DC. Prevalence and impact of pain among older adults in the United States: Findings from the 2011 National Health and Aging Trends Study. Pain. 2013;154(12):2649-2657. [↩]
- Fillingim RB, King CD, Ribeiro-Dasilva MC, Rahim-Williams B, Riley JL. Sex, Gender, and Pain: A Review of Recent Clinical and Experimental Findings. J Pain. 2009;10(5):447-485. doi:10.1016/j.jpain.2008.12.001. [↩] [↩]
- Rosen S, Ham B, Mogil JS. Sex differences in neuroimmunity and pain. J Neurosci Res. 2017;95(1-2):500-508. doi:10.1002/jnr.23831. [↩]
- Bartley EJ, Fillingim RB. Sex differences in pain: a brief review of clinical and experimental findings. Br J Anaesth. 2013;111(1):52-58. doi:10.1093/bja/aet127. [↩] [↩] [↩] [↩]
- Exploring the Biological Contributions to Human Health: Does Sex Matter? National Academies Press; 2001:10028. doi:10.17226/10028, [↩]
- Racine M, Tousignant-Laflamme Y, Kloda LA, Dion D, Dupuis G, Choinière M. A systematic literature review of 10 years of research on sex/gender and experimental pain perception – Part 1: Are there really differences between women and men? Pain. 2012;153(3):602-618. doi:10.1016/j.pain.2011.11.025, [↩]
- Umberson D, Karas Montez J. Social Relationships and Health: A Flashpoint for Health Policy. J Health Soc Behav. 2010;51(1_suppl):S54-S66. doi:10.1177/0022146510383501. [↩]
- Robles TF, Slatcher RB, Trombello JM, McGinn MM. Marital quality and health: A meta-analytic review. Psychol Bull. 2014;140(1):140-187. doi:10.1037/a0031859, [↩]
- Hughes ME, Waite LJ. Marital Biography and Health at Mid-Life. J Health Soc Behav. 2009;50(3):344-358. doi:10.1177/002214650905000307. [↩]
- Carr D, Utz RL. Families in Later Life: A Decade in Review. J Marriage Fam. 2020;82(1):346-363. doi:10.1111/jomf.12609. [↩]
- Marmot M. Social determinants of health inequalities. The Lancet. 2005;365(9464):1099-1104. doi:10.1016/S0140-6736(05)71146-6. [↩]
- Cutler DM, Lleras-Muney A. Understanding differences in health behaviors by education. J Health Econ. 2010;29(1):1-28. doi:10.1016/j.jhealeco.2009.10.003. [↩]
- Case A, Deaton A. Mortality and Morbidity in the 21st Century. Brook Pap Econ Act. 2017;2017(1):397-476. doi:10.1353/eca.2017.0005. [↩]
- Assari S. High Income Protects Whites but Not African Americans against Risk of Depression. Healthcare. 2018;6(2):37. doi:10.3390/healthcare6020037. [↩]
- Kennedy J, Roll JM, Schraudner T, Murphy S, McPherson S. Prevalence of Persistent Pain in the U.S. Adult Population: New Data From the 2010 National Health Interview Survey. J Pain. 2014;15(10):979-984. doi:10.1016/j.jpain.2014.05.009. [↩]
- Patel KV, Guralnik JM, Dansie EJ, Turk DC. Prevalence and impact of pain among older adults in the United States: Findings from the 2011 National Health and Aging Trends Study. Pain. 2013;154(12):2649-2657. doi:10.1016/j.pain.2013.07.029. [↩]
- Case A, Deaton A, Stone AA. Decoding the mystery of American pain reveals a warning for the future. Proc Natl Acad Sci. 2020;117(40):24785-24789. doi:10.1073/pnas.2012350117
55. Baker TA, Green CR. Intrarace Differences Among Black and White Americans Presenting for Chronic Pain Management: The Influence of Age, Physical Health, and Psychosocial Factors. Pain Med. 2005;6(1):29-38. doi:10.1111/j.1526-4637.2005.05014.x. [↩]
- Baker TA, Green CR. Intrarace Differences Among Black and White Americans Presenting for Chronic Pain Management: The Influence of Age, Physical Health, and Psychosocial Factors. Pain Med. 2005;6(1):29-38. doi:10.1111/j.1526-4637.2005.05014.x. [↩] [↩]
- Wailoo K. Pain: A Political History. In: Johns Hopkins University Press; 2014. [↩]
- Shiri R, Karppinen J, Leino-Arjas P, Solovieva S, Viikari-Juntura E. The Association between Smoking and Low Back Pain: A Meta-analysis. Am J Med. 2010;123(1):87.e7-87.e35. doi:10.1016/j.amjmed.2009.05.028. [↩]
- Shi Y, Weingarten TN, Mantilla CB, Hooten WM, Warner DO. Smoking and Pain: Pathophysiology and Clinical Implications. Anesthesiology. 2010;113(4):977-992. doi:10.1097/ALN.0b013e3181ebdaf9. [↩]
- Bair MJ, Robinson RL, Katon W, Kroenke K. Depression and Pain Comorbidity: A Literature Review. Arch Intern Med. 2003;163(20):2433. doi:10.1001/archinte.163.20.2433. [↩] [↩] [↩]
- Goesling J, Clauw DJ, Hassett AL. Pain and Depression: An Integrative Review of Neurobiological and Psychological Factors. Curr Psychiatry Rep. 2013;15(12):421. doi:10.1007/s11920-013-0421-0. [↩]
- Jylhä M. What is self-rated health and why does it predict mortality? Towards a unified conceptual model. Soc Sci Med. 2009;69(3):307-316. doi:10.1016/j.socscimed.2009.05.013. [↩]
- Idler EL, Benyamini Y. Self-Rated Health and Mortality: A Review of Twenty-Seven Community Studies. J Health Soc Behav. 1997;38(1):21. doi:10.2307/2955359. [↩] [↩]
- Okifuji A, Hare B. The association between chronic pain and obesity. J Pain Res. Published online July 2015:399. doi:10.2147/JPR.S55598. [↩]
- Stone AA, Broderick JE. Obesity and Pain Are Associated in the United States. Obesity. 2012;20(7):1491-1495. doi:10.1038/oby.2011.397. [↩]
- Murray CB, Groenewald CB, De La Vega R, Palermo TM. Long-term impact of adolescent chronic pain on young adult educational, vocational, and social outcomes. Pain. 2020;161(2):439-445. doi:10.1097/j.pain.0000000000001732. [↩]
- Johannes CB, Le TK, Zhou X, Johnston JA, Dworkin RH. The Prevalence of Chronic Pain in United States Adults: Results of an Internet-Based Survey. J Pain. 2010;11(11):1230-1239. doi:10.1016/j.jpain.2010.07.002. [↩]
- Jonsson AC. Prevalence and intensity of pain after stroke: a population based study focusing on patients’ perspectives. J Neurol Neurosurg Psychiatry. 2006;77(5):590-595. doi:10.1136/jnnp.2005.079145. [↩]
- Borsook D. Neurological diseases and pain. Brain. 2012;135(2):320-344. doi:10.1093/brain/awr271. [↩]
- McBeth J, Symmons DP, Silman AJ, et al. Musculoskeletal pain is associated with a long-term increased risk of cancer and cardiovascular-related mortality. Rheumatology. 2008;48(1):74-77. doi:10.1093/rheumatology/ken424. [↩]
- Gaskin DJ, Richard P. The Economic Costs of Pain in the United States. J Pain. 2012;13(8):715-724. doi:10.1016/j.jpain.2012.03.009. [↩]
- Mullins PM, Yong RJ, Bhattacharyya N. Impact of demographic factors on chronic pain among adults in the United States. PAIN Rep. 2022;7(4):e1009. doi:10.1097/PR9.0000000000001009. [↩] [↩] [↩] [↩] [↩]
- Kroenke K, Wu J, Bair MJ, Krebs EE, Damush TM, Tu W. Reciprocal Relationship Between Pain and Depression: A 12-Month Longitudinal Analysis in Primary Care. J Pain. 2011;12(9):964-973. doi:10.1016/j.jpain.2011.03.003. [↩]
- Nahin RL, Feinberg T, Kapos FP, Terman GW. Estimated Rates of Incident and Persistent Chronic Pain Among US Adults, 2019-2020. JAMA Netw Open. 2023;6(5):e2313563. doi:10.1001/jamanetworkopen.2023.13563. [↩]


