
Abstract
Injuries in the NFL have been a common occurrence since the establishment of the league, especially lower-limb injuries. Currently, a lot of studies conduct individual assessment of each factor that correlates to injury prediction but there is a gap in addressing how many of these individual factors could play a cohesive role into how lower-limb injury occurs. Therefore, this study aims to utilize the power of various machine learning (ML) models to investigate the effectiveness of using multifactorial injury conditions to predict lower-limb injuries in NFL players. Four initial models—Random Forest, Gradient Boosting, Extreme Gradient Boosting, and Neural Networks—were evaluated. The Random Forest classifier emerged as the most effective, achieving an accuracy of 71.71%, precision of 73.73%, and recall of 68.18%, but to further enhance predictive performance, four variant models—AdaBoost, Bagging, Stacking and Voting Classifiers—were built upon the Random Forest base. AdaBoost yielded the highest performance with an accuracy of 90.91%, precision of 89.45%, and recall of 89.45%. A model with such high accuracy, consistent prediction, and large improvement in recall could help predict certain conditions that correlate with the likelihood of specific lower-limb injuries and allow NFL teams to take preventative measures when those conditions do occur.
Introduction
The NFL or National Football League is a professional American football league featuring 32 teams that compete in high-intensity, full-contact games combining strategy and athleticism, fighting to win the globally celebrated Super Bowl championship.
However, as part of the sport, in the last decade, there has been a 15.4% increase in lower extremity injuries, such as ACL tears and meniscus tears, in the league1. This rise in injuries has drawn increasing criticism regarding player safety, with concerns growing about whether enough is being done to protect athletes2. In response to this, the NFL introduced recent rule changes, such as increasing yardage for touchbacks to minimize kick returns, in an effort to reduce injury risks. While the league claims that the measures taken to tackle this issue has reduced up to 24% of leg injuries in the sport, the issue remains contentious, as the NFL continues to face lawsuits over injury rates yearly3.
In order to specifically understand the influence of lower-limb injuries, we must examine how lower-body injury risks have been a key disruptor of the NFL’s gameplay and how certain aspects of the game have impacted the effect of leg injuries. For example, league-wide data from the NFL’s electronic health record system (EHR) found that knee injuries account for 29.3% of lower-body injuries, followed by injuries to the ankle (22.4%), thigh (17.2%), and foot (9.1%)4. Lower body injuries are common in the NFL as the legs are typically the target point when a defensive player tackles an offensive player, but various factors play into the significance of the injury5. Currently, much of the analysis on the correlation between injury conditions and lower limb injury risks focuses on individual relationships between specific factors and their impact on injury rates. Thus, through analyzing the relationship between the conditions the players are known to face—such as field surface, weather phenomenon, player fatigue, play call, roster position, and environmental factors— and the resulting injury, we can predict and prevent these multi-factor injuries. To further examine this relationship between injury factors and injury rates, we can use deep learning models and algorithms to find complicated trends and make complex predictions for this dilemma6. Unlike traditional statistical methods, which often assume linear relationships and rely on manually specified injury factors, deep learning models can identify intricate, non-linear interactions between multiple variables through multiple processing layers, allowing them to capture more complex patterns and make more accurate predictions from high-dimensional data. Additionally, multi-factor modeling can enhance predictive capability better than single-factor modeling because the algorithms can simultaneously learn from multiple sources of information, capturing complex interactions between different features. Using the NFL 1st and Future (NFL1AF) dataset, we will test various ML models to estimate the conditions under which the probability of lower-limb injury risk increases in order to prevent them from reoccurring should similar conditions appear again.
A model that explores the identification of conditions and their influence on lower limb injury risks was conducted by Toner 2022, creating an extreme gradient boosting model that identified injury-causing conditions through training machine learning data from the EHR dataset7. Though the model focuses on similar aspects to the model we are trying to establish in this paper, the fundamental difference between the two lies in the factors that both models consider. The EHR dataset focuses only on the condition of the player on a game-to-game aspect, including fatigue from games started, height, weight, age, team, and years in the league. In comparison, the NFL1AF dataset uses some aspects of the player, but we will also use environmental and player position conditions like play call and weather from the dataset to analyze injury risks on a play-to-play basis.
Another model conducted by Lawrence et al. 2016 uses ML to understand the influence of extrinsic risk factors (environmental factors) on NFL lower-limb injury rates. To identify which specific extrinsic factor plays the largest role in injury risks, this study develops a regression model where the inputs are the specific circumstances under which an injury occurred, and the output is the number of occurrences8. Lawrence et al. 2016 recorded data about the extrinsic conditions when the lower-limb injuries occurred during the 2013-14 and 2014-15 season for all 32 teams to create their dataset. Like the previous two papers, this paper solely focuses on individually assessing environmental factors to weigh its influence on lower-limb injury rates. In contrast, the NFL1AF dataset includes environmental factors alongside a variety of other player-related factors from the dataset, creating a comprehensive and ideal prediction model for lower-limb injury risks.
Previous papers and studies like the ones mentioned have mostly handled injury-causing elements in isolation, which is where my paper synthesizes all of the variables to provide a cohesive view of injury risks, giving a predictive model that offers insights unavailable in the isolated analyses. A research gap exists in the current literature, as existing studies we have mentioned often overlook the effects of other injury factors on individual factor correlation to injury rates, and they play a role in the resulting injury the player faces. The reason for the model presented in the paper is straightforward to develop a predictive system guided by informed feature selection and proper model tuning in correlation to each factor’s influence on injury rates, enabling the analysis of multiple conditions and factors simultaneously, rather than isolating the effects of each condition on injury risks. By addressing this gap, the paper provides a more comprehensive and accurate prediction of injury risks through covering all recordable injury factors. Creating such a model could provide improved predictive injury data not only to the NFL, but also to sports teams worldwide, offering a foundation for teams to implement targeted preventative measures to reduce the risk of lower limb injuries. By identifying high-risk injury conditions, coaches and medical staff can adjust training loads, rest schedules, or in-game strategies to minimize injury risk, ultimately improving player health and longevity and allowing for tailored injury prevention programs and more informed decisions about player recovery, rehabilitation, and performance optimization.
Data
Data Source
The data used for this paper is a dataset from the NFL database called the NFL 1st and Future datasets (NFL1AF)9. The NFL1AF is a dataset constructed to give the general public access to injury records, player data, and player movement from the 2019 NFL season. The NFL1AF dataset is divided into two individual datasets that we will utilize in this paper. Firstly, the PlayList, which consists of 258965 plays ran during the 2019 NFL season, lists all the internal (player movement/position) and external (environmental) conditions of the player during the play in general regardless of whether they are injured or not, and the InjuryRecord, with 106 recorded data of lower-limb injury occurrence, highlights the specific plays that resulted in those lower-limb injuries.
Pre-Processing
The original injury record dataset contained seven columns, and the play list dataset had twelve columns. After reviewing the role of each column, it became clear that some were redundant or unnecessary. For example, columns like Days Missed (DM_M1, DM_M7, etc.) could track a player’s injury history but added complexity without enhancing the model’s understanding. Additionally, several columns between the datasets were repetitive, offering similar values that could be removed for better performance. Based on this, a list of the columns that the model will utilize from the injury record dataset are PlayKey and BodyPart, while columns used from the play list included PlayKey, RosterPosition, StadiumType, FieldType, Temperature, Weather, and PlayType. Next, each of the final columns was carefully cleaned, addressing issues like missing or abnormal values. For instance, StadiumType initially had 31 values due to misspellings and redundant entries, so it was reclassified into Indoor and Outdoor categories. Similar processes were carried out for Weather, which became the new column IsRainy, which is divided to wet conditions (rain, snow, humid, dew), and dry conditions (sunny, partly cloudy, windy), and PlayType, which became OfficialPlayCall (run or pass). RosterPosition was a little different, with extra positions like Kickers and Quarterbacks removed due to the lack of data regarding those positions in the InjuryRecord data. This model focuses on player-to-player contact roster positions for the purpose of this current study. The rest of the columns were already provided with organized data and did not require editing.
Additionally, in order to easily account for all the conditions, the NFL1AF datasets were merged into a singular easy-to-use dataset via the PlayKey columns located in both datasets. The convenient aspect of the PlayKey column is that it has the same order throughout both datasets, facilitating a smooth merge. This combined dataset can now include all the necessary inputs for the machine learning model to conduct analysis on. Understanding this, the following new datasets were generated for the ML model to test with: InjuryConditions which was created through merging InjuryRecord and PlayList to gain data for all of the inputs specifically for injured players only (the model will find trends through this dataset), and NonInjuryConditions, which consists of the PlayList dataset, except the PlayKey(s) from InjuryConditions were removed in PlayList to gain data for all of the inputs specifically for non-injured players only (the model will apply the trends into this dataset).
Exploratory Data Analysis
In exploratory data analysis, it is crucial to identify which inputs are beneficial towards the ML model and which are not10. This can be analyzed through observing the relationship between the input columns of the InjuryConditions dataset and the output column, BodyPart, which is the area of the leg injured during a play, based on the conditions the player faced11.
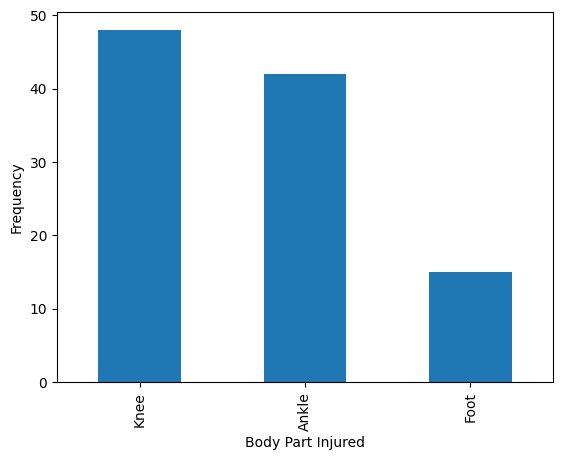
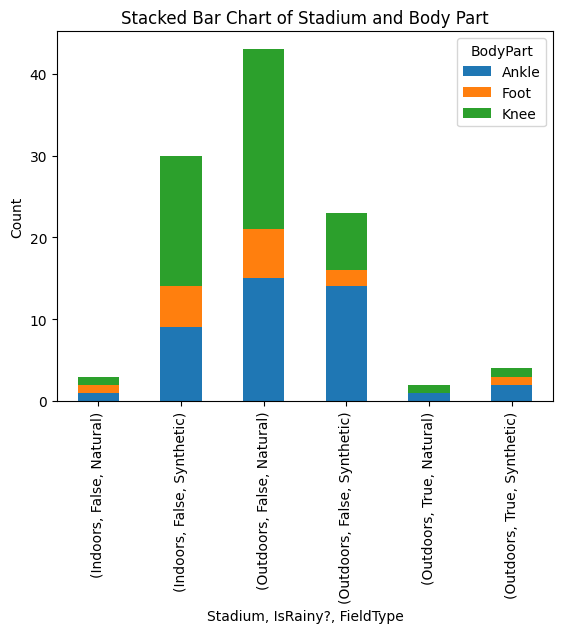
Figure 2 shows the correlation between OfficialStadiumType, IsRainy, and FieldType. Indoor stadiums tend to have a lower injury rate compared to outdoor stadiums, largely because they shield players from unpredictable weather conditions like rain, snow, and extreme temperatures12. By eliminating these external factors, players experience a more controlled and consistent environment, reducing risks like slipping or weather-related injuries that are more common in outdoor stadiums. The data correlation is valuable as it also considers events during outdoor games, where weather conditions directly impact gameplay, providing insight into how external factors, such as rain or extreme temperatures, contribute to lower-limb injuries13. In contrast, indoor stadiums eliminate these weather-related risks, allowing for a more accurate assessment of environmental factors’ influence on player safety. Lastly, the bar plot reveals that more knee and ankle injuries occur on synthetic turf than on natural grass, likely due to the unique grip between cleats and turf, which leads to injuries like torn ACLs14. The increased friction and firmness of synthetic surfaces are significant factors in injury risks, and this paper will explore these factors in the broader context of the InjuryConditions dataset.
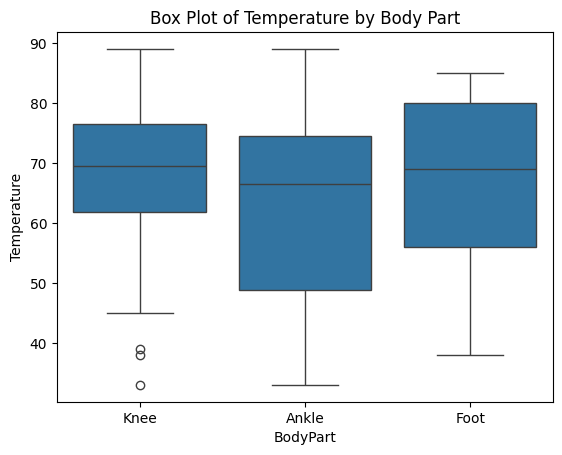
Shown in Figure 3 is the correlation between Temperature and BodyPart. Note the outliers on the knee injuries. While it may be seen as a distractor for the model, injuries during temperatures usually occur during extreme temperatures15. As a result, the outlier could be seen as a benefit to the model as well and this can be tested in the Methods section of the paper. Injury rates appear to be influenced by all ranges of temperature, with knee injuries more frequent in extreme conditions, ankle injuries occurring across a range of temperatures, and foot injuries being more common in cooler weather. While these differences may seem subtle, they provide valuable insights into how temperature variations can affect specific body parts when combined with other external factors like the weather during the time, as well as whether it was an indoor stadium creating a controlled climate. Our ML model can help us with understanding this relationship in a detailed manner.

When factoring in the context of the play call, including the positions of players on the field and the conditions during the play, such as weather and temperature, the AI processes a highly intricate dataset.
Data Split
The InjuryConditions data was split into training and test data using an 80/20 split. Additionally, the random state of this split was set to 42 across all the models tested in this paper, ensuring that there was consistency in the training data that the models adjusted towards, and the test data was the same for all the models, which helps to provide better accuracy, precision, and recall under the same conditions for those models16. Using a new number each trial would mean that every model got different training and testing datasets which is not fair to use as comparable results. Therefore, using the random state value of 42, which is universally used in a lot of other papers as well, can create similar data for the models to compare with.
Methods
Discussed in the paper are four different ML models: Random Forest, Gradient boosting, Extreme Gradient Boosting, and Neural Network. To determine which model performed the best, a GridSearch Cross Validation was conducted with each of the initial four models to determine the best hyperparameters that would provide the ideal accuracy, precision, and recall. First, after the dataset inputs were set into the models, the program split the training data into a smaller training set and a validation set. Next, each model uniquely trained on every combination of given hyperparameters using the smaller training set, and then tested those combinations with the validation set to compare the results. Finally, after a 5-fold validation run with each hyperparameter combination, the program identified the most beneficial hyperparameters for each model. This practice of analyzing different hyperparameters is crucial in addressing the imbalance data problem in the InjuryConditions dataset, as previously mentioned in the IsRainy correlation graph with BodyPart in the exploratory data analysis 18. Some of the parameters will help curve the weight of underrepresented sections of the dataset, which will create enhanced models that won’t be influenced by data imbalance and are more reliable to analyze. However, potential sampling biases in the dataset, such as overrepresentation of specific conditions or player positions, were identified and mitigated through stratified sampling, ensuring balanced representation during model training. Additionally, class imbalance was handled by assigning higher weights to injury cases during training and incorporating metrics like the F1-score to evaluate the trade-off between precision and recall more effectively.
The first standard model created was a Random Forest classifier model. A random forest classifier operates by taking small subsets of the training set data and creating multiple parallel decision trees in parallel to establish a final classification of the combination of decision trees in a process called “bagging”. Unlike individual Decision Tree classifiers, this model takes the opinion of multiple decision trees to make a better majority opinion. The hyperparameters that were tested for this model include the number of estimators, the depth of the model’s training, minimum split of nodes, and maximum number of features (factors) analyzed in each node.
The second standard model created was a Gradient Boosting Classifier (GBM) model. A gradient boosting classifier operates by building decision trees sequentially, where each new tree attempts to correct the errors made by the previous trees. Unlike random forests, which build trees independently, gradient boosting combines these trees in a stage-wise fashion. The final classification is determined through a process called “boosting,” where each tree’s contribution is weighted and added to minimize the overall error of the model. The hyperparameters tested for this model include the number of estimators, the learning at which each new weak decision tree contributes to the final prediction, the depth of the model’s training, and the subset of training data that is trained on.
The third standard model created was an Extreme Gradient Boosting model. Extreme Gradient Boost operates similarly to a gradient boosting classifier by building decision trees sequentially, with each new tree correcting the errors made by the previous trees. However, Extreme Gradient Boost differs from GB models through regularization to reduce overfitting, parallel processing instead of direct processing, and improved handling of sparse data. The final classification is determined by a weighted combination of all the trees, optimized to minimize error through gradient descent. The hyperparameters tested for this model include the learning rate, number of estimators, the max depth of the model’s training, and the colsample_bytree or subsample ratio of columns when constructing each decision tree.
The fourth standard model created was a Neural Network (NN) model. Neural networks function by simulating how the human brain processes information, using multiple layers of interconnected nodes (neurons). Each neuron takes inputs, applies weights and biases, and passes them through an activation function. Neural networks learn through a process called backpropagation, where errors are propagated backward to adjust the model’s weights, optimizing performance. The hyperparameters tested for this model include the size of the hidden layers, activation that allows the model to learn non-linear patterns in terms of data, the learning rate, and the initial value of the learning rate used during training.
Considering the relatively small size of the InjuryConditions dataset (107 rows), simpler models like Random Forest were prioritized due to their lower risk of overfitting, while more complex models like Neural Networks faced challenges in extracting meaningful patterns from limited data. This trade-off highlights the importance of aligning model complexity with dataset size to ensure reliable and generalizable predictions.
Results
After identifying ideal parameters and running training combinations, the models began to train the original training set from the 80-20 split to identify recurring trends, and then compare it with the test data. Based on the results, the best model will return a high value of accuracy, precision, and recall.
| Accuracy | Precision | Recall | Ideal Hyperparameters | |
| Random Forest | 71.71% | 73.73% | 68.18% | max_depth: 7max_features: ‘sqrt’min_samples_split: 10 n_estimators: 50 |
| XG Boost | 66.67% | 68.18% | 63.63% | colsample_bytree: 1.0 learning_rate: 0.01max_depth: 3n_estimators: 50 |
| Neural Network | 63.63% | 60.60% | 63.64% | activation: ‘tanh’, hidden_layer_sizes:150learning_rate:’constant’, learning_rate_init: 0.001 solver: ‘sgd’ |
| Gradient Boosting | 63.64% | 49.49% | 60.60% | learning_rate: 0.001 max_depth: 4n_estimators: 50subsample: 0.8 |
Table 1 shows the accuracy, precision, and recall of each model on the test set through ideal hyperparameters found through GridSearch cross validation. The table was organized from best accuracy at the top to worst accuracy model at the bottom. After all four models ran, the Random Forest Classifier model was identified as the best performing model for the dataset provided. It had an accuracy of 71.71%, a precision of 73.73%, and a recall of 68.18%. In comparison, gradient boosting had decent accuracy, but had precision rates of approximately 50% which meant the model’s prediction of values were all over the place. Additionally, the neural network, while having a significantly better precision rate, was still a little weak in its accuracy just like gradient boosting. Lastly, extreme gradient boosting showed promising results but was a little weak in its recall. A low recall would mean that the model is predicting a lot of false negatives. This means the model was misidentifying the probability of lower-limb injury which could lead to further injury risk than expected. RandomForest was ultimately the most promising model as it had the best accuracy, precision, and recall to the point where it can be considered a good starting model to explore.
However, The Random Forest Classifier model can be further boosted through additional models that stack on top of the Random Forest to create more complex and enhanced models. As a result, an additional four models were called that utilized the RandomForest classifier as the base estimator: AdaBoost, Stacking Classifier, Bagging Classifier, and Voting Classifier. Again, a GridSearch Cross Validation was conducted for each model to detect the ideal hyperparameters for the best results.
| Accuracy | Precision | Recall | Ideal Hyperparameters | |
| AdaBoost | 90.91% | 89.45% | 89.45% | n_estimators: 100learning rate: 0.01 |
| Bagging | 84.84% | 85.85% | 81.80% | n_estimators: 100cv_mean: 0.333 |
| Voting | 75.76% | 80.80% | 77.78% | n_estimators: 100voting = ‘soft’ |
| Stacking | 69.70% | 61.61% | 63.63% | n_estimators: 100max_iter=1000 solver=’lbfgs’ |
Overall, most of the models showed considerable improvement from the original RandomForest Classifier model. The AdaBoost classifier, which assigns higher weights to the misclassified instances in the Random Forest decision trees, performed the best with an accuracy of 90.91%, a precision of 89.45%, and a recall of 89.45%. The increase in recall was especially important because the model reduces the chances of misidentification of an injury not happening when it actually does happen. While less than AdaBoost, the Bagging Classifier, which builds multiple parallel decision trees using bootstrapped samples of the training set and averages their predictions, also had a higher degree of precision and accuracy than RandomForest. The Voting Classifier, which combines the predictions from multiple random forest classifiers by aggregating their votes, showed minor improvements in accuracy, but still had a higher recall and precision from the original RandomForest classifier model. However, the Stacking classifier model, which identifies the predictions of several RandomForest classifiers and uses a meta-model to aggregate their outputs, performed much worse than the original RandomForest classifier model, especially in precision and recall.
For the most part, each model improved from the last, leading to the RandomForest classifier model, and then the enhanced AdaBoost to the original model.
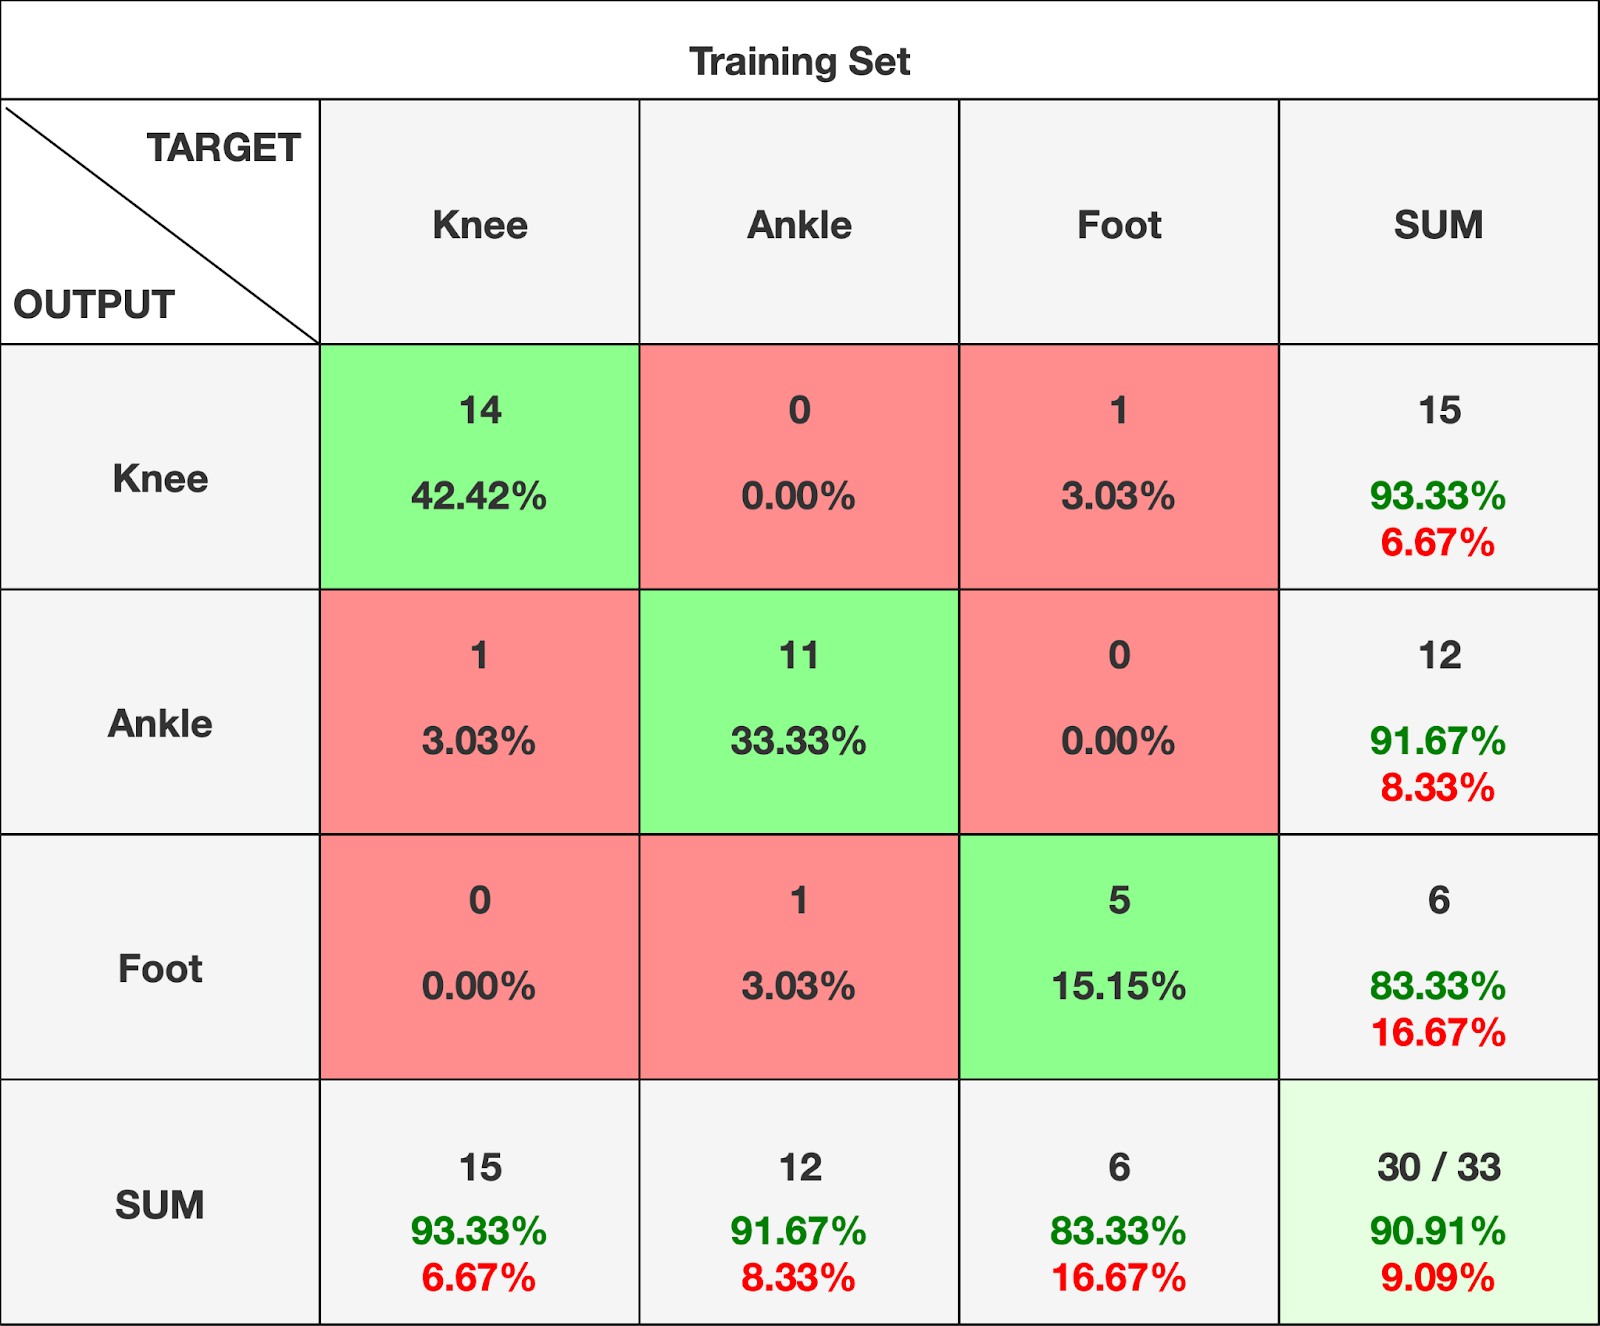
The relationship between accuracy, precision, and recall of AdaBoost can be visualized in Table 3 in the form of a confusion matrix. A confusion matrix is used to evaluate the performance of our model by summarizing the counts of true positives, true negatives, false positives, and false negatives. The bottom SUM of values shows recall, and the right SUM of values shows precision. As previously mentioned, a low recall could result in misidentification of lower-limb injuries through false negatives. This could be detrimental to a player’s career if the model predicted a lower-limb injury wouldn’t occur, but a player goes on to suffer a season-ending lower-limb injury. Luckily, the confusion matrix does not show this possibility for the most part. Additionally, a false positive may lead to unnecessary precautionary measures, such as rest days or sidelining players, which could disrupt team dynamics or affect player performance. This wastes valuable resources for the team and the league while it does continue to prioritize player protection. This also does not happen a lot in the confusion matrix. The boxes labeled in green predicted the area of lower-limb injury correctly17.
Discussion
Implications and Significance
Ultimately, the results in the models presented show that the field of lower-limb NFL injury prediction through identifying trends in differentiating factors is a potential possibility that will help remove the constraints established by individual factor assessment on injury risks.
The RandomForest classifier model performed the best out of the initial four models presented. Its performance across the merged InjuryConditions dataset can be attributed to the model’s characteristics and design. RandomForest is specifically designed to perform efficiently with categorical variables through multiple decision trees that factor out based on the weight of each variable towards the output18. And based on the results, the RandomForest classifier model had a promising start, achieving the highest accuracy (71.71%) and precision (73.73%) among the baseline models. Yet, the RandomForest classifier model was still somewhat weak due to the model’s low recall rates despite its promising accuracy and precision. It indicates that the model is failing to correctly identify a significant number of relevant instances, which could be caused by the poor feature balance and representation. This means that the model is less effective at preventing injuries because it overlooks many cases that require intervention or closer monitoring. Therefore, to better guide the RandomForest model, model-enhancing boosting classifiers were considered to support the RandomForest model. The AdaBoost (Adaptive Boosting) Classifier performed the best out of the four enhanced models. Due to AdaBoost’s emphasis on the Random Forest model to further analyze the misclassified instances that especially led to such a low recall on the original model, the resulting model did not only yield higher accuracy and precision, but a bigger leap in recall19.
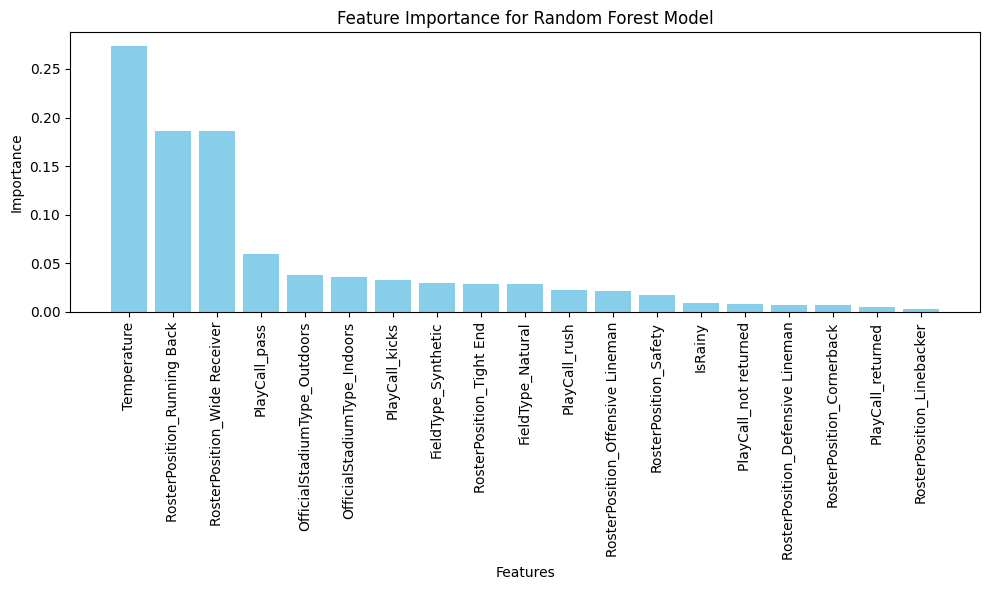
Figure 5 illustrates how the AdaBoost model assigned weights to each input during the learning process, focusing on the one-hot encoded categorical values and the numerical Temperature values from the InjuryConditions dataset. This is the feature importance of the final model. This was done during the normalization and data pre-processing procedure in order to help the model better understand the data we are providing it with. When the model ran, it began to assign different amounts of weight to each input provided to see if it could find a trend that matched the training set data before applying its results on the test data to output the metrics of the model. Based on our results in Figure 5, the following was deduced:
- The factor most relevant to identifying the area of lower-limb injury was the Temperature at the game, followed closely by the roster position of Wide Receiver and Running Backs
- The pass and kickoff play call, and the type of stadium the player played in were fairly important.
- The field surface the player played on, the rush play call, and the offensive roster positions had a measurable influence, but it was less than several other factors.
- The weather the players played in, the kick return play call, and defensive roster positions were barely a factor but still had a role in the model.
These findings matter because it represents ML’s potential application not only in the NFL, but within the general sports environment in terms of making sure the player is healthy, safe, and is able to commit to their game without the fear or risk of injury. By taking preventative measures based on certain injury conditions through our model’s prediction, the player wouldn’t face similar injuries if similar conditions appeared again. This can be proven by using the trends detected by the AdaModel in InjuryConditions to predict probabilities that an area of the lower limb gets injured in the NonInjuryConditions dataset.
| PlayKey | RosterPosition | Knee | Ankle | Foot |
| 30038-1-4 | Wide Receiver | 0.314 | 0.552 | 0.134 |
| 26089-5-2 | Cornerback | 0.459 | 0.273 | 0.268 |
| 22124-3-7 | Offensive Lineman | 0.314 | 0.320 | 0.372 |
| 39929-8-16 | Linebacker | 0.411 | 0.321 | 0.268 |
| 20021-12-1 | Running Back | 0.459 | 0.407 | 0.134 |
As shown in table 4, random PlayKey(s) have been extracted from NonInjuryConditions as a sample to compare. It is important to note that the PlayKey values shown all faced similar conditions in all inputs and factors for each roster position. This paper’s significance and potential for future research is represented in the table. As mentioned in the literature review, a lot of similar papers have only considered the impact of one defining factor or condition as the basis for injury rates. This paper tries to understand whether multiple factors can be inputted to create a better, advanced model, and so far, it has shown promise.
Limitations
The final model faced several limitations, primarily due to the nature of the inputs and the dataset used. The first challenge was the balance of the six inputs, which were somewhat disproportionally weighted in their contribution to producing a single output. If there had been more input features, the model might have created a cohesive trend where the disproportionality of the weight would have been mixed into the multitude of inputs the model utilized, creating a better ML algorithm in the process.
Similarly, most of the inputs were categorical, which introduces specific challenges in machine learning. Categorical inputs, when one-hot or label encoded, can create high-dimensional data that may dilute relationships between features. This can also lead to overfitting, as the model may focus too much on specific categories that might not generalize well to unseen data. The handling of categorical variables also makes it difficult to capture underlying relationships between categories without more advanced techniques such as model-enhancing algorithms or embeddings like AdaBoost to further understand the minor, undetectable differences in categorical data to identify a trend20.
Additionally, another significant limitation was the size of the InjuryConditions dataset. The small dataset of 107 rows meant that the model was possibly overfitting to the training data, making it less representative of real-world cases. A larger, more diverse dataset would have provided the model with more robust patterns, reducing the risk of overfitting and improving its generalizability20.
Regardless of these limitations, the model was still able to achieve great accuracy, precision, and recall, and successfully identified trends based on the given data. Using a small dataset with a few variety of inputs is a start into slowly exploring the effect of utilizing multi-factors in sports injury risk studies to predict injury rates.
Conclusion
The goal of this study was to analyze and extract information from multiple state-of-the-art ML models and algorithms on the InjuryConditions dataset and their improved uses within sports injury prediction. The resulting model performed well across all three measured metrics: accuracy, precision, and recall. Three standard models were initially built, in addition to the eventual starting model, with each successive model performing relatively better in those metrics than the last. An additional three enhanced models were built, in addition to the resulting enhanced model, with each model showcasing further efficiency in metrics comparison than the last. To achieve this, the data was split into 80% training data and 20% test data. Afterwards, every initial and enhanced model were trained using GridSearch Cross Validation to find the ideal hyperparameters. Finally, each initial model was tested on the test set to find the initial results, followed by the testing of enhanced models on the test for optimal results. Based on these series of steps, the Random Forest Classifier model was the eventual starting model, and the AdaBoost(Adaptative Boosting) Classifier model was the resulting enhanced model that provided promising results for potential future research.
The model created in this paper could work together alongside with other models, helping us gain access to high amounts of predictive information about the multiple complex injury risks beyond the lower-limb injuries we have discovered. Already discussed in the introduction and literature review were the works by Toner 2022 & Lawrence et. al 2016, which uses different models to focus on different sets of common input patterns as defining factors of injury risks21’8. However, the model works in tandem with these projects by providing a new perspective into addressing the common problem that has been plaguing the sporting world. It allows us to possibly have a complete picture of lower-limb injury risks by being able to understand each factor’s individual influence on injury rates through the literature review papers on top of the resulting model that was created by merging all those factors to identify a trend for lower-limb injuries. This could still mean that individual factor review can contribute heavily if a multi-factor scenario is addressed. Additionally, this method could be applied to concussion rates or other bodily injuries during sports as well.
Though there were a few limitations due to the size of the dataset and the characteristics of those factors, the final model still performed well. It should be considered that this study only focuses on the conditions that NFL players face and the type of lower-limb injuries they face. Further testing is required for this method in other sport leagues under different conditions to that of the NFL (Major League Baseball, Premier League(soccer), etc.). In the end, we want to incentivize future research into addressing the problem through the multi-factor method so that a more efficient injury prediction system can be established. This could help fill a gap in the scientific community since our multi-factor method utilizes situations and conditions that past papers and models may have not considered as potential solutions. This perspective of injury risk analysis could even be considered and addressed beyond AI model-making methods towards other fields of science including psychology and biology (sports medicine) to provide new perspectives about this issue every day.
References
- E. Phillips. (2023, October 16). Are injuries increasing in the NFL?. Norse News. https://shsnorsenews.org/7884/sports/are-injuries-increasing-in-the-nfl/. [↩]
- M. Smith. (2023, January 20). The NFL must prioritize players’ safety and humanity. Chicago Policy Review. https://chicagopolicyreview.org/2023/01/19/the-nfl-must-prioritize-players-safety-and-humanity/. [↩]
- J. Battista. (2024, February 2). NFL’s prioritization of player safety leads to promising injury data for 2023 season. NFL Football Operations. https://operations.nfl.com/updates/the-game/nfls-prioritization-of-player-safety-leads-to-promising-injury-data-for-2023-season/. [↩]
- C. D. Mack, R. W. Kent, & M. J. Coughlin. (2020, June 2). Incidence of lower extremity injury in the National Football League: 2015 to 2018. The American Journal of Sports Medicine, 1. Retrieved July 7, 2024. [↩]
- B. Shuck. (2024, March 25). The hip-drop tackle in the NFL: Dangerous or necessary?. Dawgs By Nature. https://www.dawgsbynature.com/2024/3/25/24110988/nfl-hip-drop-tackle-rule-nfl-dangerous-or-necessary. [↩]
- T. Olavsrud. (2024, February 9). How AI is helping the NFL improve player safety. CIO. https://www.cio.com/article/1306736/how-ai-is-helping-the-nfl-improve-player-safety. [↩]
- M. Toner. (2022, April 22). Identifying factors that lead to injury in the NFL. Bryant Digital Repository. https://digitalcommons.bryant.edu/cgi/viewcontent.cgi?article=1006&context=honors_data_science. [↩]
- D. W. Lawrence, P. Comper, & M. Hutchinson. (2016, March 31). Influence of extrinsic risk factors on National Football League rates. Orthopaedic Journal of Sports Medicine. https://journals.sagepub.com/doi/full/10.1177/2325967116639222. [↩] [↩]
- A. Howard. (2019). NFL 1st and Future – Analytics. Kaggle. https://www.kaggle.com/competitions/nfl-playing-surface-analytics/data. [↩]
- S. Morgenthaler. (2009). Exploratory data analysis. WIREs Comp Stat, 1, 33–44. [↩]
- G. McCurdy (Ed.). (2021, December 3). Common injuries in football by position. Delta Paw Print. https://deltapawprint.com/1546/sports/common-injuries-in-football-by-position/. [↩]
- U. Gökçe, A. Dalboy, N. An, M. T. Turp, & L. Kurnaz. (2022, March 30). Potential risks of outdoor sports in a changing climate. Dergi Park Academics. [↩]
- L. Lawhorn. (2022, March 8). Dome field advantage – The Paisano. The Paisano – Independent Student Newspaper for the University of Texas at San Antonio. https://paisano-online.com/29258/sports/dome-field-advantage/. [↩]
- C. M. Straw, C. O. Sampson, G. M. Henry, & C. N. Brown. (2020, March 12). A review of turfgrass sports field variability and its implications on athlete–surface interactions. Agronomy Journal. https://acsess.onlinelibrary.wiley.com/doi/abs/10.1002/agj2.20193. [↩]
- S. C. S. Souza, J. W. Castellani, M. P. Dupuis, K. E. Friedl, W. Sullivan-Kwantes, & B. R. M. King. (2022, May 29). Human vulnerability and variability in the cold: Establishing individual risks for cold weather injuries. Taylor and Francis Online. https://www.tandfonline.com/doi/full/10.1080/23328940.2022.2044740. [↩]
- G. Sahagian. (2020, December 24). Why is Random State 42?. Medium. https://grsahagian.medium.com/what-is-random-state-42-d803402ee76b. [↩]
- Iguazio. (2024, February 15). The importance of recall in prediction rates. https://www.iguazio.com/glossary/recall/. [↩]
- M. Wright, & I. König. (2019, February 7). Splitting on categorical predictors in random forests. PeerJ. https://www.ncbi.nlm.nih.gov/pmc/articles/PMC6368971/. [↩]
- Y. Cao, Q.-G. Mao, J.-C. Liu, & L. Gao. (2013, November 21). Advance and prospects of AdaBoost algorithm. Acta Automatica Sinica. https://www.sciencedirect.com/science/article/abs/pii/S187410291360052X. [↩]
- T. C. Au. (2018, September). Random forests, decision trees, and categorical predictors. Journal of Machine Learning Research. https://jmlr.csail.mit.edu/papers/volume19/16-474/16-474.pdf. [↩] [↩]
- M. Toner. (2022, April 22). Identifying factors that lead to injury in the NFL. Bryant Digital Repository. https://digitalcommons.bryant.edu/cgi/viewcontent.cgi?article=1006&context=honors_data_science. [↩]


 and a Developing (India) Economy")