
Abstract
The construction of several high-rise buildings has been a response to the rapid urbanization experienced in Indian cities, with implications for air quality and wind flow patterns. Setting aside the impacts of the urban heat island effect, which exist in some of India’s urban centers because of dense development, this study seeks to analyze the relative influences of building density, height, and spacing on wind movement and pollution dispersion through a design/build study using the wind tunnel. Data for five cities— New Delhi, Kanpur, Patna, Lucknow, Varanasi— were obtained from air quality index (AQI) platforms and remote sensing methods based on density, building height, with PM2.5 conditions ranging between 85–150 µg/m³, and respective average wind speeds of 8-15 km/h, and building heights with relative inter-building spacing of 15–35 meters. Three cities, with varying building intensities – Navi Mumbai (low density), Lokhandwala (medium density), and Gurugram (high density) – were selected for the scaled models testing. Building layouts of each of those three cities were used in scaled models that were 3D printed at a 1: 300 scale using SolidWorks, FlashForge Adventurer 3, and PLA. The models were placed inside a custom-built wind tunnel with a size of 1.5 m × 0.6 m × 0.9 m designed to simulate wind speeds between 25.7–77.1 m/s across the wind tunnel, relating to realistic urban wind speeds of 10–15 km/h in real-world applications. The models also simulated the dispersion of controlled powder tracers designed to mimic PM2.5 under identical wind angles of 0° and 45°. The numbers show that Gurugram had the most pollutants, especially when spacing was less than 20 m (although we found no difference in pollutants up to individual spacing distances). The spacing for Navi Mumbai was better than Gurugram, so the wind was able to continue to disperse 30-40 meters past the buildings. Lokhandwala had lower distances at 45 or even 90 degrees. Pollution dispersion possibly took places best in the 25-35 meter spacing area. In general, this study provides practical information for urban planners suggesting that if zoning ordinances can be changed to modify distances between buildings, or the orientation of buildings especially in high-density areas, could lead to delays in the accumulation of pollution pathways. This study though was limited to having only scaled models and operating in a wind tunnel, that could basically guarantee consistency for testing conditions, while real world circumstances are impacted by other factors like surface roughness, variability in atmospheric conditions and microclimate.
Keywords: Urban air pollution, PM2.5 dispersion, building density, wind tunnel testing, inter-building spacing
Introduction
The rapid expansion of urban areas had resulted in the construction of large numbers of tall buildings, which had changed wind patterns and air quality in these regions. This urban growth had led to increased pollution from automobiles and industries concentrated in cities. High-rise buildings had also contributed to the pollution problem by influencing air movement and causing stagnation near ground level, particularly in congested urban zones. Prior research had suggested that tall buildings altered near-ground atmospheric processes, thereby affecting the dispersion of pollutants. For instance, A. Shirzadi, H. Fattahi, A. Rajabi, and R. Zand-Parsa in their study “Air pollution in the vicinity of skyscrapers: experimental and numerical analysis”1 had examined the influence of skyscrapers on pollution accumulation and turbulence generation in dense urban regions.
To study these effects in detail, researchers had utilized specially designed wind tunnels and 3D-printed city models to simulate real urban environments. Using a geometric scale of 1:300, representative cityscapes had been built inside controlled experimental setups. Wind flow had been examined from various orientations (0°, 45°, and 90° building angles) and wind speeds (10–15 km/h) to analyze how urban density impacted contaminant dispersion and airflow. These experiments had allowed precise control over environmental parameters, offering insights into how building form and spacing influenced air circulation and pollutant concentrations. H.D. Lim, Y. Zhao, T. Kataoka, and H. Uehara, in their paper “Pollutant dispersion by tall buildings: laboratory experiments and Large-Eddy Simulation”2, had demonstrated the effectiveness of combined wind tunnel tests and LES simulations in studying pollutant transport dynamics around tall structures.
Alternative solutions had also been explored to mitigate the challenges caused by vertical urban expansion. Urban planners had increasingly considered increasing building porosity and incorporating green infrastructure to improve air movement. Additionally, regulating building heights and spacing had been proposed to enhance wind circulation and pollutant dispersion. For example, J.P. Vidanpathirana, D.K.W. Yuen, and R.W. Yeung in their work “Morphological impacts on urban air pollution dispersion”3 had emphasized how spacing between buildings significantly affected pollution mitigation. Furthermore, architectural developments like green roofs and vertical gardens had helped reduce air pollution by trapping pollutants and supporting passive ventilation. This approach had been echoed by Y. Chen, S. Wang, J. Xie, and J. Jiang in their paper “Influence of 3D building configurations and tree plantings on urban pollutant dispersion”4.
Therefore, the present study adopted a mixed-methods approach—combining field data collection with experimental simulations—to examine the effect of building height and wind speed on urban pollution levels. Cities with low, medium, and high pollution rates had been selected for this analysis. Wind tunnel models had been constructed to simulate urban environments under various wind speeds and angles. Pollution loads were monitored in different model zones to evaluate how deeply pollutants penetrated and accumulated.
This research was highly relevant to urban planners. It had provided a clearer understanding of how vertical expansion altered a city’s wind dynamics and pollution patterns. The study had offered actionable techniques for developing sustainable urban designs that prioritized air quality and public health amid rapid urbanization. These conclusions had aligned with the findings of F. Li, Z. He, C. Liu, and Y. Lin, who in their work “Optimization of urban design to reduce PM2.5 pollution”5 had proposed practical solutions to mitigate PM2.5 concentrations through improved city layouts.
Literature Review
The research by Shirzadi et al. tackled the problems related to the analysis of air pollution in urban areas in the vicinity of skyscrapers. Emissions from vehicles in thick urban environments, particularly near road intersections, resulted in sky-high concentrations of pollutants. This raised major health concerns. Moreover, the researcher noted the influence of urban buildings on pollution distribution: irregular shapes and the existence of smaller structures near the skyscrapers ushered in turbulence, further complicating the dispersal of pollutants through the air. On the other hand, the lack of a sufficient number of experimental tests was the main issue; due to this, the models that were applied were not validated1.
Elsa Aristodemou et al. worked on the application of the Large Eddy Simulation (LES) method combined with wind tunnel experiments in this approach to the computational fluid dynamics (CFD) problem. Using these two methods together, it was possible to model the transportation of pollutants and conduct experimental validation. In the analytical part, two studies were considered with two main objects: an independent tall building and another one standing among lower ones. In conclusion to this, it could be said that the buildings around modifiers at higher levels led to higher emissions. Finally, it was inferred that the maximum concentration was at two-thirds the height of the high-rise, which was five times higher than in the isolated situation. It was duly noted that the top-level inhabitants were in danger of high pollution. Moreover, the study also stated that the transport of air pollutants was a complicated process and that turbulent diffusion among components made it even harder6.
The study by Ding et al. examined the impact of air movement and pollutant spread in city areas through the fluctuation in the building heights and widths. The paper concerned the negative side effects of pollutants gathering near buildings, particularly high-rise buildings, on the environment. Relying on the Production-Limited Eddy Simulation (PLES) technique, they performed threat modeling of airflow experiments and contaminants around separated buildings. The tests of the models used different building sizes, and they were validated with some experimental data from Tokyo Polytechnic University7.
He et al. investigated the interrelationship between high-rise urban forms and wind environments in Macau with the dense Areia Preta reclamation area. The paper discussed important problems such as inadequate ventilation, urban heat islands, and the dangers of typhoon winds in high-density residential areas. Through PHOENICS computational fluid dynamics software, the researchers mimicked the wind conditions during both regular days (seasonal monsoons) and extreme weather events (typhoons). The study analyzed the impacts of building sizes, street designs, and urban canyon directions by supplementing with field survey data and local urban planning standards8.
This study by Vidanpathirana et al. dealt with air pollution problems in high-populated urban environments and referred to several fast-developing cities, such as Colombo in Sri Lanka. It pointed out pollution issues due to the lack of ventilation and traffic emissions that worsened the air quality in the areas with dense building clusters. They focused on identifying how building morphology affects urban air pollution dispersion. By examining factors such as wind flow and the role of buildings as obstacles, the research aimed to give a new perspective on reducing pollution in future development plans. Furthermore, the study also indicated a knowledge gap in implementing urban forms and planning strategies that could lead to optimal improvements in the efficiency of ventilation3.
Chen et al. delved into the problem of urban air pollution and focused on the role of 3D building configurations and tree plantings in pollutant dispersion and building intake fractions. The study underlined the issues of pollutant buildup and air quality management inefficiency arising from poorly designed urban areas, which intensified the environmental problems. CFD simulations were employed to model the effect of various building geometries and vegetation layouts on airflow and pollutant behavior in urban areas. The researchers came up with elaborate simulations to find out how these factors affected the pollution spread and pollution concentration around the intake points of the buildings4.
Fan Li et al. addressed the challenges associated with urban air quality, referring to the dispersion of PM2.5 pollutants in Shijiazhuang City, China. The principal issue on which researchers focused was to find the optimal urban designs to diminish air pollution concentrations and improve public health conditions. To find solutions to these problems, they tried to come up with approaches to strategically rearrange roads and trees in the city to enhance the wind velocity and reduce the pollution effects. In solving this problem, the scientists made use of Computational Fluid Dynamics (CFD) methods, with the standard k-ε model and the Disperse Phase Model (DPM). The research discussed how city arrangement designs could be improved so that they decreased pollutant levels and increased ventilation in cities9.
Lim et al. addressed the air pollution distribution problem in the study of tall buildings in urban areas. The results were that these buildings played a part in airflow and pollutant spreading, which had been affected by buildings in the surrounding areas. The project aimed to highlight the influence of the tower through the sky-high congestion of air which were the “rooftop shear layers” impacting both vertical upleash and pollutants transportation10.
Aristodemou et al. were trying to solve the problem of skyscrapers that not only disturbed the air flows but also became the source of pollutant dispersion in the cities. The ever-rising number of skyscrapers in cities had given rise to new energy flow, which in turn had implications for the effectiveness of air quality management across the urban landscape, which was vital for urban planning and air quality management activities. Their interest lay in the perception of those buildings and the spatial diversity derived from airflow modifications, especially in the centers of our cities11.
The study by Yang et al., with their colleagues, was about the growing problem of air pollution stagnation in high-density urban areas and the tremendous consequences for human health and urban liveliness. The research demonstrated that various types of urban forms (i.e. building height, orientation, and density) impacted the wind flow pattern, which then affected the exhaust emissions. Ineffectively ventilated urban areas, represented by calm wind zones or virtual formations, were one of the main contributing factors to the accumulation of air pollutants in such environments. These findings highlighted the need for strategic urban planning to mitigate pollution-related health risks12.
Yu et al. investigated the air pollutant diffusion behavior near high-rise buildings with different angles of wind incidence, pointing out the importance of wind direction on pollutant concentrations and distribution. Their study showed that buildings could either block or channel the wind flow depending on the wind angle, thereby impacting the pollution levels near pedestrian areas. This research emphasized the need for precise modeling and wind tunnel testing to optimize urban planning decisions13.
Hertwig et al. studied the variability of physical meteorology in urban areas at different scales and its implications for air quality. The researchers highlighted the effect of urban morphology on local meteorological conditions, influencing pollution dispersion. Their study underscored the importance of considering multiple spatial scales when assessing urban air quality and designing mitigation strategies14.
Kuo et al. explored pedestrian-level wind fields in street canyons downstream of parallel high-rise buildings. The study revealed how building arrangements affected airflow at pedestrian heights, influencing comfort and pollutant dispersion. Understanding these wind patterns could inform the design of more livable urban environments15.
Liu et al. performed wind tunnel tests to investigate indoor air pollutant dispersion and cross-contamination around typical high-rise residential buildings. Their research provided insights into pollutant transmission pathways in indoor and adjacent outdoor environments, crucial for designing healthier residential buildings5.
Methodology
City Data Collection
The research began by carefully investigating the availability of updated data about the chosen cities regarding density, pollution, and wind which was the reference point of the study. With city maps, the local AQIs of the areas, and the data platforms of the government or private meteorological services, data regarding the main indicators was obtained for many urban zones. Metrics such as average wind speeds, pollution levels (PM2.5), building heights (both the tallest and the shortest), and distances between the buildings were recorded. Historical and contextual studies like Yang et al.12 and Huang et al.16 provided background information to ensure the parameters chosen matched globally recognized research standards. High-resolution 3D remote sensing imagery, along with urban planning datasets derived from satellite-based building footprint maps and elevation models, were utilized to analyze city structures. Supplementary data from CPCB’s hourly PM2.5 pollution records and wind patterns were also integrated. Table 1 highlights Indian cities with high pollution levels and a dense concentration of high-rise buildings.
| City | Average Pollution Rate (PM2.5) | Average Wind Speed | Average Height of Buildings | Height of Tallest Building | Height of Shortest Building | Average Distance Between Buildings | Tallest Building Name | Source |
|---|---|---|---|---|---|---|---|---|
| New Delhi | 120–150 μg/m³ | 10–15 km/h | 20–40 meters | 43 meters | ~10 meters | 20–35 meters | Leela Palace | World Air Quality |
| Kanpur | 110–140 μg/m³ | 10–12 km/h | 15–25 meters | 35 meters | ~10 meters | 15–25 meters | Motijheel Apartments | AQI Kanpur |
| Patna | 100–130 μg/m³ | 8–10 km/h | 20–30 meters | 45 meters | ~12 meters | 20–30 meters | Takht Sri Harmandir Ji Patna Sahib | AQI Patna |
| Lucknow | 90–120 μg/m³ | 8–12 km/h | 20–35 meters | 55 meters | ~10 meters | 20–35 meters | Sahara City Homes | AQI Lucknow |
| Varanasi | 85–115 μg/m³ | 8–10 km/h | 15–25 meters | 50 meters | ~10 meters | 15–25 meters | Ramada Plaza JHV | AQI Varanasi |
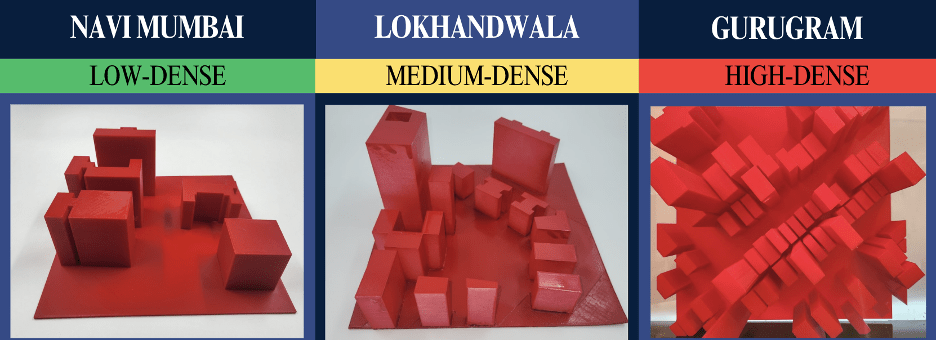
The decision on the selection of cities was driven by the different urban densities, wind patterns, and pollution dispersion characteristics to give a complete picture of the environmental impacts of high-rise buildings. Navi Mumbai, Lokhandwala, and Gurugram were the three cities selected to represent low, medium, and high urban densities, respectively. Navi Mumbai with an average building height of 30–40 meters and a relatively large span between buildings provided information about the relative wind speed. Lokhandwala, a city known for medium-density urbanization and architecture with an average height of 25–35 meters, was used to test turbulence and pollution dispersion. Gurugram is characterized by its high-density areas and tall buildings with a height range of 30-50 meters, and a minimum inter-building spacing space, thus showing the problems of pollutant retention and urban heat island formation.
3D Printing of the City Model
To conduct an exact experimental analysis of the data, highly accurate, scaled 3D models of the selected city zones were built using advanced 3D printing technology. figure 1 shows this model. The first stage of the experiment was to model the setup using 3D design software. PLA was used in this method of urban features to demonstrate practical examples of durability and precision operations. After printing the models at the given scale, their design remained the same as the real ones. The 3D models of this kind were the backbone for carrying out experiments in a wind tunnel with proper supervision, thus enabling wind flow modifications and pollutant movement to be observed in different urban densities. This approach guaranteed that in confidently controlled situations real urban cases were displayed correctly.
Wind Tunnel Design
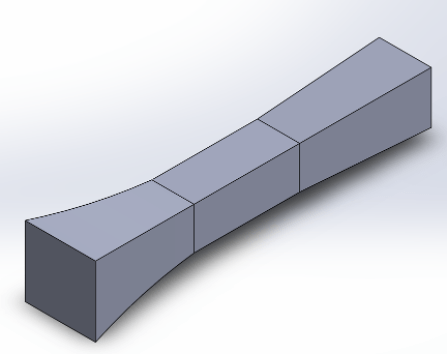
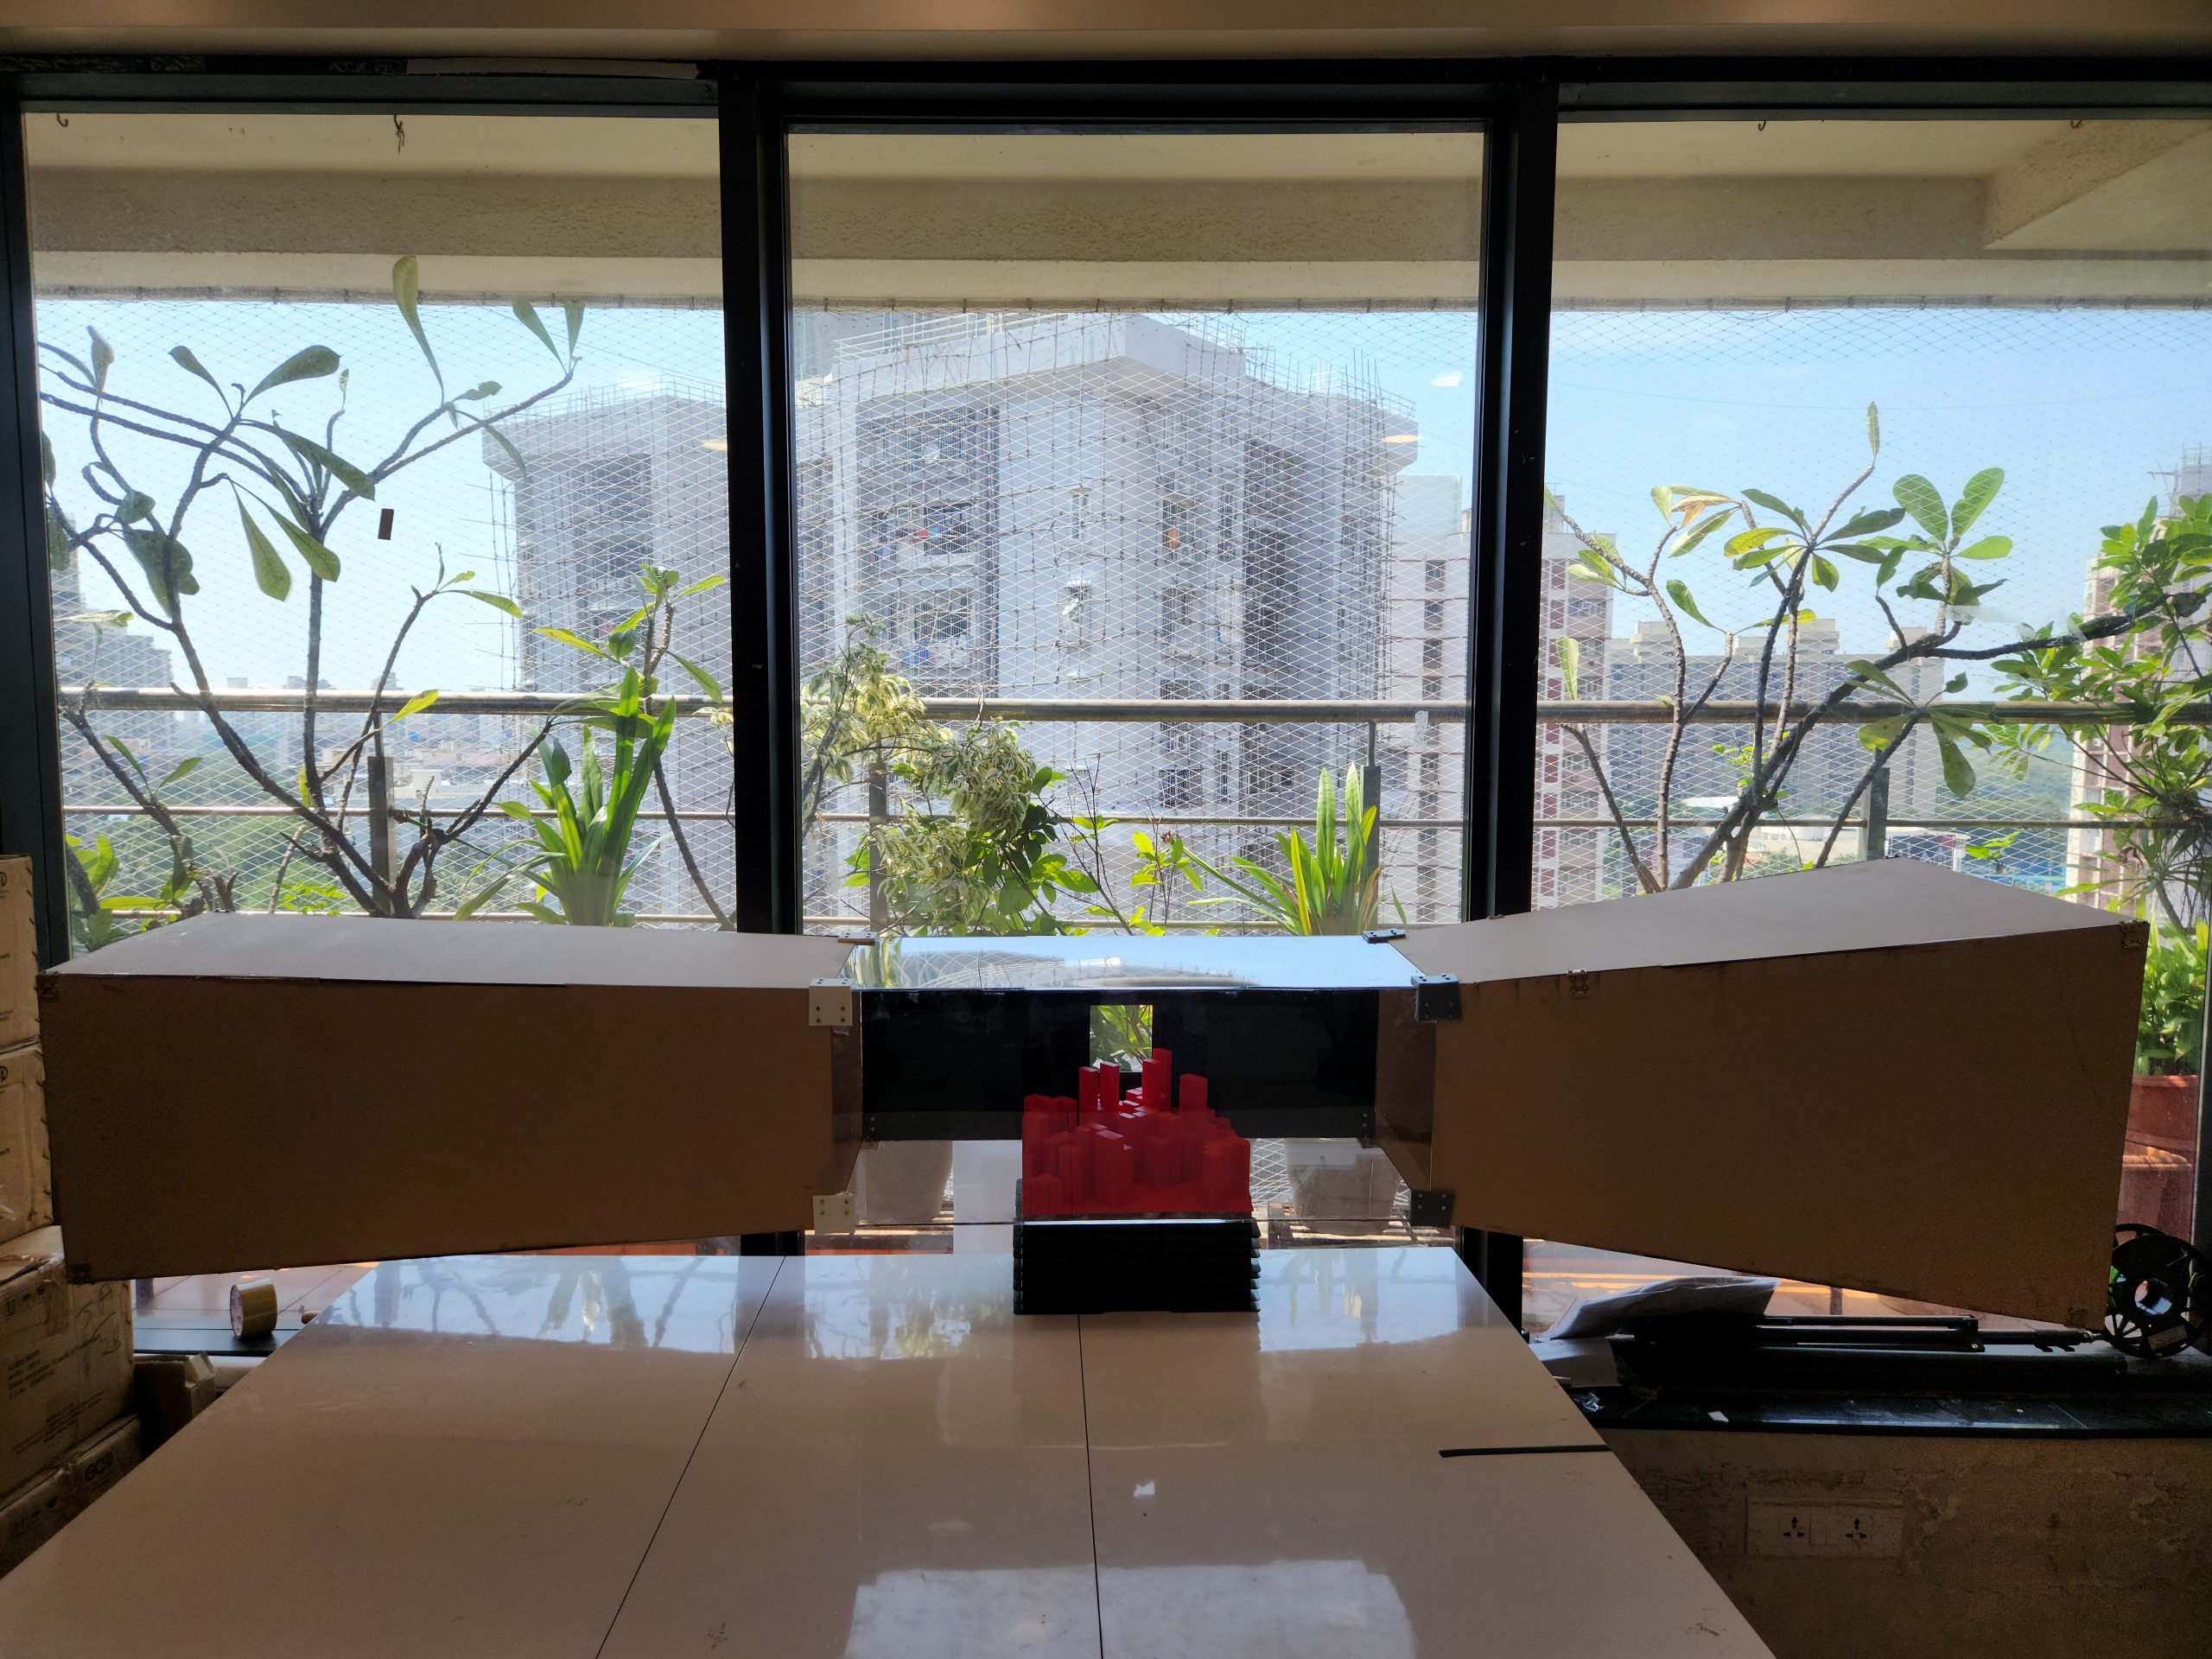
The wind tunnel section shown in Figure 2, has been scaled down in order to study the effect of high-rise buildings on urban wind flow and the dispersion of pollution. The scaling process was made feasible by adopting the full-scale dimensions of commonly used high-rise buildings whose representative heights and widths are based on city construction standards. Scaled building models got their heights and widths properly lowered so that they could be accommodated within the wind tunnel dimensions by using a scaling factor of 1:11. For the wall effects to be minimized during testing, a safety factor of 1/3 was included in the test section dimensions. The test section’s width and height of 1.5m and 0.6m, respectively, were fixed, providing a cross-sectional area of 0.225m². The length of the test section was fixed at 0.9m which would give a testing length enough considering the scaled dimensions of the buildings.
The volumetric flow rate was determined from an airspeed interval of 25.7 to 77.1 m/s with an average of 50 m/s, which is out of the consideration of urban wind speeds and turbulence intensities. The corresponding flow rate is 247.5 cubic meters per second, which is the same as 524,422.8 cubic feet per minute (CFM).Two configurations for the fan placement were examined and for experimental result powder was randomly dispersed manually by placing the fan in the inlet , to generate turbulence or at the outlet to ensure the continuity of the laminar flow without any fluctuations. The latter option was selected to minimize the turbulence and thus reduce the use of flow dynamic controls. To attain flow uniformity, honeycomb straighteners, and mesh screens were designed with a cell diameter-to-length ratio (L/D) of 10 and a pressure drop coefficient of 0.2.
The contraction portion of the device has been constructed specifically to ensure faster traveling of air and less friction with the test section. A contraction ratio (CR) of 3 to 6 was employed along with a half-angle of 8°; thus, besides the axis, cones are characterized by half of cone angles which may range between 5 and 9. Thus, in this layout, the length of the contraction section would be about 2 m. The shut-off areas of the contraction were adjusted correspondingly to the dimensions of 1.5 m by 0.6 m of the test section. Here the diffuser is credited with the recovery of the static pressure and in order to achieve this, its 4° expansion angle has been taken advantage of to suppress separation. The length was calculated by contraction ratio which was 5, and they acquired the cross-section of the exit part with the enlarged diameter of 0.45 m². 0.8 m was found to be the suitable length. The introduction of the grilled surfaces makes the flow uniform by inducing a pressure drop of 0.05 Pa for each surface, with a total pressure reduction of 0.12 Pa from the honeycomb straightener. These design aspects represent the fact that the test section is capable of a scaling factor, preservation of even fluidity, and pressure dissipation through the test section. The testing results of all three cities are explained in the next section of the paper.
Results and Discussion
Wind Dispersion Patterns Across Cities
The wind tunnel experiment conducted across Navi Mumbai, Lokhandwala, and Gurugram offered insight into how wind interacts with different urban densities. The key parameters observed included wind speed, time duration, and the resulting height and width of the wind spread, along with impacts on heat retention and CO₂ trapping.From the data:
Navi Mumbai, a city with relatively low urban density and wider building spacing, allowed for greater wind spread. At 15 km/h, wind spread increased to 20 m height and 35 m width, indicating effective natural ventilation and minimal heat accumulation.
Lokhandwala, representing medium density, experienced moderate wind dispersion. At a higher wind speed of 12 km/h, width increased to 30 m, but the height remained 10 m, suggesting lateral spread was possible, but vertical dispersion was restricted, likely due to urban form.
Gurugram, with high-density clusters and tall buildings, exhibited poor wind dispersion initially. Even at 15 km/h, though height and width reached 25 m and 35 m respectively, these values reflected limited efficiency in pollutant clearing due to the enclosed urban fabric, leading to higher CO₂ trapping and surface heat accumulation.
Particulate Dispersion and Retention
The dispersion of particulate matter was evaluated by measuring the amount of powder spread, its concentration near buildings, and the total area of dispersion. This method provided quantitative support for how different city configurations influence pollutant spread. Since the size of powder particles resembles aerosol particle size hence powder particles exhibit similar dispersion properties.
Observations:
- Wind speed had a direct impact on dispersion area: in Navi Mumbai, a wind speed increase from 12 to 15 km/h expanded the dispersion area from 15 m² to 18 m², reducing near-building concentration from 0.3 to 0.25 g/m².
- Urban density influenced pollutant retention. Gurugram, despite higher wind speeds, had elevated pollutant concentrations (0.5 → 0.45 g/m²) due to limited ventilation caused by closely spaced high-rise buildings. The data shows how dense building forms can trap pollutants even under favorable wind conditions.
- In Lokhandwala, a moderate configuration, powder spread reduced from 12 g to 9 g, and concentration near buildings fell from 0.4 to 0.35 g/m² as wind speed increased. Dispersion area improved from 20 to 23 m², showcasing that modestly spaced urban forms provide better pollutant clearing than tightly packed clusters.
| City | Wind Speed (km/h) | Time Interval (Sec) | Powder Spread (g) | Concentration Near Buildings (g/m2) | Total Dispersion Area (m2) |
|---|---|---|---|---|---|
| Navi Mumbai | 12 | 10 | 10 | 0.3 | 15 |
| 15 | 20 | 8 | 0.25 | 18 | |
| Lokhandwala | 10 | 15 | 12 | 0.4 | 20 |
| 12 | 25 | 9 | 0.35 | 23 | |
| Gurugram | 10 | 20 | 15 | 0.5 | 25 |
| 15 | 30 | 11 | 0.45 | 30 |
Powder Dispersion Measurement
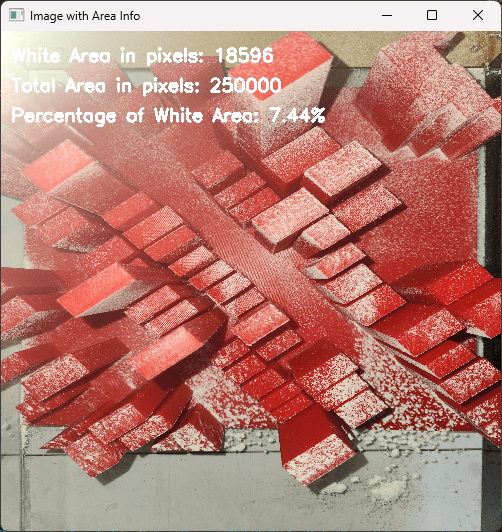
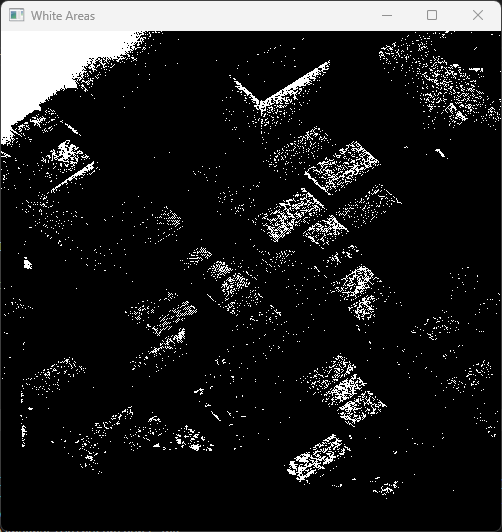
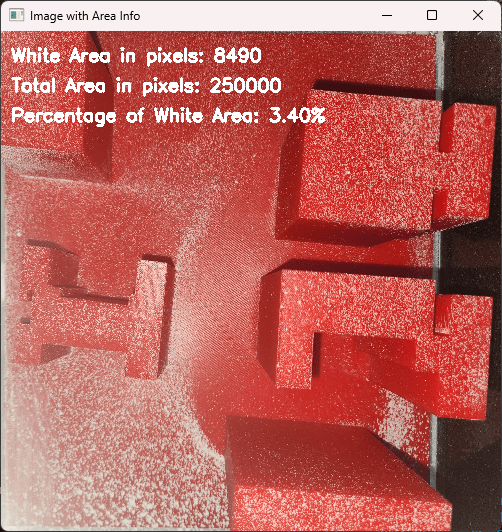
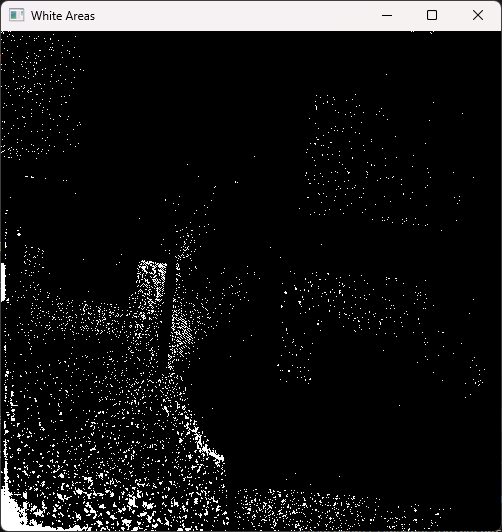
As shown in figure Post-experiment image processing was used to quantify the area of powder settlement across different urban model configurations. Binary thresholding isolated white pixel regions from top-view images, representing settled powder (analogous to PM2.5). The percentage of powder-covered surface area, denoted as Pretained was calculated for each case.
To interpret pollutant behavior, the following parameters were used:
Pollutant Retention Index
Ventilation Effectiveness Score
Empirical PM2.5 Concentration Relation
Where:
Pretained : Powder-covered area (%)
Pmax: Maximum observed powder coverage (7.4%) η: Relative indicator of airflow efficiency
Aeffective : Urban area participating in ventilation
CPM2.5: Expected pollutant concentration in real-world scenarios
| Case Type | Pertained (%) | R* | η | Interpretation |
|---|---|---|---|---|
| Medium-Density | 7.4 | 1 | 0 | Significant pollutant retention; poor ventilation |
| High-Density | 3.4 | 0.46 | 0.54 | Moderate airflow; better dispersion under test wind |
Summary of Impacts
The integrated analysis confirms three central findings:
- Higher wind speeds consistently improve horizontal pollutant dispersion, evidenced by increased spread area in all cities. However, without adequate building spacing and lower urban density, this benefit is greatly diminished.
- High-density urban environments, such as Gurugram, show greater accumulation of pollutants, higher heat retention, and lower efficiency in natural air circulation, even when wind conditions are optimized.
- Moderate-density zones like Lokhandwala strike a middle ground, offering partial pollutant clearing and moderate thermal behavior, suggesting that optimized zoning and building arrangement can balance urban growth with environmental quality.
Conclusion
This research has offered a detailed understanding of how urban density, building configuration, and spatial planning impact wind behavior, pollutant dispersion, ecological balance, and heat retention within cities. Through wind tunnel experiments using scaled 3D models of three distinct urban layouts—Navi Mumbai (low-density), Lokhandwala (medium-density), and Gurugram (high-density)—the study has highlighted the crucial role of strategic architectural planning in mitigating environmental stressors.
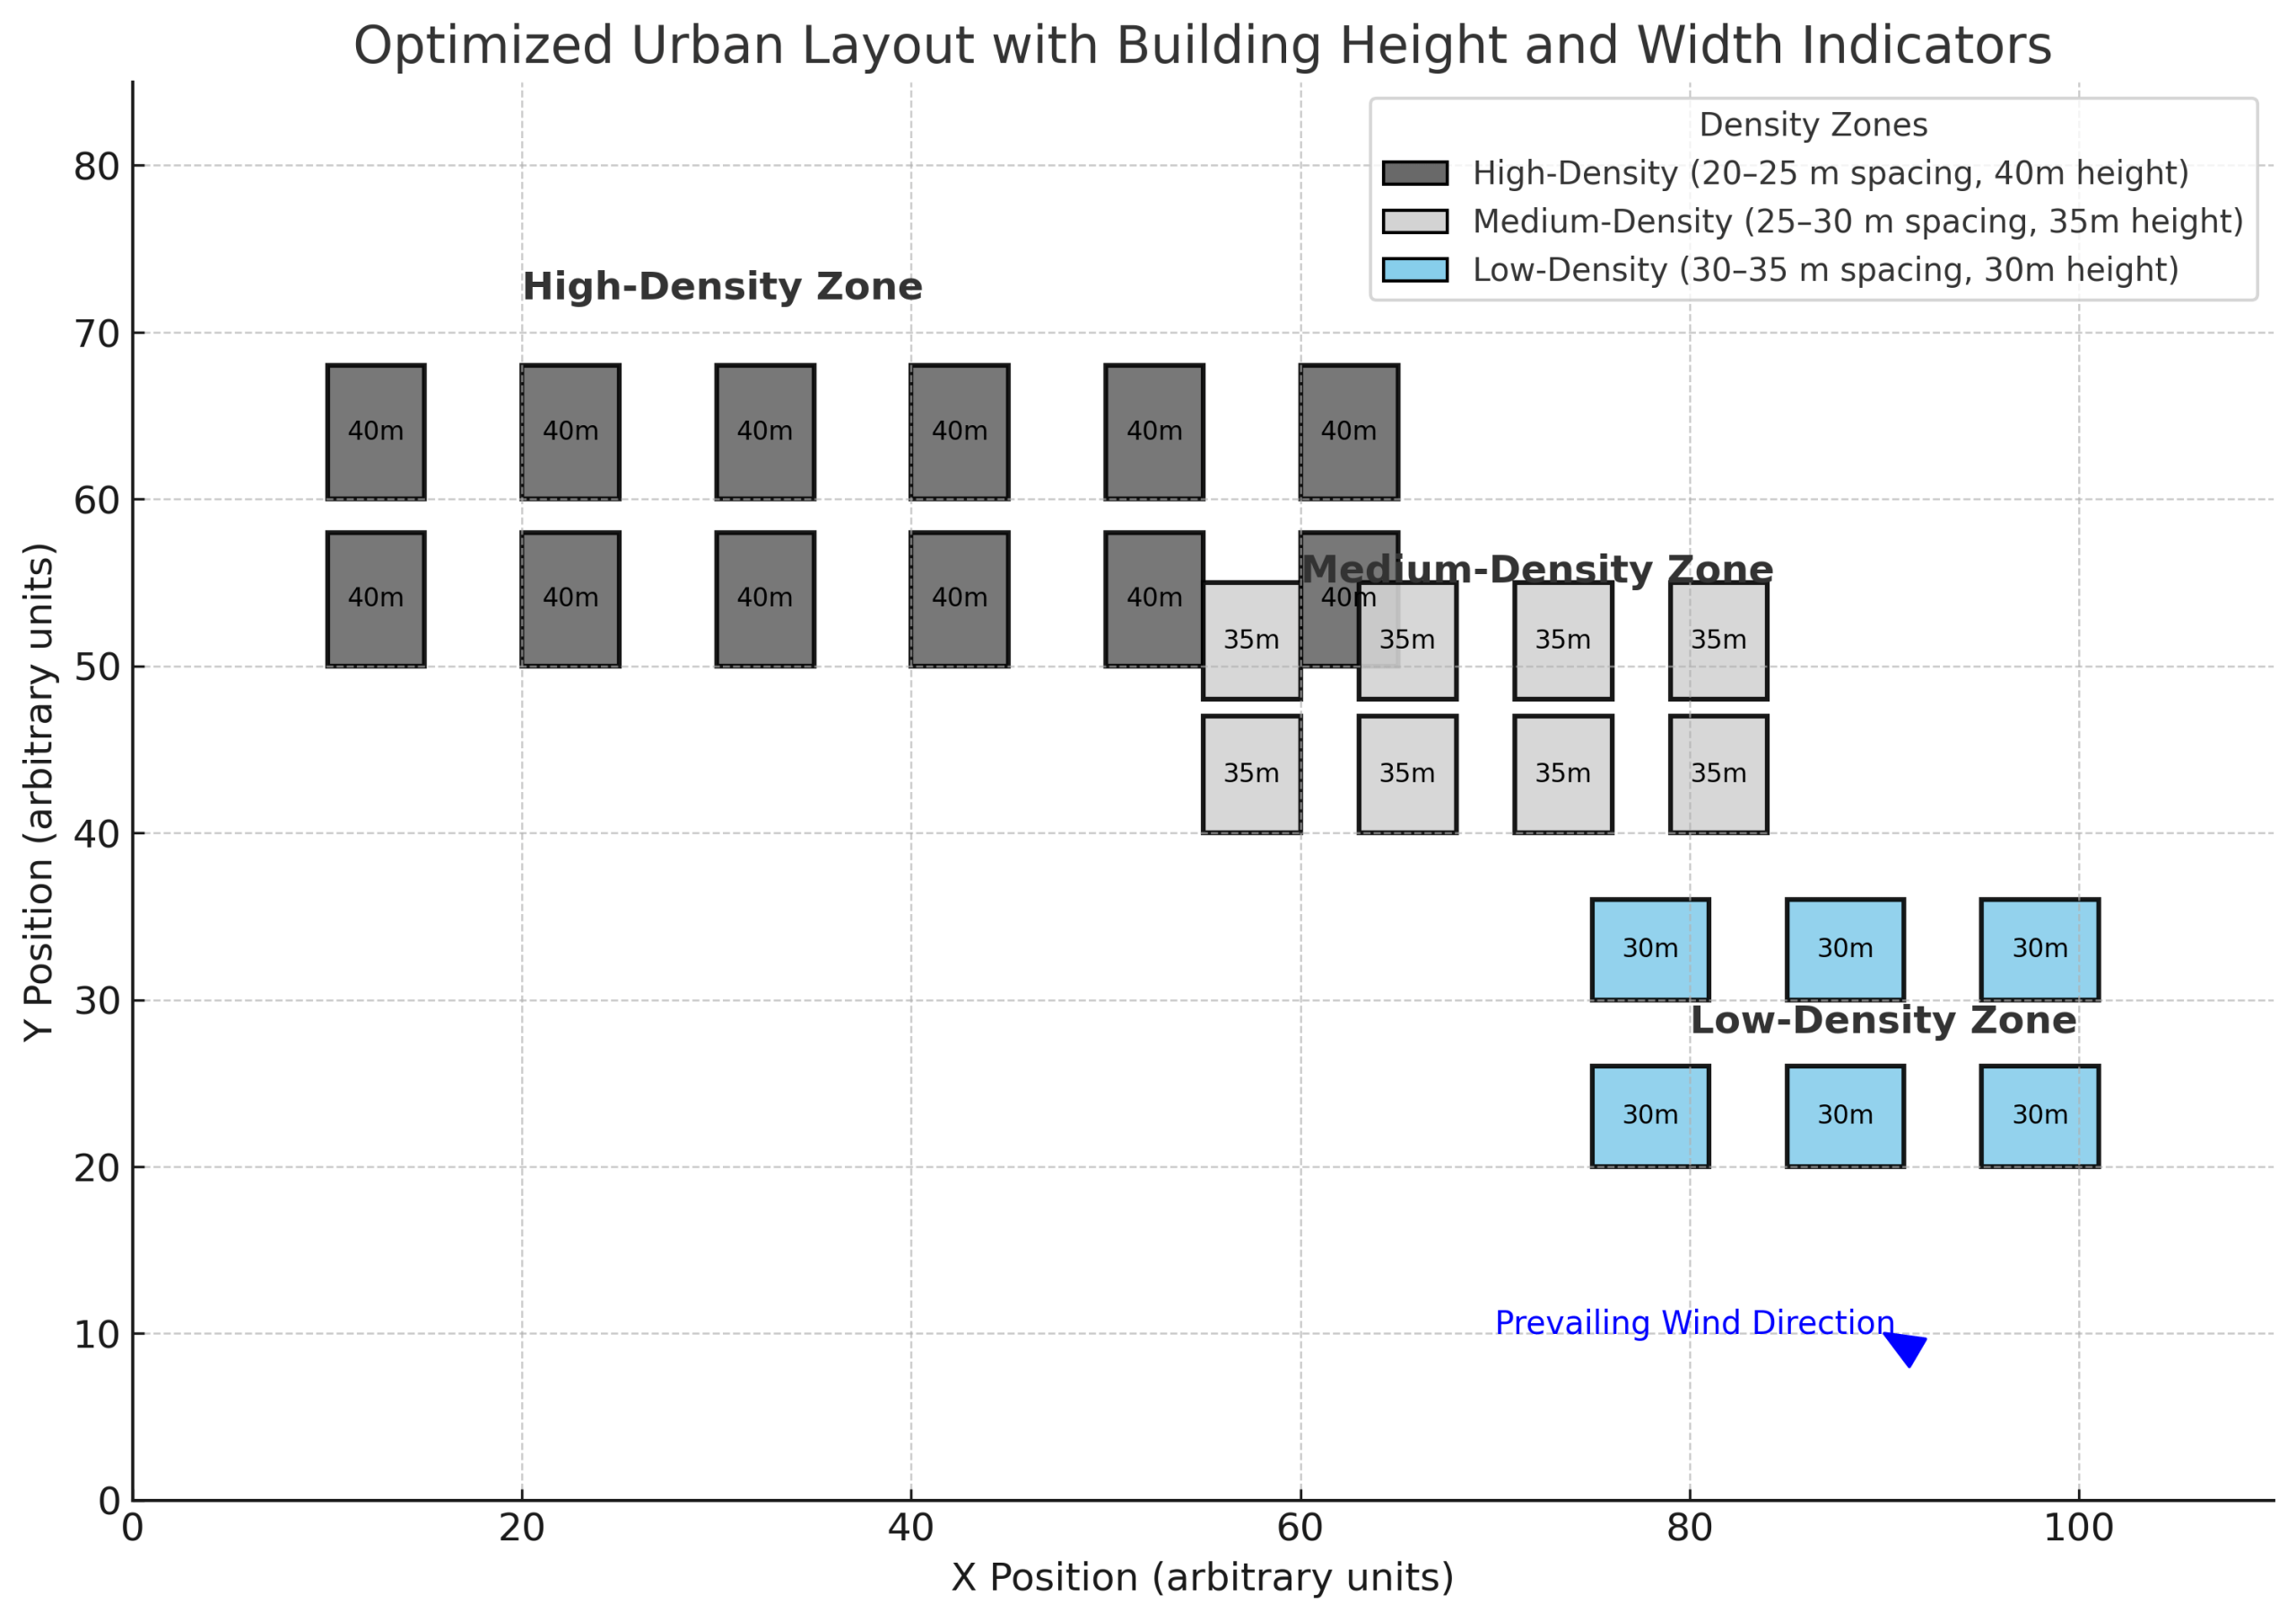
Figure 4 indicates figures of optimal building spacing for good air flow. The series of experiments was conducted to check by keeping the building at there actual spacing in real time, also by increasing the distance between the building and by decreasing the distance. In case of low-density areas such as Navi Mumbai, where there was space between 30–35 meters between buildings and it was staggered in layout, the wind flow was smooth and not turbulent. This helped the pollutants disperse better and minimized CO₂ retention and heat absorption. For example, with an increase in wind speed from 12 to 15 km/h, the dispersion area was increased from 15 to 18 m², and pollutant concentration closer to buildings decreased from 0.3 to 0.25 g/m².
Medium-density developments like Lokhandwala, with 25–30 meter inter-building distances and moderate building heights, found a balance. Airflow was stable enough but some turbulence was noted, especially at higher wind velocities. Pollution and ecological disturbance levels were moderate; however, staggered patterns still provided satisfactory pollutant dilution as well as airflow continuity.
Conversely, the high-density urban setting of Gurugram—with spacings between buildings of 20–25 meters and building heights of 40 meters—exhibited higher turbulence and pollutant trapping. Near-field pollutant concentration around buildings rose to 0.5 g/m² at 10 km/h, with the dispersion area increasing to 30 m² at 15 km/h. The urban heat island effect grew stronger because of inefficient heat dissipation.
In general, the research reiterates that ideal urban design—incorporating spacings of 25–30 meters or more, building heights of less than 40 meters, and orienting streets with the direction of prevailing winds—can remarkably improve wind distribution, prevent pollution deposition, promote ecological integrity, and alleviate urban warming. These findings provide useful lessons for future urban planning strategies towards creating climate-resilient and environmentally sustainable cities.
References
- Shirzadi et al., Air Pollution in Urban Canyons Near Skyscrapers, 2019 IEEE 4th International Conference on Computer and Communication Systems (ICCCS), pp. 582–586. https://doi.org/10.1109/CCOMS.2019.8821694 [↩] [↩]
- Lim, H. D., Zhao, Y., Kataoka, T., & Uehara, H. (2022). Pollutant dispersion by tall buildings: Laboratory experiments and Large‑Eddy Simulation. Experiments in Fluids, 63, 92. https://doi.org/10.1007/s00348-022-03123-4 [↩]
- Vidanpathirana et al., Urban Morphology and Air Pollution in Colombo: A Case for Integrating Building Form and Planning, Cities, Vol. 106, 2020, 102906. https://doi.org/10.1016/j.cities.2020.102906 [↩] [↩]
- Chen et al., Numerical Study of Street Tree Effects on Outdoor and Indoor Air Quality in Urban Street Canyons, Building and Environment, Vol. 112, 2017, pp. 322–332. https://doi.org/10.1016/j.buildenv.2016.11.046 [↩] [↩]
- Liu et al., Investigation of Indoor Air Pollution and Cross-Contamination Around High-Rise Residential Buildings Using Wind Tunnel Tests, Indoor and Built Environment, Vol. 29, No. 4, 2020, pp. 553–567. https://doi.org/10.1177/1420326X19882968 [↩] [↩]
- Aristodemou et al., CFD Modelling of the Pollutant Dispersion Around a Single Block Building Using LES and RANS, Atmospheric Environment, Vol. 140, 2016, pp. 117–131. https://doi.org/10.1016/j.atmosenv.2016.05.036 [↩]
- Ding et al., Large-Eddy Simulations of Air Pollutant Dispersion Around Isolated Buildings with Different Shape Factors, Building and Environment, Vol. 160, 2019, 106168. https://doi.org/10.1016/j.buildenv.2019.106168 [↩]
- He et al., Wind Environment Evaluation in High-Density Urban Areas in Macau: A Case Study Based on CFD Simulation, Sustainability, Vol. 12, No. 4, 2020, 1519. https://doi.org/10.3390/su12041519 [↩]
- Li et al., Numerical Simulation of PM2.5 Dispersion in Urban Street Canyons Using CFD, Journal of Cleaner Production, Vol. 203, 2018, pp. 1025–1035. https://doi.org/10.1016/j.jclepro.2018.08.287 [↩]
- Lim et al., Effects of Building Height and Layout on Airflow and Pollutant Dispersion in Urban Street Canyons, Journal of Wind Engineering and Industrial Aerodynamics, Vol. 159, 2016, pp. 89–98. https://doi.org/10.1016/j.jweia.2016.01.002 [↩]
- Aristodemou et al., How Tall Buildings Affect Airflow and Pollution Dispersion in Street Canyons: A CFD Study, Environmental Pollution, Vol. 233, 2018, pp. 782–796. https://doi.org/10.1016/j.envpol.2017.10.013 [↩]
- Yang et al., Impacts of Urban Morphology on Airflow and Particulate Matter Dispersion in High-Density Cities, Atmospheric Environment, Vol. 177, 2018, pp. 260–274. https://doi.org/10.1016/j.atmosenv.2018.01.032 [↩] [↩]
- Yu et al., Wind Tunnel Investigation of Wind Direction Effects on Pollutant Dispersion near High-Rise Buildings, Building and Environment, Vol. 146, 2018, pp. 160–172. https://doi.org/10.1016/j.buildenv.2018.09.030 [↩]
- Hertwig et al., Urban Morphology Influences on Local Meteorology and Air Quality: A Multi-Scale Approach, Urban Climate, Vol. 23, 2018, pp. 137–159. https://doi.org/10.1016/j.uclim.2017.03.007 [↩]
- Kuo et al., CFD Simulation of Pedestrian-Level Wind Environment and Pollutant Dispersion in High-Rise Street Canyons, Journal of Building Performance, Vol. 11, No. 2, 2020, pp. 97–110. https://doi.org/10.21315/jbp2020.11.2.2 [↩]
- Huang, X., Zhang, L., Li, J., & Li, Z. (2021). Impacts of high‑rise building on urban airflows and pollutant dispersion under different temperature stratifications: Numerical investigations. Atmospheric Pollution Research, 12, 100–112. https://doi.org/10.1016/j.apr.2021.02.001 [↩]


 and Family-Integrated Care (FIC): Global Trends and Local Provider Awareness in Fresno County, California")