
Abstract
It is important to study space weather in order to learn and predict the trends of solar events that could potentially greatly affect the existing human infrastructure on earth. This paper compares the electromagnetic responses recorded at various geomagnetic stations during the ‘Mother’s Day Storm’ from May 10 to May 13, 2024, which is the “strongest geomagnetic storm at Earth in two decades” according to NASA. Also, according to the Disturbed Storm Time (Dst) Index, which is provided by the Kyoto World Data Center, the Dst index reached -406 nT during this storm—the strongest after the November 2003 Storm of Dst -422 nT during November 20th, 2023. Magnetometer data and current indices were taken from SuperMag, and the Interplanetary Magnetic Field (IMF) data were taken from NASA. Surprisingly, a correlation analysis showed that the Victoria station was more strongly correlated with auroral index by SuperMag Lower-envelope index (SML) both before and after midnight. This can be explained by the polar convections being pushed toward the pre-midnight sector due to the strong, positive IMF-By component. In future studies, geomagnetic data from other stations can be used to investigate where the strongest potential damages under polar convections are located during solar events.
Keywords: Geomagnetic Storm, Space Weather, Magnetic Reconnection, Aurora
Introduction
Auroras are caused by coronal mass ejections from the sun towards the Earth’s magnetic field. These coronal mass ejections become the Interplanetary Magnetic Field (IMF). Storms are characterized by significant variations in the Earth’s magnetic field intensity over time. Sudden, large increases in magnetic field strength often signal strong disturbances from the IMF. Higher magnetic field intensities can enhance auroras, which are visible manifestations of geomagnetic disturbances.
Magnetic reconnection is required for auroras to occur. Earth’s magnetic field travels from south to north, so only southward IMF can cause reconnection (represented by IMF-Bz). It causes the Earth’s magnetic field lines to stretch and accumulate energy in the magnetotail (the elongated portion of the magnetosphere facing away from the Sun). The magnetic energy is released during reconnection, which causes electrons and ions to enter Earth’s magnetic field into the polar regions.
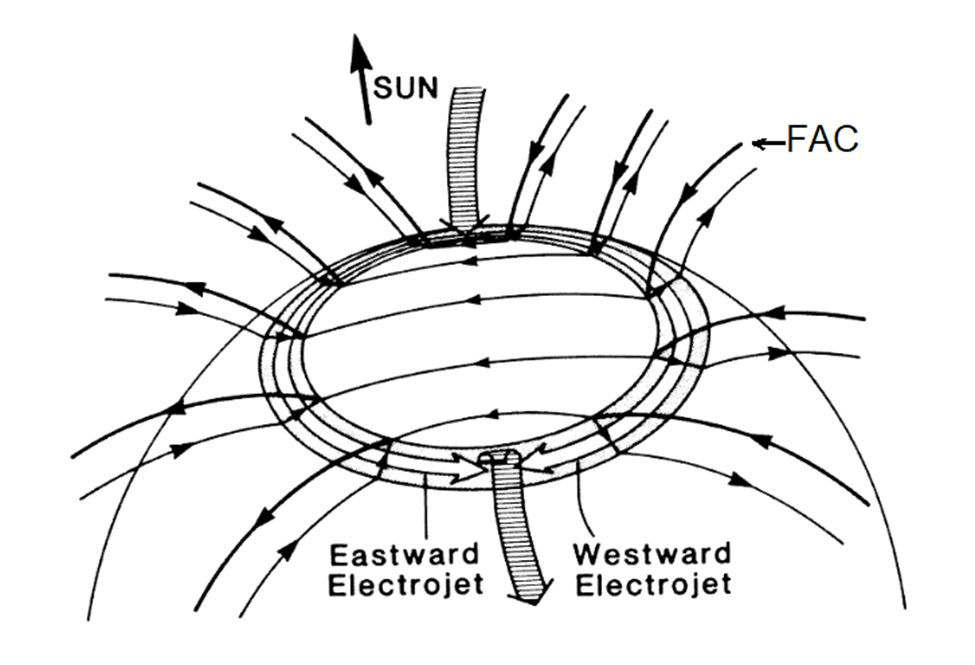
According to Figure 11, eastward electrojets flow along the pre-midnight section of the auroral oval, while westward electrojets flow along the post-midnight section. Therefore, before midnight, the magnetic field intensity of the westward electrojets—typically represented by the SuperMAG Upper-envelope index (SMU)—will approximately correlate with the stations. After midnight, the magnetic field intensity of the eastward electrojets—typically represented by the SuperMAG Lower-envelope index (SML)—will show a stronger correlation with the stations2.
Methods
Data from SuperMAG
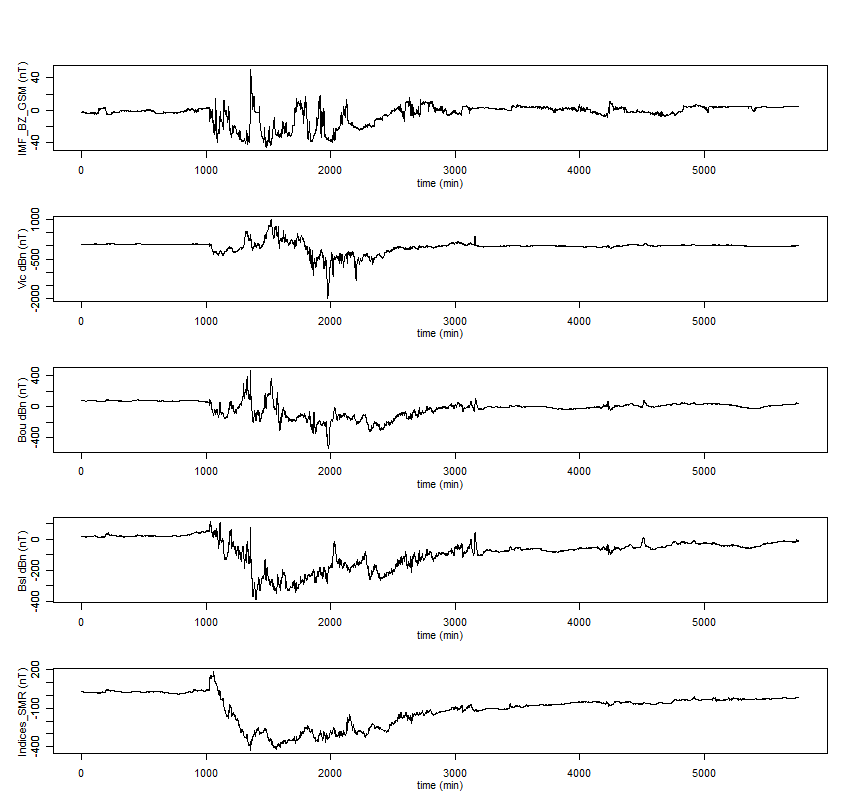
Since the Mother’s Day storm in May 2024 was the strongest solar activity that impacted the Earth in the last two decades according to NASA and the KyotoWDC3,4,5, it was chosen to show the impacts of solar activity at different locations in the US continent. According to the SuperMAG Ring current (SMR) index shown in Figure 26, there was a super storm during May 10th through 13th, 2024. The SMR is derived from approximately 100 stations. The largest disturbance of SMR occurred on May 11th, 2024, with a value below -400 nT.
As ground-based magnetometers were used in this study, the issue of magnetometer saturation is minimized. The variation of the ground-based magnetometer used in this study is around 80000 nT. The largest changes caused by the storm are around 4000-5000 nT, which won’t saturate the magnetometer. The magnetometer data used in this study was downloaded from SuperMAG7 as definite data. The accuracy is at 0.1nT. The variations we are interested in are at least around 10s of nT, and around 100nT in this storm. In addition, although changes in IMF parameters take time (~10–60 minutes) to propagate to Earth’s magnetosphere and influence geomagnetic activity, due to these IMF parameters being 1.5 million kilometers away from the Earth, lag effects are considered negligible.
In order to show this difference between different locations in the US continent, magnetic field data were downloaded from stations of VIC, BOU, and BSL from the SuperMAG website. The location information of these stations is listed in Table 1. Due to the scale of this study, we focused on three mid-latitude stations, especially covering the U.S. continental latitudes, to demonstrate latitudinal differences in geomagnetic field variations during the storm. These stations were chosen based on their geographic distribution and data availability, which allowed us to examine representative responses to ring current effects at mid-latitudes. The magnetic field data has a 1-minute time resolution, which is sufficient for this study because the temporal variations of the current systems driving these geomagnetic field changes occur on timescales longer than a few minutes. That is also why SuperMAG and the Kyoto world database provide magnetic field data and magnetic indices at 1-minute resolution.
There are three components, magnetic north (Bn), east (Be), and vertically down (Bz), defined as follows. The magnetometer data from SuperMAG use two horizontal components, which determine a slowly varying time dependent declination angle and subsequently rotate the horizontal components into a local magnetic coordinate system, where Be is minimized and Bn is maximized. This study focuses on IMF-Bz and IMF-By due to their well-established and direct roles in driving geomagnetic activity. Specifically, IMF-Bz is a critical factor in magnetic reconnection at the dayside magnetopause, while IMF-By influences the asymmetry and orientation of reconnection processes.
Btotal = Bn + Be + Bz (Eq. 1)
where
n-direction is local magnetic north,
e-direction is local magnetic east,
z-direction is vertically down.8,9
| IAGA Codes | GeoLong | GeoLat | MagLong | MagLat | Station name |
|---|---|---|---|---|---|
| BOU | 254.76 | 40.14 | -40.51 | 49.14 | Boulder |
| BSL | 270.36 | 30.35 | -19.55 | 41.47 | Bay St Louis |
| VIC | 236.58 | 48.52 | -63.97 | 53.83 | Victoria |
(Note, here AACGM coordinates are used for the magnetic longitude and latitude.)
Data of Interplanetary Magnetic Field (IMF) from NASA CDAWeb
The IMF data were used to determine the solar wind conditions, which were considered as the driver of geomagnetic storms. The IMF data were downloaded from NASA CDAWeb10. CDAWeb contains selected public non-solar heliophysics data from current and past heliophysics missions and projects. Many datasets from current missions are updated regularly (even daily), including reprocessing older time periods, and SPDF only preserves the latest version.
The specific IMF data downloaded is the “OMNI_HRO2_1MIN”, which is 1-minute averaged definitive multispacecraft interplanetary parameters data. Additional information for all parameters is available from OMNI Data Documentation11. The IMF-Bz data in GSM coordinates from May 10th to May 13th, 2024, are shown in Figure 2.
Data of SuperMAG auroral indices (SMU and SML)
Since the geomagnetic field changes during the Mother’s Day Storm are related to the auroral currents generated during the storm, the auroral indices of SuperMAG (SMU and SML) are downloaded from the SuperMAG website. The SMU index represents the maximum strength of eastward auroral electrojets, calculated as the upper envelope of the N-component for magnetometer stations located between 40° and 80° magnetic north. Conversely, the SML index reflects the maximum strength of westward auroral electrojets, determined as the lower envelope of the N-component for the same range of stations. Typically, these indices are derived from approximately 110 stations12,13. Both of them are in 1-minute time solution, the same as the magnetic field data at VIC, BOU, and BSL, and the IMF data from NASA.
Correlation analysis was mainly used to find the relationship between variables. As the sample sizes were very large (ex. there are 5761 data points in the indices graph in Figure 3), the p-values are all approximately 0. Therefore, the results are all statistically significant.
Results
Comparing the dBn of the magnetometer stations during the Mother’s Day Storm (5/10/2024 – 5/14/2024)
According to the changes in IMF-Bz shown in Figure 2, the period of disturbance seems to be from about 1000 min – 2400 min. During this period, the IMF-Bz is majorly negative (IMF-Bz < 0). When the IMF-Bz is negative, it triggers the magnetic reconnection and leads to the geomagnetic storm we can see from the ground. We can see that activity changes in IMF-Bz correspond to the changes in the geomagnetic field intensity across the three stations during the period of disturbance. In particular, we can observe that the dBn changes between Victoria (VIC) and Boulder (BOU) stations correspond (r = 0.69). On the other hand, the magnetic field intensity changes at the Bay of St. Louis (BSL) does not seem to correspond with VIC or BOU. A correlation analysis shows that the correlation between VIC and BSL during the period of disturbance is -0.20. For the BSL station, the dBn is between (-400 nT, 0 nT), which is a much smaller range than that of VIC (-2000 nT, 1000 nT) and BOU (-400 nT, 400 nT). This indicates that the geomagnetic disturbances are weaker at BSL, which is consistent with the correlation results.
However, we can see that the magnetic field intensity changes in BSL correspond quite strongly with that of Indices SMR during the period of disturbance (r = 0.78). SMR is the SuperMAG ring current index, which indicates the change of the ring current/partial ring currents during the storm. As depicted by Figure 2, both BSL and SMR have a magnetic field intensity change ranging from about (-400 nT, 100 nT), suggesting that the geomagnetic field at BSL is impacted by the ring currents shown by SMR. Rather than higher latitude current systems, such as auroral electrojets, the ring currents have stronger impacts on the geomagnetic field near mid and low latitude regions, which includes the Bay of St. Louis. The ring current, primarily composed of energetic ions and electrons trapped in Earth’s magnetosphere, flows westward around the planet’s equatorial plane at approximately 2–6 Earth radii. During geomagnetic storms, the intensity of the ring current increases as more charged particles are injected from the solar wind and magnetotail. This enhanced ring current generates a magnetic field that opposes Earth’s intrinsic magnetic field, leading to a decrease in the horizontal component of the geomagnetic field at the surface. This reduction is commonly measured as a depression in indices such as Dst and SMR. In mid- and low-latitude regions, including coastal areas like BSL, the ring current’s influence is particularly pronounced. The westward flow of the ring current produces a southward magnetic field perturbation at the Earth’s surface, which manifests as a decrease in the horizontal component of the geomagnetic field. This effect is global in nature but is most clearly observed at mid- and low-latitudes due to the geometry of the ring current and its interaction with Earth’s magnetic field.
Comparing the SuperMAG auroral electrojet indices SML and SMU to the dBn of the Victoria station
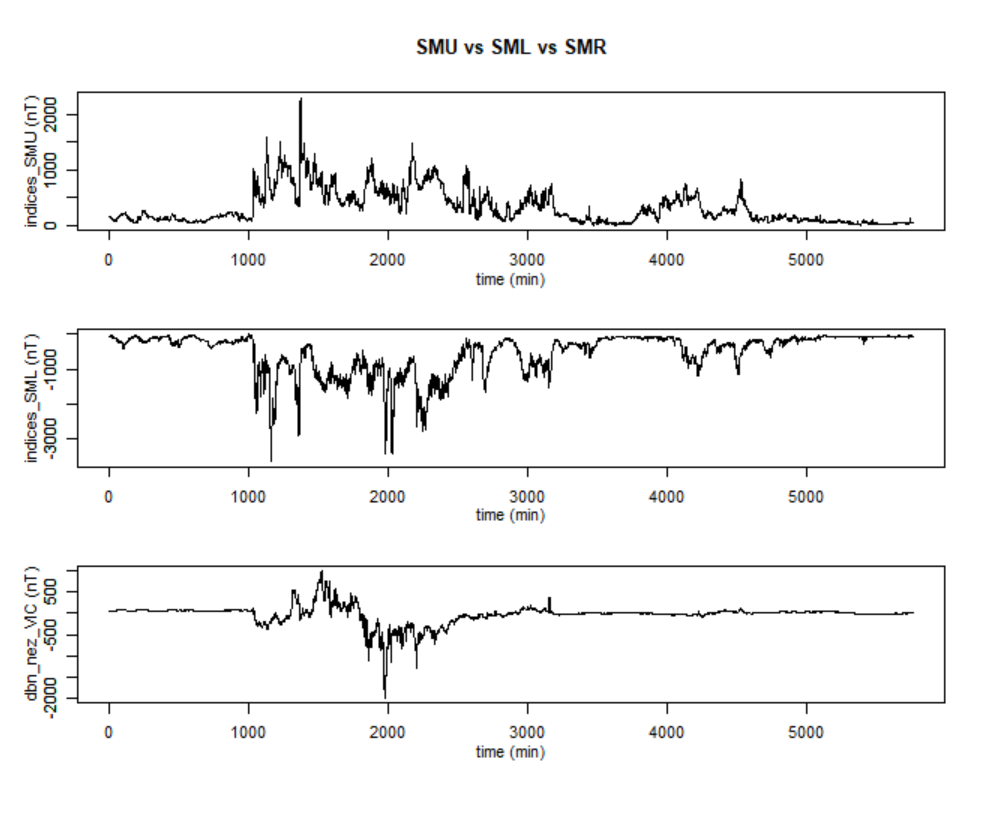
We can see that the indices of SMU are inversely correlated with the indices of SML (r = -0.526 for non-0 magnetic field intensities) shown in Figure 3. The plots also indicate that the magnetic field intensity of Victoria tends to follow SMU for the earlier part of the disturbance and SML for the later part.
This fits with our theory that SMU should correlate with VIC before midnight and that SML should correlate with VIC after midnight. In this data, midnight is represented by 1976 minutes, so the next step is to test the correlations from 1976 min. +/- 180 min.
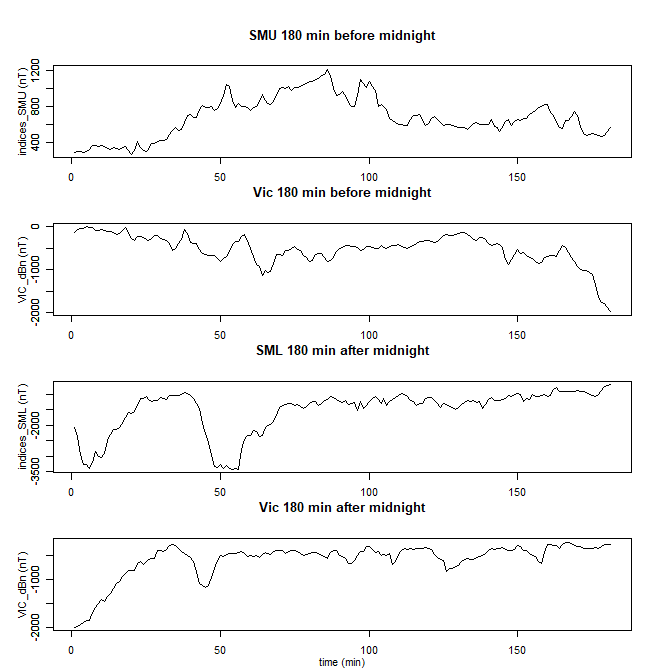
As shown in Figure 4, while the correlation between SML and dBn of VIC after midnight was 0.601, which is quite strong, the correlation between SMU and VIC before midnight was unexpectedly -0.328, which indicates that they trend in the opposite direction.
Discussion
The relatively strong association between the Victoria and Boulder stations and their weak association with the Bay of St. Louis station can be explained by their magnetic latitude locations. According to the data, the magnetic latitudes of the stations in Victoria, Boulder, and Bay of St. Louis are 53.62 degrees N, 48.52 degrees N, and 40.69 degrees N, respectively. Auroral activity is strongest near the auroral oval zone (60-70 degrees), and the Bay of St. Louis is further from the North Pole than Victoria and Boulder are. This also explains why the magnitude of the magnetic field intensity in Bay of St. Louis was smaller. Its maximum magnitude change during the storm was less than 400 nT, while it is near 2000 nT at Victoria.

To understand the correlation between SMU/SML and dBn_VIC, as shown in Section 3.2, we analyzed SuperMAG’s polar plots (Figure 5) for 10 and 11 May 2024. Large green vectors pointing westward are visible, indicating the intensity of electrojets in the Polar Regions at 08:57 UT on 11 May 2024 (right panel of Figure 5). These vectors demonstrate that polar convection is strongly influenced by the IMF-By at this time, pushing the convection pattern toward the pre-midnight sector. Consequently, the magnetic field at VIC is affected by westward auroral electrojets and correlates with the SML index.
The SuperMAG Ring current index SMR is a critical parameter for understanding the geomagnetic field at mid- and low-latitude regions, including the Bay of St. Louis, because it provides a global measure of ring current activity. For the relationship between SMR and BSL, correlation coefficients were used to quantify the strength of the relationship. However, we also discussed the underlying physical mechanisms using the Biot-Savart Law (right-hand rule) to explain how ring currents generate magnetic field changes in low-latitude regions. Specifically, the east-to-west movement of ring currents produces a southward magnetic field in low-latitude regions, and the strength of the ring currents directly influences the magnitude of these magnetic field changes. The ring current, which flows westward around Earth in the Earth’s equatorial plane during geomagnetic storms, generates a magnetic field that opposes Earth’s intrinsic magnetic field. This results in a reduction of the horizontal component of the geomagnetic field at the surface, particularly at mid- and low-latitudes. The Bay of St. Louis, being a coastal region at mid-latitudes, is directly influenced by these ring current-induced magnetic field changes.
As shown in The Auroral Model in Figure 614,15, the Auroral Oval was pushed towards VIC.
Conclusion
In conclusion, from analyzing the electromagnetic responses recorded at multiple geomagnetic stations during the “Mother’s Day Storm,” the correlation analysis revealed that the Victoria station exhibited a stronger correlation with the auroral index SML, both before and after midnight, with correlation coefficients of 0.56 before midnight and 0.60 after midnight. This phenomenon can be attributed to polar convection being displaced toward the pre-midnight sector due to the pronounced positive IMF-By component. In this study, we focused on the Mother’s Day Storm as a case study due to its intense geomagnetic activity (strongest storm since 2003 Halloween Storm) and well-defined characteristics, which provided a clear framework for analyzing SMU/SML correlations. While we have not yet tested the consistency of this transition across other storms or quieter days, we recognize that such an analysis would be valuable for understanding the broader applicability of our findings. Future research could expand this study by incorporating geomagnetic data from additional stations to explore whether similar transitions occur under different geomagnetic conditions and what factors (e.g., storm intensity, solar wind drivers, or magnetospheric configuration) might influence these patterns.
Acknowledgements
We thank the SuperMAG at APL/JHU and the magnetometer groups mentioned on SuperMAG websites for providing magnetometer data of the seven stations in North America, and NASA CDAweb for providing the IMF data.
References
- S.-I. Akasofu. Aurora. In From the Sun: Auroras, Magnetic Storms, Solar Flares, Cosmic Rays (eds S.T. Suess and B.T. Tsurutani). https://doi.org/10.1029/SP050p0001 (1998). [↩]
- P. T. Newell and J. W. Gjerloev, Local geomagnetic indices and the prediction of auroral power, J. Geophys. Res. Space Physics, 119, doi:10.1002/2014JA020524 (2014). [↩]
- NASA. NOAA: Sun Reaches Maximum Phase in 11-Year Solar Cycle. https://science.nasa.gov/science-research/heliophysics/nasa-noaa-sun-reaches-maximum-phase-in-11-year-solar-cycle/ (2024). [↩]
- KyotoWDC. OnDSTindex. https://wdc.kugi.kyoto-u.ac.jp/dstdir/dst2/onDstindex.html (2024). [↩]
- KyotoWDC. Dst_provisional. https://wdc.kugi.kyoto-u.ac.jp/dst_provisional/202405/index.html (2024). [↩]
- P. T. Newell, J. W. Gjerloev. SuperMAG-Based Partial Ring Current Indices. J. Geophys. Res., 117 (2012). [↩]
- SuperMAG. https://supermag.jhuapl.edu/ (2024). [↩]
- J. W. Gjerloev. A Global Ground-Based Magnetometer Initiative, Eos Trans. AGU, 90(27), 230– 231, (2009). [↩]
- J. W. Gjerloev. The SuperMAG data processing technique. J. Geophys. Res., 117, A09213, https://doi:10.1029/2012JA017683 (2012). [↩]
- Coordinated Data Analysis Web (CDAWeb) https://cdaweb.gsfc.nasa.gov/ (2024). [↩]
- NASA. One min and 5-min solar wind data sets at the Earth’s bow shock nose. https://omniweb.gsfc.nasa.gov/html/HROdocum.html (2024). [↩]
- P. T. Newell, J. W. Gjerloev. Evaluation of SuperMAG auroral electrojet indices as indicators of substorms and auroral power. J. Geophys. Res., 116, A12211, https://doi:10.1029/2011JA016779 (2011). [↩]
- P. T. Newell, J. W. Gjerloev. Substorm and magnetosphere characteristic scales inferred from the SuperMAG auroral electrojet indices. J. Geophys. Res., 116, A12232, https://doi:10.1029/2011JA016936 (2011). [↩]
- P. T. Newell, T. Sotirelis, and S. Wing. Diffuse, monoenergetic, and broadband aurora: The global precipitation budget, J. Geophys. Res., 114, A09207, doi:10.1029/2009JA014326 (2009). [↩]
- J. L. Machol, Green., J. C., Redmon, R. J., Viereck, R. A., Newell, P. T. Evaluation of OVATION Prime as a forecast model for visible aurorae, Space Weather, 10, 3, doi.org/10.1029/2011SW000746 (2012). [↩]


