
Abstract
Background/Objective: Under-five mortality in India varies roughly twelvefold between Kerala and Uttar Pradesh despite national policies. Five health-system factors are commonly cited (internet access, workforce, policy, community, infrastructure), but whether the dominant correlate is the same across geographic scales is untested.
Methods: A five-vector composite was analyzed against a Health Outcome Index using NFHS-5 (2019-21) data at the state (n = 36) and district (n = 707) levels, with state fixed effects isolating within-state variation. A first-difference model on 620 districts matched across NFHS-4 and NFHS-5 tested whether the within-state pattern persisted over time; a confounder-adjusted within-state model additionally controlled for sanitation, wealth, and urbanization.
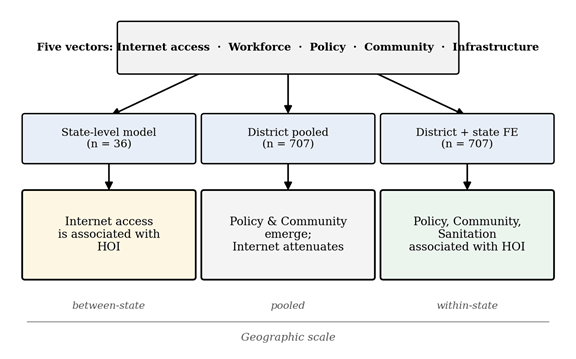
Results: The five-vector model accounts for 60% of state-level HOI variation, with Internet access the only significant predictor (beta = 0.40, p = 0.008). Under state fixed effects, Internet access loses significance and Policy (beta = 0.27) and Community (beta = 0.25) emerge as the strongest within-state correlates (both p < 0.001). The first-difference model is consistent. After adjusting for sanitation, wealth, and urbanization, Policy and Community remain significant and sanitation emerges as an additional correlate (beta = 0.21, p < 0.001).
Conclusions: The Internet-access association with Indian child health is observed between states but not within them. Findings describe associations, not causal effects. If they reflect causal pathways, between-state and within-state inequities may imply different policy domains: digital infrastructure for the former; antenatal care, female education, and sanitation for the latter.
Keywords: rural health, India, NFHS-5, composite index, multivariate regression, internet access, fixed effects, multi-scale analysis, sanitation
Introduction
A child born in Uttar Pradesh is roughly twelve times more likely to die before age five than a child born in Kerala1. India spends substantial public resources each year on programs designed to close this gap, but national averages have improved much faster than the gap between states. Full childhood vaccination rose from 62% in NFHS-4 (2015-16) to 77% in NFHS-5 (2019-21), and institutional delivery rose from 79% to 89% nationally1. These averages mask large cross-state inequality. Why some states perform much better than others on child-health outcomes, and which structural factors carry the most explanatory weight, are open empirical questions.
India has launched several large-scale initiatives intended to address rural health gaps. The National Rural Health Mission, launched in 2005 and now part of the National Health Mission, expanded primary care infrastructure, deployed Accredited Social Health Activists (ASHAs) as community health workers, and introduced conditional cash transfer programs for institutional delivery2,3. The Ayushman Bharat Pradhan Mantri Jan Arogya Yojana, launched in 2018, is one of the world’s largest public health insurance schemes4. Despite these reforms, persistent inter-state inequities suggest that the structural drivers of rural health system performance vary substantially across regions.
The World Health Organization Health Systems Building Blocks framework groups health-system performance into six elements (service delivery, health workforce, information systems, medical products, financing, and governance)5,6,7. The framework is generic by design. For Indian rural-health analysis, this paper reorganizes those elements around what NFHS-5 measures at sub-national resolution into five vectors: digital and informational access (Internet access), workforce capacity (Workforce), policy and program coverage (Policy), community-level human capital (Community), and physical health infrastructure (Infrastructure). Workforce and Policy are kept as separate vectors in the main analysis but correlate at r = 0.83 to 0.88 across scales, and a merged four-vector specification is reported as a robustness check.
Although each of the five vectors has been studied individually in relation to Indian child health outcomes8,9,10,11,12, their relative importance and whether the relationships they exhibit with outcomes are stable across geographic scales have not been jointly tested. Existing analyses are typically single-vector, single-scale, or single-outcome: state-level descriptive comparisons using NFHS published tables; individual-level logistic regressions on stunting or vaccination with a few controls; and, more recently, multilevel and spatial models across NFHS-5 districts. None runs a head-to-head test of five candidate drivers across multiple geographic scales while explicitly isolating the within-state component of variation.
Determinants associated with differences between Indian states are not necessarily the same determinants associated with differences within states. This paper tests that proposition by fitting the same five-driver regression at three specifications: state-level (n = 36), district-level pooled (n = 707), and district-level with state fixed effects (n = 707). Internet access is the dominant correlate of cross-state variation in child health, while Policy (antenatal care coverage) and Community (female literacy and schooling) dominate intra-state disparities. The within-state findings are consistent with prior work linking antenatal care2 and female education13,14,15 to child health. The novel contribution is the cross-scale decomposition itself. Figure 1 summarizes the design and the main result.
Three hypotheses guide the analysis. H1: the five vectors together account for a significant portion of HOI variation across states. H2: each vector is independently associated with HOI after adjusting for the others. An exploratory question (E1) tests whether Internet access and Infrastructure interact. The state-level interaction is reported but underpowered at n = 36.
Because the design is cross-sectional, findings are reported as associations rather than causal effects. Any policy implications later in the paper are conditional on these associations reflecting causal pathways.
Methods
Research Design
This is an observational, cross-sectional study with one two-wave panel comparison. The state-level analysis (Model A, n = 36) uses NFHS-5 National Report (FR375) published values. The district-level analysis (Models B and C, n = 707) uses NFHS-5 microdata. A two-wave first-difference model (n = 620 matched districts) compares NFHS-4 (2015-16) and NFHS-5 (2019-21) microdata. State fixed effects in Model C isolate within-state variation: the regression compares districts to other districts in the same state rather than across states. The first-difference model compares each district’s change between waves, removing time-invariant district characteristics. Standard errors in district-level models are clustered at the state level to allow for residual correlation among districts within a state.
Participants or Sample
The state-level dataset covers all 28 states and 8 union territories (n = 36) of India as defined in NFHS-51. The district-level dataset covers 707 districts; this recovers one district (Saraikela-Kharsawan, Jharkhand) that was missing from the publicly available NFHS-5 District Fact Sheets but is present in the microdata. The first-difference dataset covers 620 districts that match by name across NFHS-4 (640 districts) and NFHS-5 (707 districts); the 20 unmatched NFHS-4 districts result from post-2014 administrative reorganization (Manipur splits, the Daman-Diu / Dadra-Nagar-Haveli merger, Karnataka’s Vijayanagara split, and similar events) and were dropped rather than aggregated. The crosswalk is provided as a supplementary file.
Data Collection
Two parallel datasets were assembled. The state-level dataset uses tables published in the NFHS-5 National Report (FR375)1, aggregated to all 28 states and 8 union territories. State-level estimates are already weighted and validated by the International Institute for Population Sciences.
The district-level dataset was built directly from NFHS-5 microdata so that every indicator is computed on one consistent universe rather than mixing universes across published tables16. Nine of ten non-outcome indicators come from the NFHS-5 KR file at the mother level (most recent birth, midx = 1); men’s internet use comes from the NFHS-5 MR file (men aged 15 to 49). The two HOI components are computed at the child level. All weighted means use DHS sample weights. Net State Domestic Product per capita comes from the Reserve Bank of India Handbook of Statistics on Indian States17. Sanitation, wealth, and urbanization controls come from the NFHS-5 HR file.
Variables and Measurements
Two indicators were selected for each vector at both scales. Table 1 presents the final set with explicit microdata definitions.
| Vector | Indicator | Microdata definition | Universe |
| Internet access (T) | T1: women’s internet use | v171a > 0 (ever used) | Mothers |
| T2: men’s internet use | mv171a > 0 (ever used) | Men 15-49 | |
| Workforce (W) | W1: ANC from doctor | m2a = 1 | Mothers |
| W2: skilled birth | m3a or m3b or m3c = 1 | Mothers | |
| Policy (P) | P1: ANC 4+ visits | m14 >= 4 (m14 not 98) | Mothers |
| P2: ANC from skilled provider | m2a or m2b = 1 | Mothers | |
| Community (C) | C1: women literate | v155 = 2 OR v149 >= 3 | Mothers |
| C2: 10+ years schooling | v133 >= 10 | Mothers | |
| Infrastructure (I) | I1: facility delivery | m15 in [20, 96) | Mothers |
| I2: insurance coverage | v481 = 1 (mother’s coverage) | Mothers | |
| HOI1 | full vaccination | BCG + 3 DPT/penta + 3 polio + measles | Children alive 12-23 mo |
| HOI2 | not stunted | hw70 >= -200, hw13 = 0 | Children alive 0-59 mo |
NFHS-5 does not publish state-level or district-level counts of doctors, nurses, or hospital beds18, so personnel ratios for Workforce and facility counts for Infrastructure were not available. Service-delivery indicators were used as proxies. The assumption is that whether care is actually delivered matters more than raw provider count; this proxy choice is acknowledged as a limitation.
Policy and Workforce both include antenatal-care indicators but capture different constructs: Policy reflects coverage breadth (any skilled provider, 4 or more visits) and Workforce reflects provider quality (doctor specifically, skilled birth attendance). The two correlate at r = 0.88 at the state level and r = 0.83 at the district level, and a four-vector specification merging them is reported as a robustness check.
The Internet-access vector captures whether respondents have ever used the internet (NFHS-5 questions v171a and mv171a). It measures general internet exposure, not digital health platform use, telemedicine access, or digital health infrastructure19,20.
The HOI combines one near-term service outcome (full vaccination) with one longer-term nutritional outcome (freedom from stunting)21,22. Full vaccination is defined for children aged 12 to 23 months as receipt of BCG, three doses of DPT or pentavalent (single antigen channel, no double-counting), three polio doses (excluding OPV0), and measles, from card or mother’s recall (the NFHS administrative definition, matching FR375). Table M1 reconciles this definition against alternatives.
| Definition | NFHS-4 (rebuilt) | NFHS-5 (rebuilt) | Matches published |
| Strict DHS (card-only) | 40.4% | 51.2% | Matches DHS Statcompiler |
| NFHS administrative (card + recall, single DPT/penta channel) | 62.0% | 76.7% | Matches FR375 (62%, ~77%) |
| Definition used in this paper | 62.0% | 76.7% | NFHS administrative |
Weighted national means from the rebuild agree with published NFHS-5 values1 within 1 to 2 percentage points for every comparable indicator (Supplementary Table S5). The mother-level insurance indicator (I2 = v481) differs from the published household-level figure (24% vs 41%) because the household-level value covers all members; a sensitivity check using only I1 for Infrastructure leaves the main coefficients unchanged.
All indicators were rescaled to 0 to 100 using min-max normalization (stunting inverted), and each composite is the unweighted mean of its two indicators. Sensitivity to z-score normalization and to dropping any single indicator (Supplementary Table S4) is reported in Results.
Procedure
State-level analysis (Model A). Multiple linear regression of HOI on the five vectors, estimated in Python with statsmodels. Robustness checks: T x I interaction; Net State Domestic Product per capita as a control; outlier exclusion (Chandigarh, Puducherry). With n = 36 and five predictors, the state-level regression has roughly 7 observations per predictor (below the conventional rule of thumb of 10 to 15), so state-level coefficients are interpreted as suggestive.
District-level analysis (Models B and C). Model B uses the same regression at the district level (n = 707). Model C adds 36 state dummies (state fixed effects), so that the vector coefficients reflect within-state variation only. Standard errors in Models B and C are clustered at the state level.
Two-wave first-difference model. The same indicators were rebuilt on NFHS-4 microdata and merged with NFHS-5 at the district level via the name-based crosswalk. The model regresses the change in HOI on the change in each vector, with state fixed effects and cluster-robust standard errors at the state level. Internet access is excluded because the NFHS-5 internet-use questions have no NFHS-4 analogue. The identifying assumption is parallel trends, which cannot be tested with only two waves, so coefficients are read as within-state associations rather than causal effects. The earlier difference-in-differences label is not used here because no treatment, control group, or treatment timing is defined.
Confounder-adjusted model. Model C was re-estimated with three district-level controls from the NFHS-5 HR file: sanitation (weighted share of households with an improved toilet23,22), wealth (district-mean wealth index quintile), and urbanization (weighted share of urban households).
Drop-one-indicator robustness check. Model C was re-estimated under ten alternative specifications, each dropping one of the ten indicators and rebuilding the affected vector from the remaining indicator (Supplementary Table S4).
Sensitivity to alternative normalization. All composites and the HOI were rebuilt using z-score normalization (centered and divided by within-scale standard deviation), and Models B and C were re-estimated.
Four-vector specification. Workforce and Policy were averaged into a single Care Coverage and Quality (CCQ) composite, and Models B and C were re-estimated with four vectors.
Data Analysis
All analyses were conducted in Python with statsmodels. For each coefficient the point estimate, standard error, 95% confidence interval, and p-value are reported. Variance inflation factors quantify multicollinearity. Significance is reported as *** p < 0.001, ** p < 0.01, * p < 0.05.
Ethical Considerations
The study uses publicly available, anonymized secondary data (NFHS-5 and NFHS-4 microdata, FR375 published tables) obtained from the DHS Program under standard data-access agreement. No identifying information appears in any analysis. No primary data were collected. The DHS Program data-access approval letter is on file with the author.
Results
State-level results (Model A)
Supplementary Table S1 reports state-level descriptive statistics. State-level Internet-access scores span Chandigarh (98.7) to Bihar (0.0), and HOI spans Meghalaya (4.5) to Puducherry (85.9). Every vector is positively correlated with HOI at the state level (r = 0.41 to 0.65). Workforce and Policy correlate at r = 0.88, while Internet access and Infrastructure correlate at only r = 0.09; standard health-systems framings would predict that infrastructure and digital access reinforce each other, but that relationship is not strongly observed in this dataset.
The five-vector model fits well: R-squared = 0.60, adjusted R-squared = 0.53, F(5, 30) = 8.94, p < 0.001. Only Internet access reaches conventional significance (beta = 0.40, 95% CI [0.12, 0.68], p = 0.008). Supplementary Table S2 reports the full Model A regression output, including standard errors, t-statistics, and confidence intervals for each predictor. Workforce has a nearly identical point estimate (beta = 0.41) but does not reach significance (p = 0.11). Policy, Community, and Infrastructure all have small coefficients with wide confidence intervals. H2 (that all five vectors would be independently associated with HOI after adjustment) is therefore only partially supported.
The gap between strong bivariate correlations and weak multivariate coefficients reflects multicollinearity (VIFs: T = 2.18, W = 4.85, P = 5.18, C = 2.92, I = 1.96). Four of the five vectors function as correlated features of a common development trajectory at the state level; Internet access, with an Infrastructure correlation of only 0.09, is the exception the regression can pull out as a distinct predictor.
Adding T x I barely changed the model (R-squared unchanged, beta_TI = -0.25, p = 0.72). E1 is not supported. Dropping the two most extreme states (Chandigarh, Puducherry) left the Internet-access coefficient essentially unchanged (beta = 0.39, p = 0.030). Adding NSDP per capita as a control left Internet access as the only significant predictor (beta = 0.46, p = 0.007); NSDP itself was not significant. The state-level finding is not driven by outliers or by general state economic development.
District-level results (Models B and C)
The district-level analysis covers 707 districts across all 36 states and union territories. Supplementary Table S3 reports descriptive statistics and Supplementary Figure S1 displays the full district-level correlation matrix. The Workforce-Policy correlation drops from 0.88 to 0.83 at the district level, still high but enough to allow the regression to begin pulling them apart. The Internet-Infrastructure correlation is 0.10 at the pooled district level, lower than every other pair in the matrix.
Table 2 reports the three regression specifications side by side, and Figure 2 plots the same coefficients with 95% confidence intervals.
| Vector | Model A: State (n=36) | Model B: District pooled (n=707) | Model C: District + state FE (n=707) |
| T | 0.400 (0.008) ** | 0.131 (0.005) ** | 0.039 (0.422) |
| W | 0.407 (0.112) | 0.018 (0.854) | 0.023 (0.785) |
| P | 0.092 (0.695) | 0.310 (<0.001) *** | 0.267 (<0.001) *** |
| C | -0.073 (0.691) | 0.139 (0.011) * | 0.248 (<0.001) *** |
| I | 0.050 (0.799) | 0.065 (0.399) | 0.196 (0.072) |
| R-sq | 0.60 | 0.46 | 0.62 (within-R-sq 0.31) |
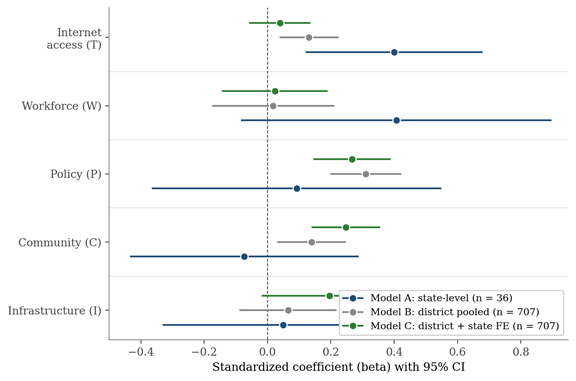
The pooled district regression reproduces the Internet-access result at roughly one-third the state-level magnitude (beta = 0.13, p = 0.005). Policy is the strongest district-level correlate (beta = 0.31, p < 0.001) and Community is significant (beta = 0.14, p = 0.011). Adding state fixed effects in Model C drops Internet access to insignificance (beta = 0.04, p = 0.42) while Policy and Community remain strong (both p < 0.001).
The state-level Internet-access signal therefore operates through state-level differences in digital investment, not through within-state variation; districts with stronger antenatal-care coverage and female education had meaningfully higher HOI scores even within the same state. The within-state findings are consistent with prior work on female education13,14,15 and antenatal care coverage2,24,25 as correlates of Indian child health.
Decoupling across scales
Table 3 reports the Internet-Infrastructure correlation at four geographic scales.
| Scale | Sample | r(T, I) |
| State level (original) | n = 36 states | 0.09 |
| Between-state (state means of district indices) | n = 36 state means | 0.14 |
| District pooled | n = 707 districts | 0.10 |
| Within-state (district deviations from state mean) | n = 707 districts | 0.30 |
Two-wave first-difference results
Across the 620 matched districts, the mean wave-on-wave change is +6.5 points for Workforce, +7.8 for Policy, +10.1 for Community, +9.7 for Infrastructure, and +2.3 for HOI. Community shows the largest absolute change, consistent with the rapid rise in female schooling and literacy documented elsewhere13.
| Variable | Coef (beta) | SE | t | p | 95% CI |
| Delta-Workforce | +0.074 | 0.075 | +0.98 | 0.334 | [-0.079, +0.227] |
| Delta-Policy | +0.245 | 0.060 | +4.09 | <0.001 *** | [+0.123, +0.367] |
| Delta-Community | +0.131 | 0.053 | +2.46 | 0.019 * | [+0.023, +0.239] |
| Delta-Infrastructure | +0.058 | 0.106 | +0.55 | 0.586 | [-0.157, +0.273] |
The first-difference results are consistent with the within-state pattern from Model C (Supplementary Figure S2). The first-difference specification strengthens consistency across waves but does not establish causal identification. To test whether the result is driven by mean reversion (districts that started lower on HOI in 2015 had more room to grow), the model was re-estimated adding the NFHS-4 baseline HOI as a control. Baseline HOI coefficient is -0.58 (p < 0.001), consistent with substantial mean reversion. After this adjustment, Policy attenuates to beta = 0.12 (p = 0.080) and Community holds at beta = 0.11 (p = 0.048). The Community coefficient is robust to mean-reversion control; the Policy coefficient is partially explained by it.
Confounder-adjusted model: sanitation, wealth, and urbanization
Model C was re-estimated with three additional district-level controls from the NFHS-5 HR file. Table 5 reports the results.
| Vector / control | Coef (beta) | SE | p |
| Internet access | +0.030 | 0.037 | 0.417 |
| Workforce | -0.029 | 0.069 | 0.681 |
| Policy | +0.260 | 0.063 | <0.001 *** |
| Community | +0.189 | 0.051 | <0.001 *** |
| Infrastructure | +0.164 | 0.101 | 0.106 |
| Sanitation | +0.206 | 0.053 | <0.001 *** |
| Urbanization | -0.165 | 0.053 | 0.002 ** |
| Mean wealth | +3.637 | 2.780 | 0.191 |
Several observations follow. The within-state Policy and Community associations survive the addition of these controls. Sanitation emerges as an additional strong within-state correlate (beta = 0.21, p < 0.001), comparable in magnitude to Policy and Community, consistent with the recent literature on the Swachh Bharat Mission23,22. Urbanization, by contrast, carries a negative within-state coefficient (beta = -0.17, p = 0.002); within a state, holding the other vectors and sanitation constant, more urban districts have lower HOI, plausibly capturing urban poverty pockets and slum populations.
Drop-one-indicator and normalization robustness
The drop-one-indicator robustness check (Supplementary Table S4) shows the headline pattern holds across all ten alternative specifications. Internet access stays insignificant within-state in all ten (beta range 0.014 to 0.060). Policy stays significant at p < 0.001 in nine of ten (beta range 0.168 to 0.306). Community stays significant at p < 0.001 in all ten (beta range 0.210 to 0.265). Within-R-squared stays in the band 0.295 to 0.313.
Under z-score normalization, Model C produces beta_T = 0.05 (p = 0.39), beta_W = 0.01 (p = 0.93), beta_P = 0.26 (p < 0.001), beta_C = 0.29 (p < 0.001), beta_I = 0.21 (p = 0.07). The headline is preserved.
The four-vector specification (merged CCQ) produces beta_T = 0.03 (p = 0.51), beta_CCQ = 0.35 (p < 0.001), beta_C = 0.23 (p < 0.001), beta_I = 0.18 (p = 0.10) in Model C. The merged CCQ coefficient is highly significant; T remains insignificant within-state.
Simulation
At the state level, a 10-point gain in Internet access predicts a 4-point HOI gain. The combined scenario with all five vectors up by 10 points predicts +8.8 HOI points, roughly the gap between Uttar Pradesh and the median state. At the district level (pooled), a 10-point gain in Policy predicts +3.1 HOI points, the largest single-vector simulated gain. Simulations describe cross-sectional regression associations, not causal predictions.
With n = 707 at the district level, small coefficients can reach statistical significance without implying large real-world effects. The largest single-vector simulated gain (Policy, +3.1 HOI points per 10-point increase) is approximately one-fifth of the within-state interquartile range of HOI, which is meaningful but not large in absolute terms.
Discussion
Restatement of Key Findings
Internet access correlates with why some states are healthier than others, but not with district-level differences within states. The state-level Internet-access coefficient of 0.40 (p = 0.008) collapses to 0.04 (p = 0.42) once state fixed effects absorb between-state variation, and the Internet-Infrastructure decoupling that underlies this split persists across all four geographic scales tested (r = 0.09, 0.14, 0.10, 0.30). Within-state district variation in HOI is most strongly associated with Policy (ANC coverage breadth), Community (female literacy and schooling), and sanitation (improved toilet coverage).
Implications and Significance
The Indian rural-health literature has emphasized female education13,14,15 and antenatal care policy2,24,25 as correlates of child health for decades. The contribution of the present analysis is not these findings themselves but the observation that they account for the within-state component of district-level variation while Internet access accounts for the between-state component. A plausible mechanism for the scale split is that internet access in India diffused through a near-simultaneous national telecom rollout (Reliance Jio’s 2016 entry, the post-2017 collapse in data prices, BharatNet) whose footprint varies sharply across states but is comparatively uniform across districts within any given state, leaving little within-state variation in internet access for the regression to exploit.
The sanitation finding adds to a more recent literature. Chakrabarti and colleagues23, using a quasi-experimental design around the Swachh Bharat Mission, found that every 10-percentage-point increase in district-level toilet access following the program corresponded with reductions of 0.9 in infant mortality and 1.1 in under-five mortality per 1,000 live births. Singh and colleagues22 found nonlinear associations between district toilet coverage and child stunting. The within-state association of sanitation with HOI in the present analysis (beta = 0.21, p < 0.001) parallels this evidence. Sanitation appears to capture an additional dimension of within-state inequality not fully covered by Policy and Community, and including it strengthens rather than weakens the within-state story.
The split has concrete planner-level implications. The state-level association says that if Bihar were to climb toward Kerala on digital access, its average HOI would be higher; it does not say what Gaya can do to close the gap with Patna. Holding Bihar’s overall context fixed, the districts inside Bihar that post higher HOI are the ones with broader ANC coverage, higher female literacy, and better sanitation. A planner with a fixed within-state budget would, on these associations, expect larger gains from expanding antenatal care, female schooling, and household toilets than from a district-level digital pilot. Central and state planners reading the same NFHS-5 data can arrive at different conclusions about which lever to pull, and the multi-scale analysis here suggests that both readings can be supported simultaneously.
Connection to Objectives
H1 (the five vectors together account for a significant portion of HOI variation) is supported at every scale. H2 (each vector is independently associated with HOI after adjustment) is only partially supported: at the state level only Internet access is independently associated; in Model C, Policy and Community are. E1 (Internet access and Infrastructure interact) is not supported in this dataset, though the n = 36 state-level analysis is underpowered to detect a modest interaction. The novel finding is the scale-decomposition itself: which vector dominates depends on the geographic unit being compared.
Recommendations
Two extensions follow directly from the design. A staggered-adoption design exploiting the timing of Digital India, BharatNet, or the 2016 Jio launch across Indian states would allow the cross-sectional Internet-access association to be tested for a causal interpretation. A richer panel comparison using NFHS-3 (2005-06) in addition to NFHS-4 and NFHS-5 would also provide pre-period variation that could anchor a more credible event-study around the post-2014 expansion of ASHAs3, Janani Suraksha Yojana2, and Swachh Bharat Mission23,22.
Several further directions matter for translation. Direct measures of provider and facility capacity from Rural Health Statistics18 and the Health Management Information System would replace the service-delivery proxies used here. A planner-facing version of the within-state result would translate the 0 to 100 HOI gain into mortality and DALY units. Where the within-state associations approximate causal pathways, a within-state strategy in lagging states would prioritize three things: expanding ANC 4+ visit coverage where it remains below 60%; expanding female schooling and adult literacy programs targeted at districts in the bottom quartile of their state’s Community distribution; and accelerating improved-toilet coverage in districts below the within-state Sanitation median. Each corresponds to a program with existing administrative machinery (Reproductive and Child Health Programme; Samagra Shiksha Abhiyan; Swachh Bharat Mission).
Limitations
The data are cross-sectional, so the analysis cannot fully separate association from causation. State fixed effects in Model C, NSDP controls, and the confounder-adjusted model in Table 5 address the most obvious sources of confounding, but the design cannot settle direction or mechanism. The coefficients describe geographic associations at the district and state level and should not be interpreted as individual-level effects. The two-wave first-difference model has only two time points, so parallel trends cannot be tested; the mean-reversion check attenuates Policy but leaves Community intact.
The state-level sample (n = 36, roughly 7 observations per predictor) is below the conventional rule of thumb, so state-level coefficients are imprecise and the district analysis (n = 707) is the main source of statistical power. The five-vector grouping is the author’s synthesis, not a citable named framework; the four-vector specification reported in Results provides one reasonable alternative. The proxies for Workforce and Infrastructure are service-delivery indicators rather than direct provider or facility counts18. The Internet-access vector captures general internet exposure, not digital health platform use19,20; longitudinal change in internet access cannot be evaluated because v171a and mv171a were introduced only in NFHS-5.
Survey-derived variables are subject to recall error; the analysis does not adjust for measurement error directly. The mother-level insurance indicator (I2) differs from the published household-level figure because the latter covers all members; sensitivity using only I1 (facility delivery) leaves the main coefficients unchanged.
Closing Thought
The results suggest that child-health inequality in India may operate differently across geographic scales. Factors associated with differences between states are not necessarily the same factors associated with differences within states. If these associations reflect causal pathways, reducing national disparities may require a different strategy than reducing disparities inside individual states.
Acknowledgments
The author thanks the International Institute for Population Sciences (IIPS) and the DHS Program for providing access to NFHS-4 and NFHS-5 microdata. The author also acknowledges her mentor Mr. Nishank Chaudhary (Karamveer Chakra Award Recipient) for helpful feedback that improved the clarity of the manuscript. All research design, analysis, and writing remain the author’s independent work.
All aspects of the study including conceptualization, research questions, methodology, statistical analysis, and conclusions were developed by the author. The manuscript text was written entirely by the author without the use of generative AI for writing or editing.
Generative AI tools were used only as computational aids to assist with debugging Python code during data processing and regression analysis. All outputs were independently reviewed, validated against NFHS reference values, and verified for accuracy. The author assumes full responsibility for the integrity and originality of the work.
Supplementary Material
References
- International Institute for Population Sciences (IIPS), ICF. National family health survey (NFHS-5), 2019-21: India. IIPS. Mumbai, 2021. [↩] [↩] [↩] [↩] [↩] [↩]
- S. S. Lim, L. Dandona, J. A. Hoisington, S. L. James, M. C. Hogan, E. Gakidou. India’s Janani Suraksha Yojana, a conditional cash transfer programme to increase births in health facilities: an impact evaluation. The Lancet. Vol. 375, pg. 2009-2023, 2010, https://doi.org/10.1016/S0140-6736(10)60744-1. [↩] [↩] [↩] [↩] [↩]
- S. Bhaumik, S. Moola, J. Tyagi, D. Nambiar, M. Kakoti. Community health workers for pandemic response: a rapid evidence synthesis. BMJ Global Health. Vol. 6, pg. e002769, 2021, https://doi.org/10.1136/bmjgh-2020-002769. [↩] [↩]
- B. J. Angell, S. Prinja, A. Gupt, V. Jha, S. Jan. The Ayushman Bharat Pradhan Mantri Jan Arogya Yojana and the path to universal health coverage in India: overcoming the challenges of stewardship and governance. PLoS Medicine. Vol. 16, pg. e1002759, 2019, https://doi.org/10.1371/journal.pmed.1002759. [↩]
- World Health Organization. Everybody’s business: strengthening health systems to improve health outcomes: WHO’s framework for action. WHO. Geneva, 2007. [↩]
- World Health Organization. Monitoring the building blocks of health systems: a handbook of indicators and their measurement strategies. WHO. Geneva, 2010. [↩]
- World Health Organization. Operational framework for primary health care: transforming vision into action. WHO. Geneva, 2020. [↩]
- S. Mukherjee, S. Pal, T. Maiti. Understanding the change in the prevalence and factors influencing the childhood stunting using district-level data from NFHS-4 and NFHS-5 in India. INQUIRY: The Journal of Health Care Organization, Provision, and Financing. Vol. 59, pg. 1-14, 2022, https://doi.org/10.1177/00469580221127122. [↩]
- Y. J. Eom, S. V. Subramanian, R. Kim. Geographic variation in women’s empowerment: a multilevel analysis of India’s National Family Health Survey 2021. Journal of Global Health. Vol. 15, pg. 04159, 2025, https://doi.org/10.7189/jogh.15.04159. [↩]
- S. Rajpal, A. Kumar, M. J. Rana, R. Kim, S. V. Subramanian. Small area variation in severe, moderate, and mild anemia among women and children: a multilevel analysis of 707 districts in India. Frontiers in Public Health. Vol. 10, pg. 945970, 2022, https://doi.org/10.3389/fpubh.2022.945970. [↩]
- P. V, V. Hemalatha, N. Arlappa, M. B. Thomas, A. Jaleel. Trends and predictors of severe and moderate anaemia among children aged 6 to 59 months in India: an analysis of three rounds of National Family Health Survey data. BMC Public Health. Vol. 24, pg. 2824, 2024, https://doi.org/10.1186/s12889-024-20328-9. [↩]
- R. Kumar, A. Patra. What determines the district-level disparities in immunization coverage in India: findings from five rounds of the National Family Health Survey. Vaccines. Vol. 11, pg. 894, 2023, https://doi.org/10.3390/vaccines11040894. [↩]
- B. Singh, S. K. Singh. The evolving nexus of women’s empowerment and child nutrition in India. Frontiers in Public Health. Vol. 13, pg. 1583678, 2025, https://doi.org/10.3389/fpubh.2025.1583678. [↩] [↩] [↩] [↩]
- J. C. Caldwell. Education as a factor in mortality decline: an examination of Nigerian data. Population Studies. Vol. 33, pg. 395-413, 1979, https://doi.org/10.2307/2173888. [↩] [↩] [↩]
- J. Dreze, M. Murthi. Fertility, education, and development: evidence from India. Population and Development Review. Vol. 27, pg. 33-63, 2001, https://doi.org/10.1111/j.1728-4457.2001.00033.x. [↩] [↩] [↩]
- International Institute for Population Sciences (IIPS), ICF. NFHS-5 district fact sheets, 2019-21. IIPS. Mumbai, 2022. [↩]
- Reserve Bank of India. Handbook of statistics on Indian states 2021-22. RBI. Mumbai, 2022. [↩]
- Ministry of Health and Family Welfare, Government of India. Rural health statistics 2020-21. Statistics Division, MoHFW. New Delhi, 2021. [↩] [↩] [↩]
- K. Singh, M. R. Walters. Use of mHealth in promoting maternal and child health in BIMARU states of India: a health system strengthening strategy: systematic literature review. PLOS Digital Health. Vol. 3, pg. e0000403, 2024, https://doi.org/10.1371/journal.pdig.0000403. [↩] [↩]
- S. Agarwal, A. E. Lefevre, J. Lee, K. L’Engle, G. Mehl, C. Sinha. Guidelines for reporting of health interventions using mobile phones: mobile health (mHealth) evidence reporting and assessment (mERA) checklist. BMJ. Vol. 352, pg. i1174, 2016, https://doi.org/10.1136/bmj.i1174. [↩] [↩]
- A. Pandey, S. James, A. Pal. Examining the prevalence and patterns of malnutrition among children aged 0 to 3 in India: comparative insights from NFHS-1 to NFHS-5. Clinical Epidemiology and Global Health. Vol. 25, pg. 101458, 2024, https://doi.org/10.1016/j.cegh.2023.101458. [↩]
- P. Singh, D. Spears, A. Coffey, R. Geruso, S. Vyas. Child undernutrition following the introduction of a large-scale toilet construction campaign in India. Journal of Nutrition. Vol. 151, pg. 2455-2464, 2021, https://doi.org/10.1093/jn/nxab142. [↩] [↩] [↩] [↩] [↩]
- S. Chakrabarti, T. A. Bruckner, J. Strominger, P. Singh. Toilet construction under the Swachh Bharat Mission and infant mortality in India. Scientific Reports. Vol. 14, pg. 20340, 2024, https://doi.org/10.1038/s41598-024-71268-8. [↩] [↩] [↩] [↩]
- P. K. Singh, R. Rai, M. Alagarajan, L. Singh. Determinants of maternity care services utilization among married adolescents in rural India. PLOS ONE. Vol. 9, pg. e106110, 2014, https://doi.org/10.1371/journal.pone.0106110. [↩] [↩]
- P. K. Singh, L. Singh. Examining inter-generational differences in maternal health-care service utilization: insights from the Indian Demographic and Health Survey. Journal of Biosocial Science. Vol. 46, pg. 366-385, 2014, https://doi.org/10.1017/S0021932013000369. [↩] [↩]


