Abstract
Urban flooding is one of the most damaging and costly natural hazards affecting American cities, causing property damage, infrastructure failure, road closures, and loss of life. Existing flood maps are typically based on rare, large flood events and may not capture the recurring, street-level flooding that affects residents during moderate storms. This study developed a multi-source system to identify recurring urban flood hotspots by integrating Sentinel-1 synthetic aperture radar (SAR) satellite imagery with NOAA Storm Events Database records and USGS stream gauge data. The algorithm, implemented in Google Earth Engine, detects surface flooding by comparing pre- and post-storm SAR backscatter, applies hybrid dual-polarization thresholds, and filters detections using urban land cover and permanent water masks. Flood detections from multiple events are aggregated into frequency-based hotspot maps that highlight locations where flooding consistently recurs. The system was applied to Houston, Texas and Raleigh, North Carolina using NOAA-documented flood events from 2015 to 2025, building recurring-flood maps from events with Sentinel-1 coverage and validating against independent flood locations from events held out of the maps. Buffered detection recall against these independent locations reached 89% (Raleigh) and 61% (Houston) within 500 meters, and 100% and 89% within 1,000 meters, exceeding a random-location baseline at most distances. Flood hotspots in Houston concentrated near Buffalo Bayou, while Raleigh hotspots clustered along Crabtree Creek, consistent with known flood history. These results demonstrate that open-access satellite radar can help identify recurring urban flood locations, providing a practical, low-cost tool for municipal planning, stormwater infrastructure prioritization, and emergency management.
Keywords: urban flood mapping, synthetic aperture radar (SAR), Sentinel-1, flood hotspots, backscatter change detection, Google Earth Engine, Houston, Raleigh, remote sensing, flood risk assessment, urban hydrology, stormwater management
Introduction
Urban flooding is one of the most dangerous and costly natural hazards affecting American cities1. Heavy precipitation events overwhelm drainage infrastructure, inundate streets and buildings, cause road closures, and claim lives. Across most of the United States, the amount of precipitation falling in the heaviest 1% of daily events has increased since the mid-twentieth century, by as much as 55% in the Northeast2, while urban areas keep expanding impervious surfaces that reduce infiltration and speed runoff. These trends are expected to worsen urban flood risk.
Despite this risk, the tools most commonly used to identify flood-prone areas have significant limitations. Federal Emergency Management Agency (FEMA) flood insurance rate maps are based on statistical return periods and hydrologic models calibrated primarily to large, rare flood events. They are updated infrequently and do not necessarily capture the recurring, street-level flooding that affects residents during moderate storms3. Hydrologic models require detailed input data that is often unavailable or outdated. As a result, planners and emergency managers often lack a clear, data-driven picture of where flooding keeps happening.
Satellite synthetic aperture radar (SAR) offers an accessible alternative. SAR measures microwave backscatter and is highly sensitive to open water: when a surface floods, backscatter drops sharply because smooth water reflects radar energy away from the sensor4,5. This is detected by comparing SAR images before and after a storm. Critically, SAR sees through cloud cover, making it well suited to monitoring floods during and just after heavy rainfall, when optical imagery is unavailable6,7.
The European Space Agency’s (ESA) Sentinel-1 satellite constellation8 has made high-resolution SAR data freely available at 10-meter resolution since 2014, with a revisit interval of 6 to 12 days. This archive now spans over a decade, making it possible to study how flooding recurs across many storms in a single city. Google Earth Engine (GEE)9, a cloud-based geospatial computing platform, enables large-scale processing of this archive without requiring specialized local infrastructure.
Prior research has shown that Sentinel-1 SAR can detect individual large-scale flood events in urban areas4,10,5,6,7. Tellman et al.11 found that satellite observations reveal far more people exposed to flooding than models predict. However, most SAR studies map single events rather than where flooding recurs. Recurring hotspots matter more for long-term planning, since they pose the greatest ongoing risk.
This study fills that gap with a system combining Sentinel-1 SAR imagery, NOAA Storm Events records, and USGS stream gauge data to map recurring urban flood hotspots, applied to Houston, Texas and Raleigh, North Carolina — two cities with very different climates and flood histories.
Methods
The premise is that a location flooding repeatedly across independent storms is far more likely a persistent problem than one seen in a single observation. Flood extent was mapped for each event using Sentinel-1 change detection, then aggregated across events to reveal recurring inundation. NOAA records were used to select documented flood events, and USGS gauge data are reported as contextual metadata for each event. All processing was implemented in Google Earth Engine (GEE)9, and Figure 1 provides an overview of the complete processing pipeline.

Study Sites and Study Period
The study was conducted in two cities: Houston, Texas (Harris County) and Raleigh, North Carolina (Wake County). Houston, on the Gulf Coastal Plain, has low relief, low-permeability clay soils, and high flood vulnerability; the Buffalo Bayou corridor has a well-documented history of severe flooding, driven largely by Gulf moisture and tropical systems. Raleigh, in the Piedmont, floods recurrently along Crabtree Creek and its tributaries during intense storms, including Piedmont thunderstorms and remnants of Atlantic hurricanes. The study period spanned January 2015 through December 2025, consistent with the start of routine Sentinel-1 acquisitions.
Data Sources
Sentinel-1 SAR imagery (10-meter resolution, VV and VH polarizations) provided the primary flood-detection data. Sentinel-2 optical imagery12 and Landsat 8 imagery13 were accessed for visual comparison where cloud-free imagery was available, but were not used in the primary detection algorithm due to limited availability during storm events.
The NOAA Storm Events Database14 provided historical records of flood events at the county level, including event dates, narrative descriptions, and documented impacts for Wake County (Raleigh) and Harris County (Houston) from 2015 to 2025. USGS stream gauge stage from Crabtree Creek at Interstate 40 (Raleigh) and Buffalo Bayou at Piney Point (Houston) is reported as contextual metadata for each event and was not used as an inclusion criterion.
Three land cover and surface water datasets were used for spatial filtering: the ESA WorldCover 2021 dataset, which classifies global land cover at 10-meter resolution; the USGS National Land Cover Database (NLCD) 2021, which provides impervious surface fraction estimates; and the JRC Global Surface Water dataset15, which provides water occurrence statistics derived from over 30 years of Landsat imagery.
Event Selection and Validation
Flood events were extracted from the NOAA Storm Events Database for Wake County (Raleigh) and Harris County (Houston) over the 2015–2025 study period, consistent with Sentinel-1 availability. Events were retained if they had documented geographic coordinates within the city (49 for Raleigh, 55 for Houston; Table S1). USGS stream gauge height (Crabtree Creek for Raleigh, Buffalo Bayou for Houston) was recorded for each event as metadata but was not used as an inclusion criterion.
To assess detection performance independently of map construction, the NOAA flood locations for each city were divided into two groups. Locations from events with usable Sentinel-1 image pairs were used to build the recurring-flood map, while locations from events that lacked Sentinel-1 coverage were held out as an independent validation set that never contributed to the map. The full set of NOAA locations is denoted N, the mapped subset M, and the held-out validation set N − M (Table S1). Raleigh and Houston were processed separately, so detection thresholds tuned for one city were never used to validate the other.
Events sharing the same satellite pass were merged into single composites, producing 5 mapped flood composites for Raleigh and 10 for Houston, plus one Houston non-flood control date (Section 3.1).
Satellite Image Matching
For each event, Sentinel-1 images were searched within a pre-event window of up to 30 days before onset and a post-event window of up to 2 days after the event ended. To keep viewing geometry consistent, images were matched by pass direction and relative orbit, pairing the earliest post-event image with the closest matching pre-event image.
Preprocessing and Speckle Filtering
SAR imagery contains speckle, a grainy noise that can cause false detections. To reduce it, focal-mean smoothing with a 90-meter window was applied to both pre- and post-event images before change detection.
Flood Detection Thresholds
Change detection was performed by computing the difference between the post-event and pre-event backscatter images. Negative values indicate decreased backscatter, consistent with surface flooding. A hybrid dual-polarization threshold approach was applied: when both VV and VH polarization bands were available, a location was classified as flooded only if both channels independently showed a backscatter decrease exceeding 1.8 dB. When only VV polarization was available, a stricter threshold of -2.0 dB was applied. These thresholds were fixed on a training subset of mapped events in each city (the threshold-training composites are flagged in Table S1) and locked before map construction and validation; adaptive per-scene thresholds were disabled, and the cities were tuned separately.
Spatial Filtering and Masking
An urban mask was created by combining two datasets: built-up areas identified in the ESA WorldCover 2021 dataset16 and areas with impervious surface fraction exceeding 20% in the USGS NLCD 2021 dataset. Only detections within this urban mask were retained, focusing the analysis on urban rather than natural floodplain flooding.
Permanent water bodies were excluded using the JRC Global Surface Water dataset (water occurrence above 50%), preventing false detections over standing water.
Connected-component analysis removed isolated noise: clusters of fewer than 5 contiguous flood cells were discarded, keeping only spatially coherent detections.
Hotspot Mapping and Visualization
Detections from each event were aggregated into a flood-frequency map for each city, where each location’s value is the number of events in which flooding was detected there. Frequency values were classified into three hotspot categories: low (detected in 1 event, shown in yellow), moderate (detected in 2–3 events, shown in orange), and high (detected in 4 or more events, shown in red). Hotspot maps were visualized as a semi-transparent overlay on a base map in Google Earth Engine.
Validation
Detection performance was measured as buffered detection recall: the fraction of independent NOAA flood locations (the held-out N − M set) with at least one detected flood pixel within a given buffer distance. Recall was computed at 100, 250, 500, and 1,000 meters, on 36 independent locations for Raleigh and 28 for Houston. Recall was scored against a pre-urban ever-flooded union (the same detection thresholds and speckle filtering, but without restricting to the urban mask), so the urban mask did not hide valid flood pixels near NOAA report locations. We do not report precision or IoU because NOAA gives point locations, not full flood outlines. A SAR detection away from a NOAA report is not necessarily wrong—many floods are never reported. A proper false-positive test would need independent flood maps (e.g., aerial imagery or road closures), which we did not have for these cities. For context, the same metric was applied to 500 random locations per city (uniform within each study area, seed 42), and independent locations were also compared with FEMA National Flood Hazard Layer Special Flood Hazard Areas.
Results
Event Selection
From NOAA-documented flood events with geographic coordinates in 2015–2025 (49 for Raleigh, 55 for Houston; Table S1), those with usable Sentinel-1 image pairs were used to build the recurring-flood maps (5 SAR composites for Raleigh, 10 for Houston). Flood locations from events without Sentinel-1 coverage formed the independent validation sets (36 for Raleigh, 28 for Houston). One Houston Sentinel-1 pair on a non-flood date (composite control_2024-10-15; pre-event image 2024-10-03, post-event image 2024-10-15; Buffalo Bayou gauge 27.87 ft, below the 40 ft informational stage; no NOAA flood report; Table S1) was processed as a control and excluded from the maps. It was used for qualitative inspection only; a single control date does not support a quantitative false-positive rate, which is noted as a limitation.
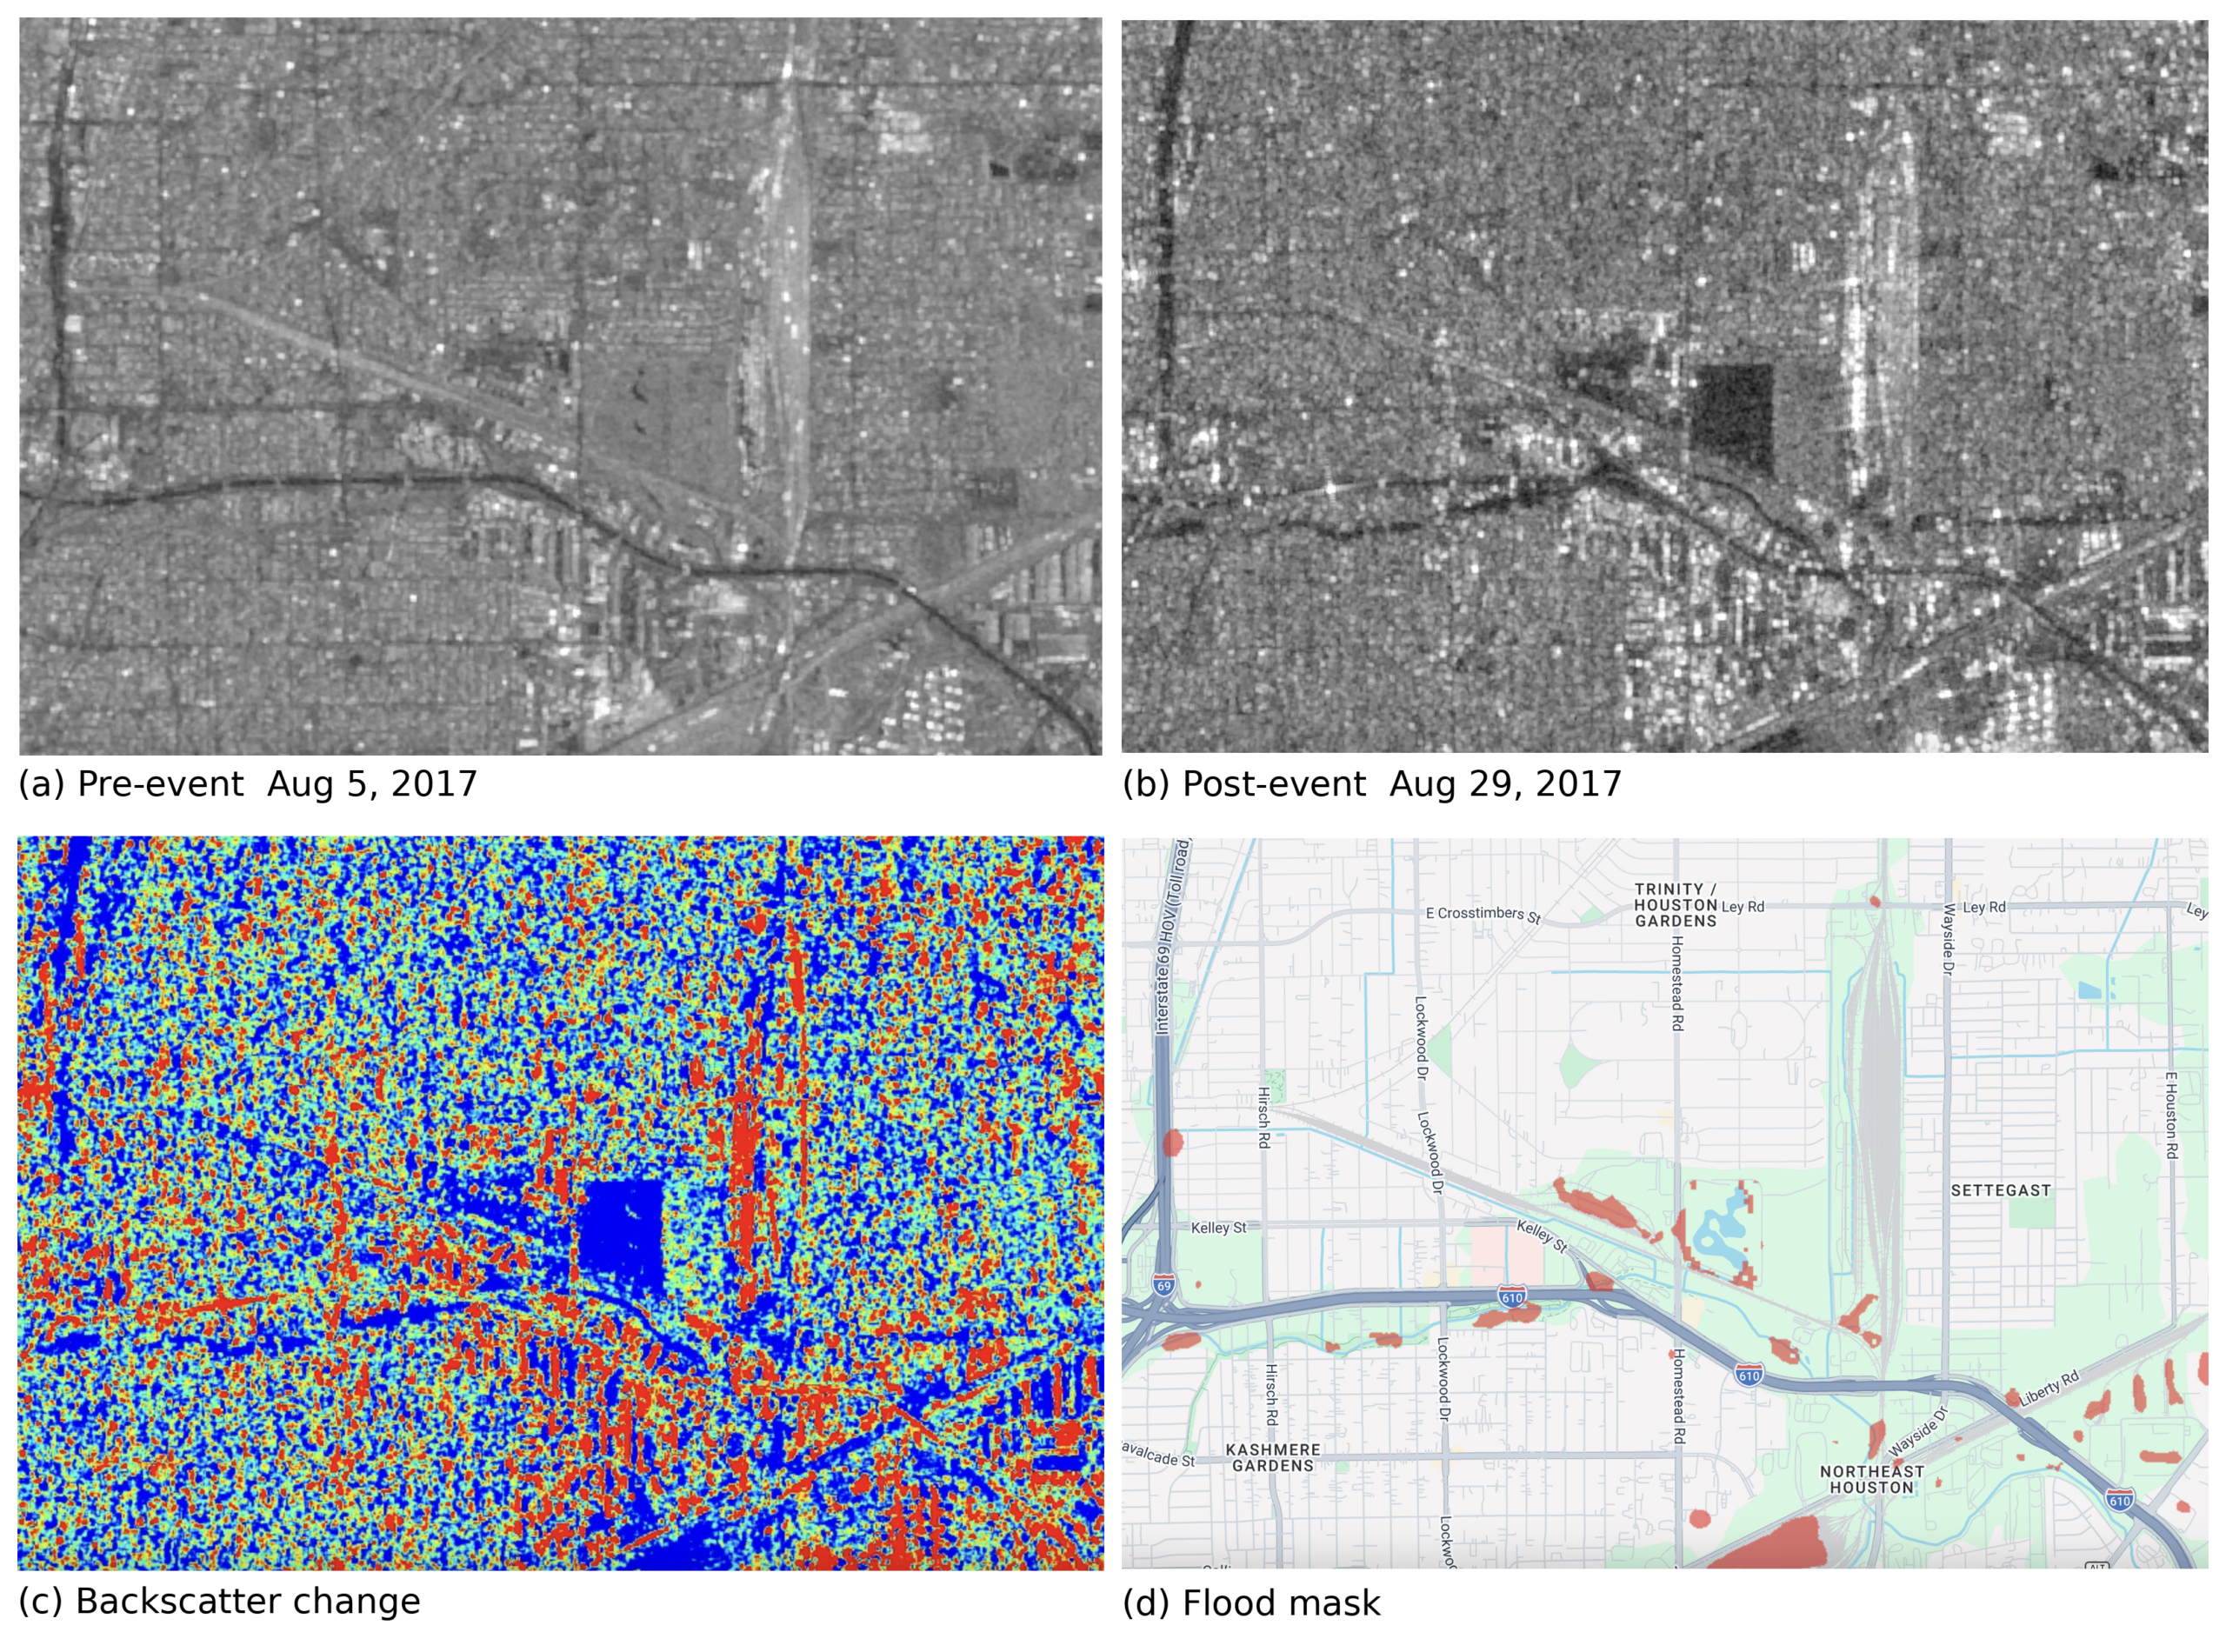
Figure 2 illustrates the satellite image matching and flood detection pipeline for a representative event in Houston (August 2017). The pre-event image (August 5, 2017) shows dry-surface backscatter conditions, while the post-event image (August 29, 2017) shows sharply reduced backscatter in flooded areas. The resulting flood mask captures the spatial extent of surface inundation detected by the algorithm.
Flood Hotspot Maps
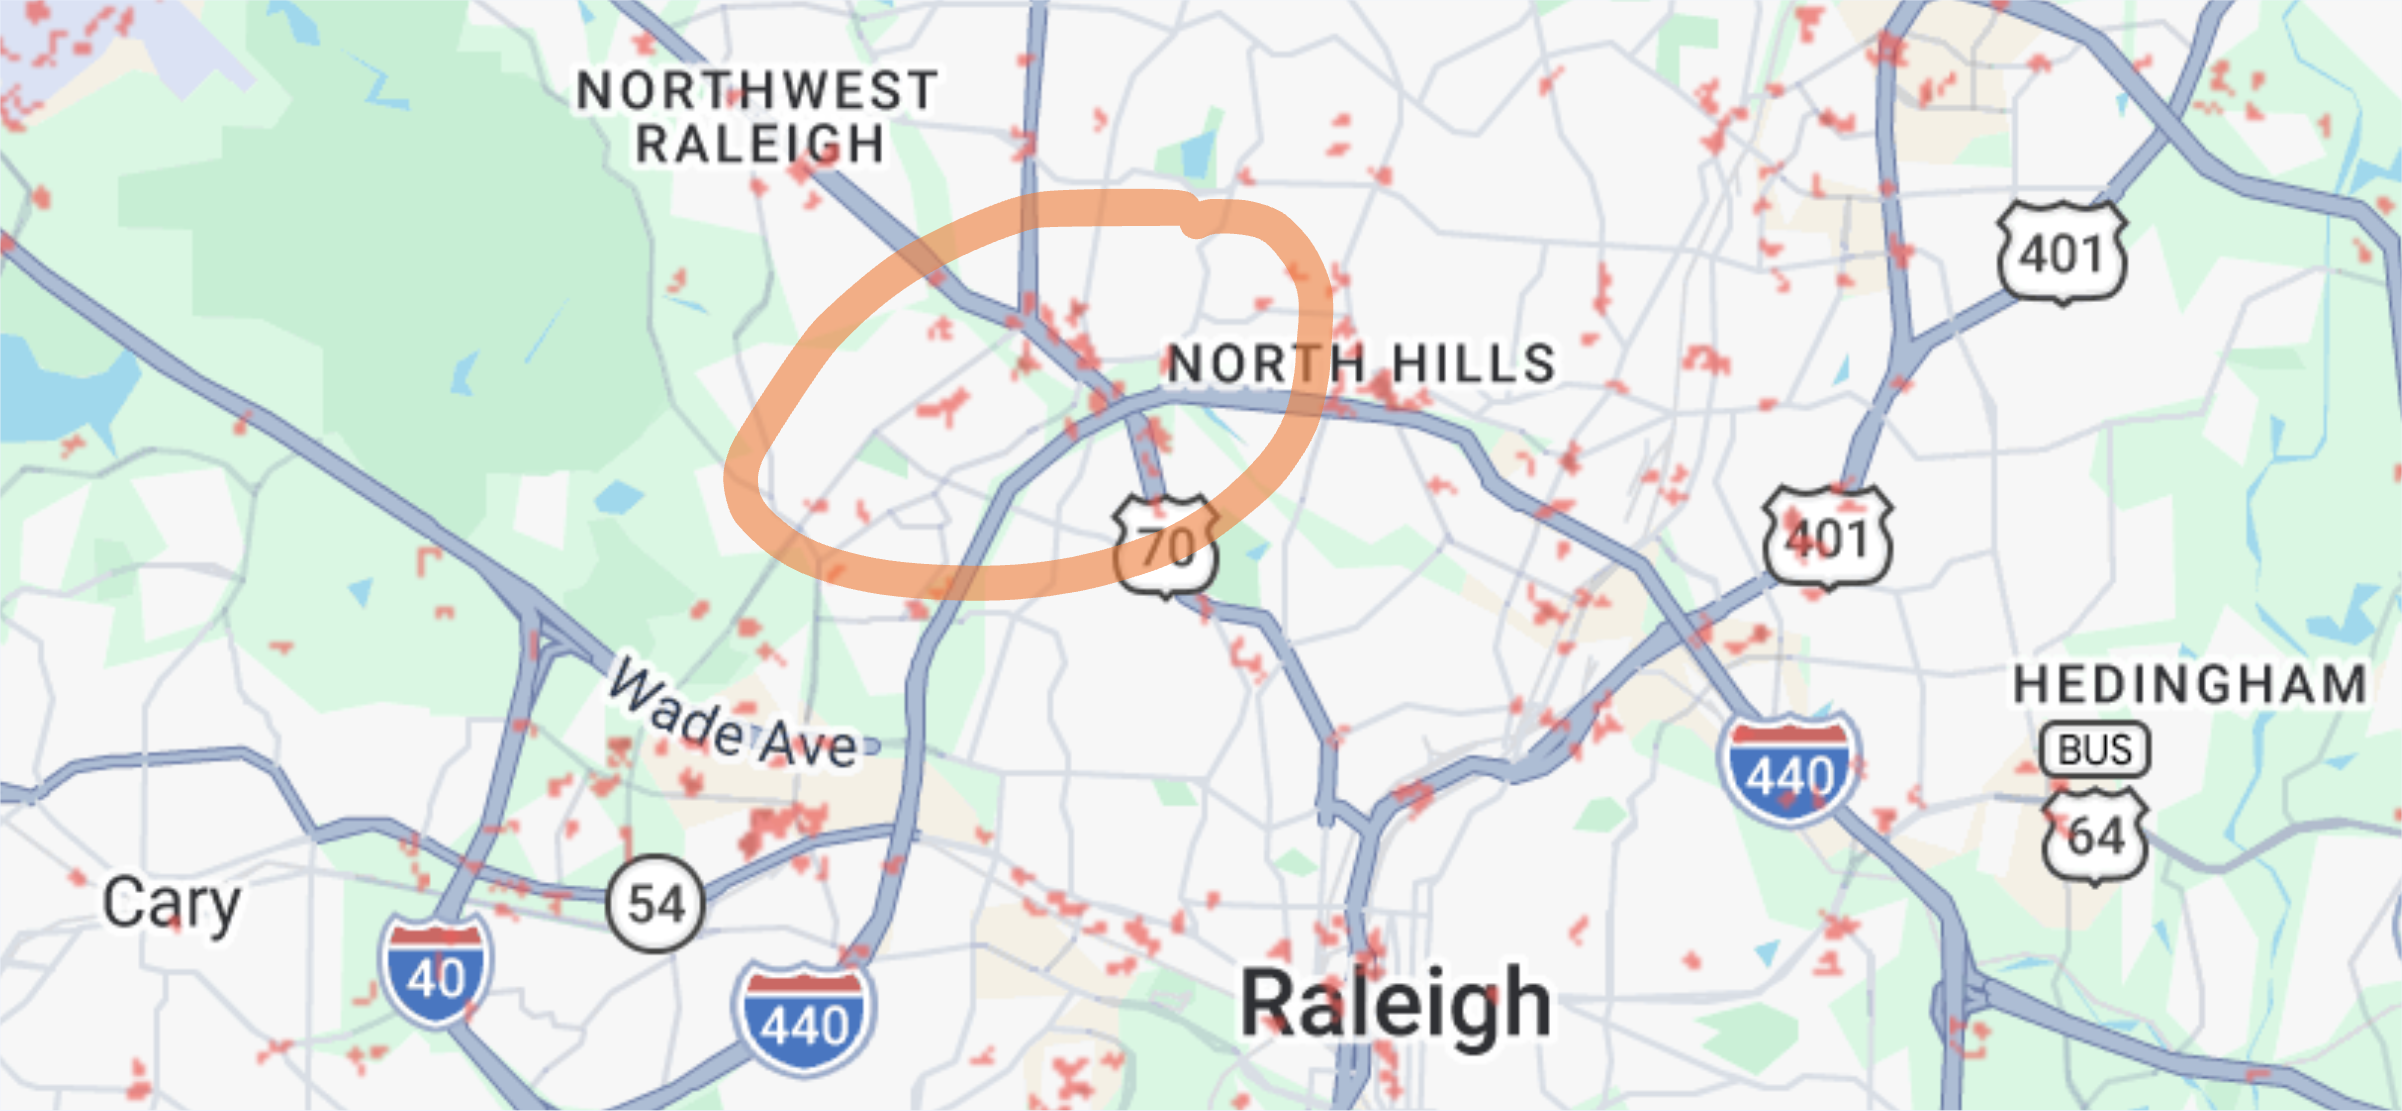
In Raleigh, the flood hotspot map revealed a spatially concentrated pattern of recurring flooding along Crabtree Creek and its tributaries, which flow through the northern and western parts of the city. High-frequency hotspots (detected in 4 or more events) were concentrated along Crabtree Creek’s floodplain, while moderate-frequency hotspots extended into adjacent low-lying neighborhoods and road underpasses. The detected hotspots fall along the Crabtree Creek corridor and its tributaries, known flood-prone waterways in the city (Figure 3).
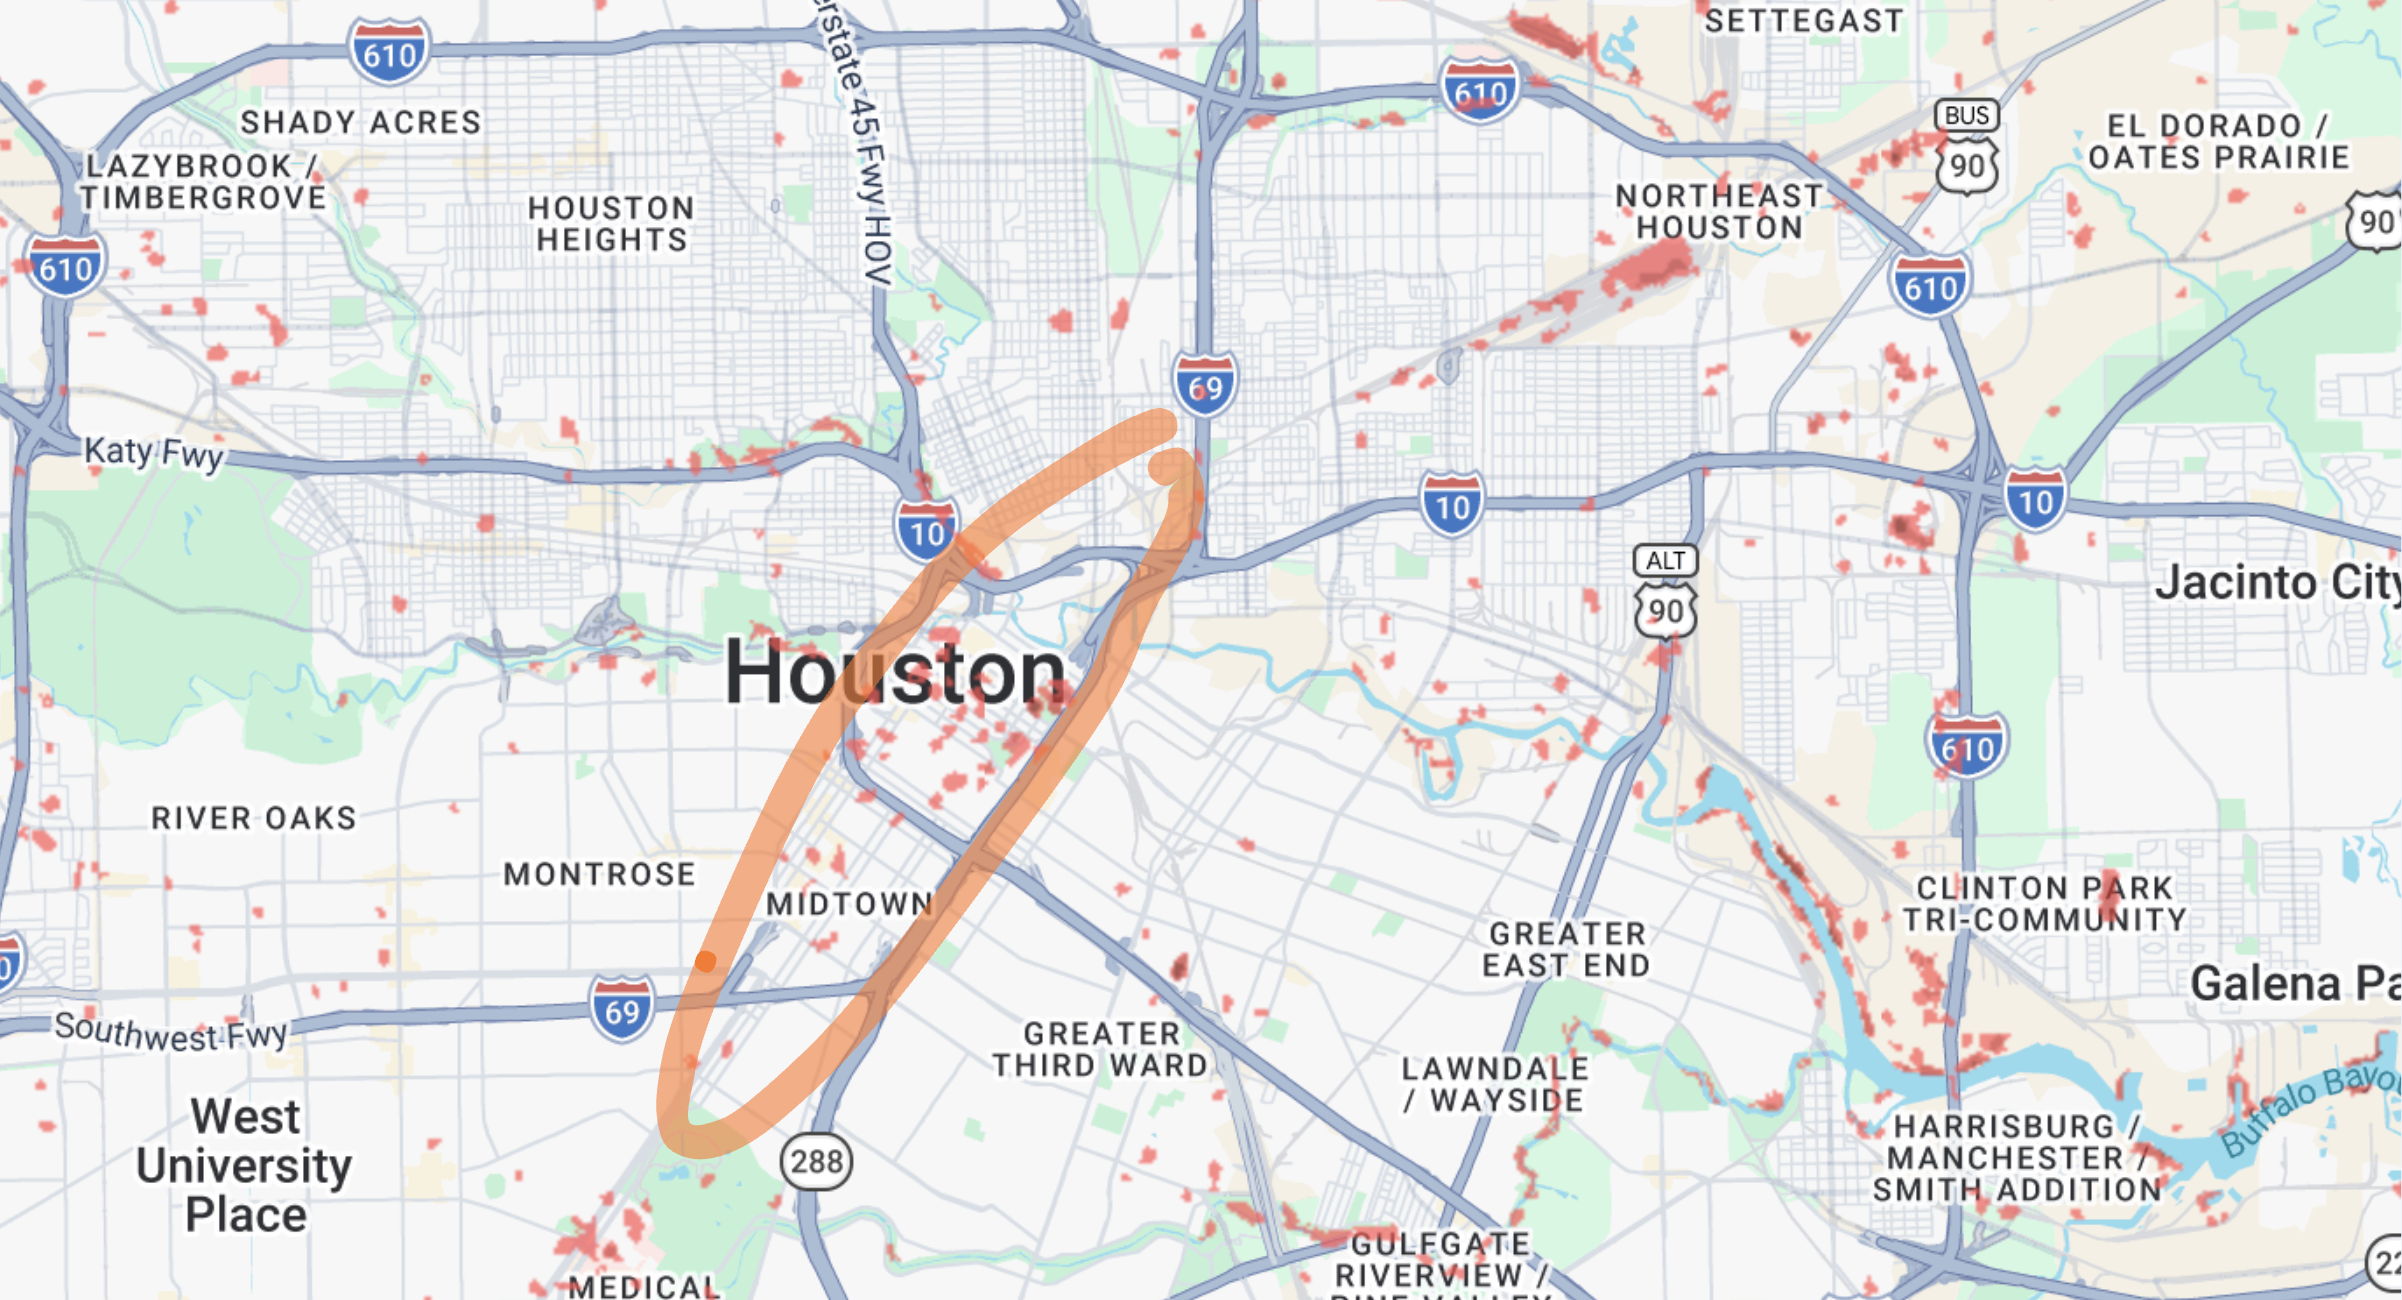
In Houston, the hotspot map showed a broader and more complex pattern, reflecting the city’s larger spatial extent and more diffuse flood vulnerability. High-frequency hotspots were concentrated near Buffalo Bayou and in low-lying areas of the urban core, with additional clusters of moderate-frequency flooding distributed across the city’s impervious surface network (Figure 4). The map captured flooding associated with major storm events including the remnants of tropical systems that affected Harris County during the study period.
Validation
Table 1 presents buffered detection recall against the independent validation locations at four buffer distances, with Wilson 95% confidence intervals.
| Buffer | Raleigh recall (95% CI) | Houston recall (95% CI) |
| 100 m | 36% (13/36; 22–52%) | 11% (3/28; 4–27%) |
| 250 m | 61% (22/36; 45–75%) | 36% (10/28; 21–54%) |
| 500 m | 89% (32/36; 75–96%) | 61% (17/28; 42–76%) |
| 1,000 m | 100% (36/36; 90–100%) | 89% (25/28; 73–96%) |
| Buffer | Raleigh detected | Raleigh random | Houston detected | Houston random |
| 100 m | 36% | 6% | 11% | 13% |
| 250 m | 61% | 16% | 36% | 22% |
| 500 m | 89% | 33% | 61% | 41% |
| 1,000 m | 100% | 63% | 89% | 70% |
| City | Independent points | Inside FEMA SFHA | Outside SFHA |
| Raleigh | 37 | 4 (10.8%) | 33 (89.2%) |
| Houston | 29 | 10 (34.5%) | 19 (65.5%) |
Recall increased with buffer distance, reaching 89% at 500 m and 100% at 1,000 m for Raleigh, and 61% and 89% for Houston (Table 1, with Wilson 95% confidence intervals). Recall was lower at fine buffers, particularly for Houston (11% at 100 m), consistent with positional uncertainty in NOAA report coordinates, which are often assigned at the county level, and with Houston’s larger and more dispersed study area. A random-location baseline gave much lower hit rates at most distances (Table 2): at 500 m, Raleigh recall was 89% versus 33% for random points, and Houston 61% versus 41%. At the finest 100 m buffer, however, Houston recall (11%) was comparable to the random baseline (13%); the SAR hotspots exceed the random baseline only at 250 m and coarser. Most independent flood locations fell outside FEMA Special Flood Hazard Areas (Table 3), indicating that recurring urban flood reports are not fully captured by regulatory floodplain maps. Table 3 includes all 37 Raleigh and 29 Houston validation points with coordinates. Tables 1 and 2 use 36 and 28 points—the subset that fall inside each city’s GEE study area.
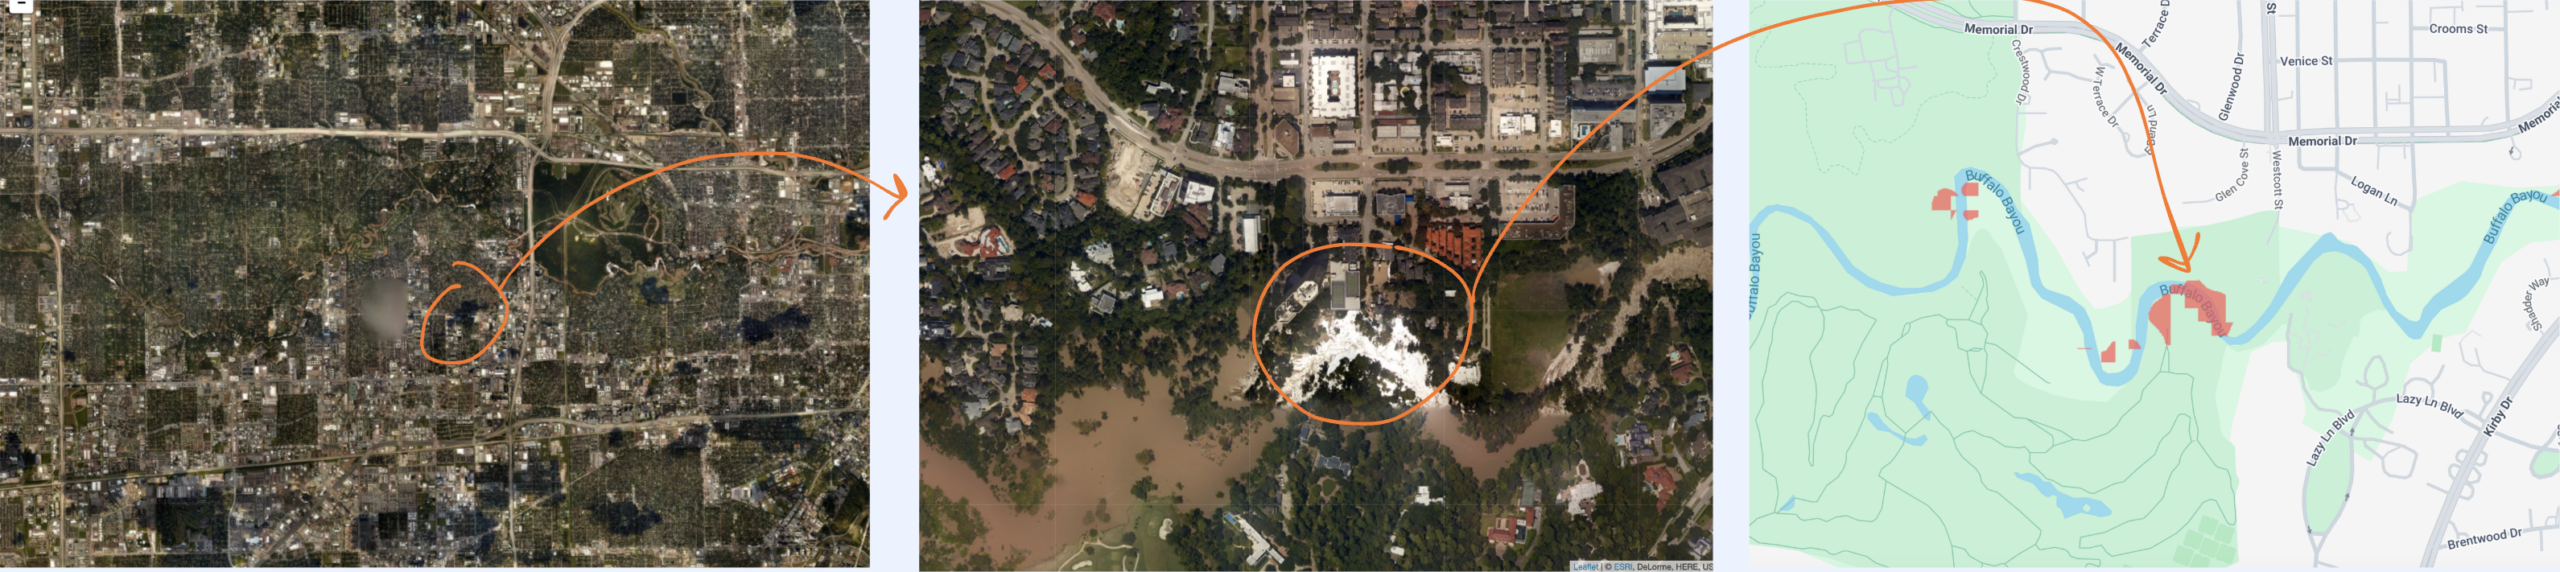
Figure 5 provides an illustrative comparison of aerial imagery and the SAR-derived flood hotspot for Hurricane Harvey (2017)17 in Houston, one of the major events included in the analysis. The left panel shows a city-scale aerial view with the flooded area circled, while the center panel provides a zoomed aerial view of the flooded neighborhood. The right panel shows the corresponding SAR-detected flood hotspot in the same area, demonstrating visual agreement between the algorithm’s detection and the observed pattern of inundation.
Discussion
The strong detection performance across two cities with very different flood patterns shows that combining observations from multiple storm events is central to what makes this system work. Rather than relying on any single satellite image pair, the method builds up a picture of flood-prone areas over time, filtering out locations that only flooded once and highlighting those that flood consistently, something a single-event analysis cannot do.
The detected hotspots concentrate along the major waterway corridors in both cities (Buffalo Bayou in Houston and Crabtree Creek in Raleigh), which are well-known flood-prone areas rather than locations with only minor or one-off flooding. This pattern gives confidence that the algorithm is identifying real, recurring flood risk rather than picking up on noise or sensor errors.
Raleigh’s higher recall compared to Houston likely reflects several factors. Raleigh’s flood events are more spatially focused, concentrated along a well-defined creek corridor that generates consistent, detectable SAR signatures across multiple events. Houston’s more diffuse flood pattern, driven by its flat topography, extensive impervious network, and varied storm types including tropical systems, presents greater challenges. Urban backscatter in dense commercial and residential areas can be affected by double-bounce scattering from buildings, which partially masks the flood-related backscatter decrease and may cause some flooded areas to go undetected.
Several Sentinel-1 studies have mapped urban flooding using more complex methods: Chini et al.4 combined SAR intensity and InSAR coherence to detect floodwater in Houston during Hurricane Harvey, while Li et al.10 and Lin et al.5 used Bayesian fusion of SAR intensity and coherence (the latter a Hurricane Matthew case study). This study uses a simpler threshold-based approach combined with multi-event aggregation, while being faster to run and fully reproducible with freely available tools.
One of the system’s main strengths is that it uses only freely available data and runs entirely in Google Earth Engine, requiring no specialized software or local infrastructure. Unlike traditional flood models that need detailed local survey data, this approach can be applied to many cities with Sentinel-1 coverage. Once flood events are selected, the rest of the process is automated and can be run consistently across different cities.
Sentinel-1 C-band backscatter change detection is less reliable in dense urban settings than over open water or rural floodplains, because building geometry produces layover, shadow, and double-bounce effects that can complicate interpretation of backscatter decreases as inundation. This method does not use interferometric coherence or polarimetric decomposition, which can improve discrimination in complex scenes but require different data products and processing. The maps show general flood-prone areas, not exact street- or building-level inundation.
Hotspot frequency reflects the number of Sentinel-1-observed flood events at each location, not the total number of NOAA-reported floods, and mapped events are irregularly spaced in time because they depend on Sentinel-1 availability (for example, the Raleigh composites fall in 2018, 2022, and 2024, while the Houston composites cluster around the 2017 and 2019 events). Frequency counts only storms where Sentinel-1 had usable images, not every NOAA flood on record; independent validation uses the full set of held-out NOAA locations, separate from the frequency product.
There are several limitations to note. The detection thresholds were selected on a training subset of mapped events in each city and locked before map construction and validation; how well a single fixed threshold transfers to cities with very different urban layouts nonetheless remains untested. The 90-meter smoothing window applied during preprocessing may cause narrow flood channels or small flooded areas to go undetected. Dense high-rise urban areas also present challenges because the radar signal bounces off buildings in complex ways that can interfere with flood detection. Finally, the method detects only the presence of surface water, not flood depth or velocity. Two locations with the same detection frequency may therefore carry very different hazard levels, which limits the method’s usefulness for severity-based emergency management decisions. In addition, although the independent validation set is drawn from events not used to build the map, NOAA reports still define both the event universe and the reference coordinates; incorporating fully independent ground truth such as aerial flood imagery or road-closure records is left for future work. Because the pre- and post-event acquisition windows and the Sentinel-1 revisit are fixed, very rapid flash floods that recede before the post-event image may be missed; per-event acquisition dates and lags are listed in Table S1.
The potential applications of this work go beyond the two cities studied here. City planners and emergency managers typically rely on FEMA flood maps, which are built around rare, large flood events and may not reflect the more frequent, moderate flooding that most affects residents day to day. The hotspot maps produced by this system offer a practical complement, based on what has actually happened rather than model predictions. They could help prioritize stormwater infrastructure upgrades, improve evacuation planning, and give residents a clearer picture of their local flood risk.
This study shows that recurring urban flood hotspots can be identified using freely available satellite radar data, without needing complex hydrologic models or expensive inputs. Tested across two cities with different flood patterns, the system identified the large majority of independently documented flood locations within 1,000 meters, while recall at finer distances was more limited. The key insight is simple: places that flood repeatedly across multiple storms leave a consistent pattern in satellite imagery, and stacking those observations over time reveals where flooding is a persistent problem, not just a one-time event. There is meaningful room to improve. Future work using road closure records, insurance claims, or community-reported flood data would allow for more rigorous validation against independent reference data. Longer-term, applying the system to more cities, adding flood depth estimates, and adjusting for shifting flood patterns under climate change are all natural next steps.
Acknowledgments
I would like to express my sincere gratitude to Professor Ranji Ranjithan and Dr. Hana C. Long at North Carolina State University for their invaluable mentorship and guidance throughout this research. I am also grateful to my labmates for their continued support, feedback, and encouragement during the course of this project.
Supplementary Information
References
- NOAA National Centers for Environmental Information. U.S. billion-dollar weather and climate disasters. National Oceanic and Atmospheric Administration, 2025, https://doi.org/10.25921/stkw-7w73. [↩]
- USGCRP. Climate science special report: Fourth National Climate Assessment, Volume I. D. J. Wuebbles, D. W. Fahey, K. A. Hibbard, D. J. Dokken, B. C. Stewart, T. K. Maycock (Eds.). U.S. Global Change Research Program, Washington, DC, 2017, https://doi.org/10.7930/J0J964J6. [↩]
- O. E. J. Wing, P. D. Bates, A. M. Smith, J. C. Neal, N. Quinn, C. C. Sampson, M. Morsy. Estimates of present and future flood risk in the conterminous United States. Environmental Research Letters. Vol. 13, pg. 034023, 2018, https://doi.org/10.1088/1748-9326/aaac65. [↩]
- M. Chini, R. Pelich, L. Pulvirenti, N. Pierdicca, R. Hostache, P. Matgen. Sentinel-1 InSAR coherence to detect floodwater in urban areas: Houston and Hurricane Harvey as a test case. Remote Sensing. Vol. 11, pg. 107, 2019, https://doi.org/10.3390/rs11020107. [↩] [↩] [↩]
- Y. N. Lin, S-H. Yun, A. Bhardwaj, E. M. Hill. Urban flood detection with Sentinel-1 multi-temporal synthetic aperture radar observations in a Bayesian framework. Remote Sensing. Vol. 11, pg. 1778, 2019, https://doi.org/10.3390/rs11151778. [↩] [↩] [↩]
- D. C. Mason, S. L. Dance, H. L. Cloke. Floodwater detection in urban areas using Sentinel-1 and WorldDEM data. Journal of Applied Remote Sensing. Vol. 15, pg. 032003, 2021, https://doi.org/10.1117/1.JRS.15.032003. [↩] [↩]
- A. Twele, W. Cao, S. Plank, S. Martinis. Sentinel-1-based flood mapping: a fully automated processing chain. Natural Hazards and Earth System Sciences. Vol. 16, pg. 989–1004, 2016, https://doi.org/10.5194/nhess-16-989-2016. [↩] [↩]
- R. Torres, P. Snoeij, D. Geudtner, D. Bibby, M. Davidson, E. Attema, P. Potin, B. Rommen, N. Floury, M. Brown, I. N. Traver, P. Deghaye, B. Duesmann, B. Rosich, N. Miranda, C. Bruno, M. L’Abbate, R. Croci, A. Pietropaolo, M. Huchler, F. Rostan. GMES Sentinel-1 mission. Remote Sensing of Environment. Vol. 120, pg. 9–24, 2012, https://doi.org/10.1016/j.rse.2011.05.028. [↩]
- N. Gorelick, M. Hancher, M. Dixon, S. Ilyushchenko, D. Thau, R. Moore. Google Earth Engine: planetary-scale geospatial analysis for everyone. Remote Sensing of Environment. Vol. 202, pg. 18–27, 2017, https://doi.org/10.1016/j.rse.2017.06.031. [↩] [↩]
- Y. Li, S. Martinis, M. Wieland, S. Schlaffer, R. Natsuaki. Urban flood mapping using SAR intensity and interferometric coherence via Bayesian network fusion. Remote Sensing. Vol. 11, pg. 2231, 2019, https://doi.org/10.3390/rs11192231. [↩] [↩]
- B. Tellman, J. A. Sullivan, C. Kuhn, A. J. Kettner, C. S. Doyle, G. R. Brakenridge, T. A. Erickson, D. A. Slayback. Satellite imaging reveals increased proportion of population exposed to floods. Nature. Vol. 596, pg. 80–86, 2021, https://doi.org/10.1038/s41586-021-03695-w. [↩]
- M. Drusch, U. Del Bello, S. Carlier, O. Colin, V. Fernandez, F. Gascon, B. Hoersch, C. Isola, P. Laberinti, P. Martimort, A. Meygret, F. Spoto, O. Sy, F. Marchese, P. Bargellini. Sentinel-2: ESA’s optical high-resolution mission for GMES operational services. Remote Sensing of Environment. Vol. 120, pg. 25–36, 2012, https://doi.org/10.1016/j.rse.2011.11.026. [↩]
- D. P. Roy, M. A. Wulder, T. R. Loveland, et al. Landsat-8: Science and product vision for terrestrial global change research. Remote Sensing of Environment. Vol. 145, pg. 154–172, 2014, https://doi.org/10.1016/j.rse.2014.02.001. [↩]
- NOAA National Centers for Environmental Information. Storm Events Database. National Oceanic and Atmospheric Administration. https://www.ncdc.noaa.gov/stormevents/, 2025. [↩]
- J-F. Pekel, A. Cottam, N. Gorelick, A. S. Belward. High-resolution mapping of global surface water and its long-term changes. Nature. Vol. 540, pg. 418–422, 2016, https://doi.org/10.1038/nature20584. [↩]
- D. Zanaga, R. Van De Kerchove, D. Daems, W. De Keersmaecker, C. Brockmann, G. Kirches, J. Wevers, O. Cartus, M. Santoro, S. Fritz, M. Lesiv, M. Herold, N.-E. Tsendbazar, P. Xu, F. Ramoino, O. Arino. ESA WorldCover 10 m 2021 v200. Zenodo. 2022, https://doi.org/10.5281/zenodo.7254221. [↩]
- E. S. Blake, D. A. Zelinsky. Hurricane Harvey: National Hurricane Center tropical cyclone report AL092017. NOAA National Hurricane Center, 2018. https://www.nhc.noaa.gov/data/tcr/AL092017_Harvey.pdf. [↩]