Neil Panchal1, Krish Pruthi1
1 University of Maryland – Institute for Bioscience and Biotechnology Research
Abstract
Background/Objective: Antibiotic resistance already kills over a million people a year, and the number keeps rising. However, new solutions are emerging with the rapid growth in artificial intelligence, especially from deep learning. Our goal was to design an antimicrobial peptide (AMP) with successful bactericidal activity using an artificial intelligence approach, specifically through specialized physicochemical filtering, and then conduct in vitro testing.
Methods: Our initial step was to fine-tune an ESM-2 protein language model on four different negative training sets; this was done intentionally to get the model to understand what an AMP should not look like. Everything else was held identical so an accurate ablation study could be made on which dataset was most optimal to use. From the best model, we generated roughly 1,000 candidate peptides and filtered them by physicochemical properties and hemolysis risk. The top candidate was then tested against six bacterial strains using spot assays, quantitative log-kill assays (n=3), and hemolysis assays.
Results: The DisProt-based negatives classified best, with an F1 of 0.981 and a ROC-AUC of 0.987. Our lead candidate, AMP_031, which we named NeKtar-1 (GRWGFGWARIRGSVGFGKK), shares only about 31.6% maximum identity with any known AMP. In the lab, it killed drug-resistant E. coli ATCC 35218 (greater than a 4.1-log reduction, MBC 125 µg/mL) and P. aeruginosa ATCC 27853 (greater than a 4.9-log reduction, MBC ≤ 31.25 µg/mL), with no activity against Gram-positive species. Its HC50 was around 48 µg/mL, giving a therapeutic index of 0.38 against E. coli and 1.5 against P. aeruginosa.
Conclusions: All three computational hemolysis-prediction tools we tried classified NeKtar-1 as non-hemolytic when it was not, exposing a key flaw in how these tools handle amphipathicity. Ultimately, this study shows that a successful, viable antimicrobial peptide can be designed from a machine-learning pipeline, and that current hemolysis predictors need to be treated with caution.
Keywords: antimicrobial peptides, protein language models, ESM-2, negative sampling, hemolysis prediction, drug-resistant bacteria
Introduction
This year alone, antimicrobial resistance has resulted in 1.27 million deaths worldwide, and by 20501,2, it will lead to 39 million deaths cumulatively. Bacteria are typically broken into two main categories, Gram-negative and Gram-positive, with Gram-negative pathogens like P. aeruginosa and E. coli being notoriously challenging to combat, as the bacteria’s cell envelope has the capacity to resist penetration by multiple drugs. Both are included on the WHO’s priority pathogen list3, and recent progress in the traditional approach of designing drugs against specific targets has stalled4,5. AMPs approach a problem by creating a different mechanism from what other conventional antibiotics use6. They target the bacterial cell membrane through interaction with the negative surface charge on Gram-negative outer membrane lipopolysaccharides (LPS), eventually causing it to form a pore in the cell bilayer7.
An important deficit is that few researchers usefully compare which negative training example should be used in machine-learning AMP classifiers. They inform what model learning is based on, but most use randomly shuffled (without rationalisation of the reason, but an accepted iniquity within the field) or purely arbitrary ones8. Not only that, but even less validate results experimentally9,10,11,12. It is currently, therefore, not guaranteed that calculated targets are real (i.e., active, predicted to lyse, the process produces a good peptide beyond ideal in-silico score). We compared four negative set choices in the training of ESM-2, finding DisProt disordered sequences to be optimal, and employed this pipeline to both discover a novel peptide and empirically characterise it.
In this study, we had 3 objectives: Compare the 4 negative sampling methods of ESM-2 fine-tuning systematically on all else being equal; use the best condition to create and rank-filter de novo AMP candidates with a multi-stage physicochemical pipeline; and experimentally characterize the top-ranking candidate’s potential in terms of bactericidal activity, Gram-selectivity, and hemolysis.
Methods
Computational Pipeline
Dataset Construction
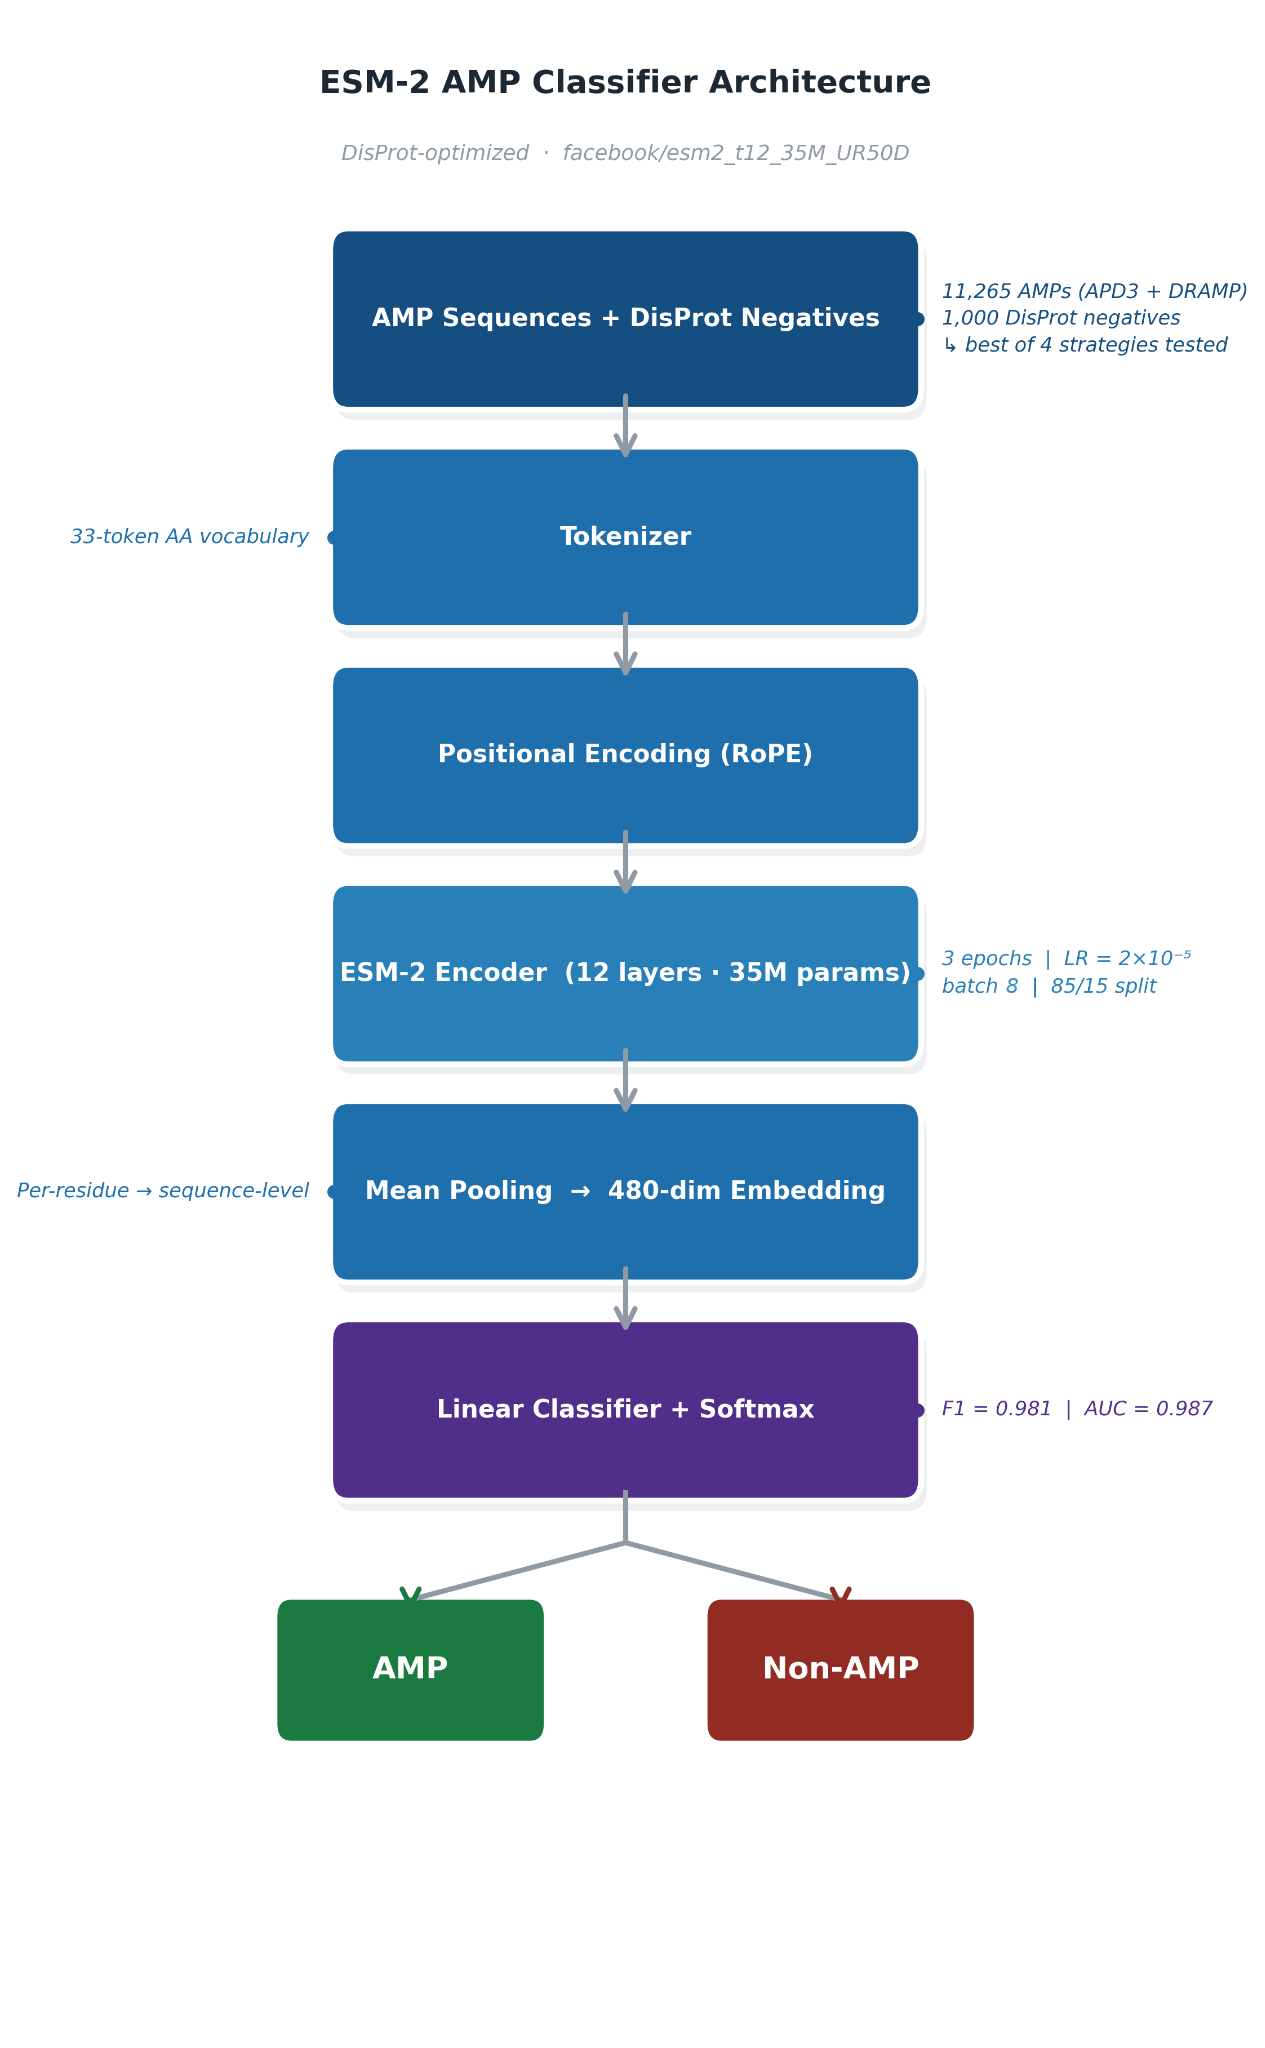
We built our dataset of 11,265 experimentally validated AMPs from 2 databases: APD3 (5203 entries)13 and DRAMP 2.0 (6062 entries)14. Some entries in DRAMP are derived from computational prediction and annotation; all entries that passed our deduplication threshold were kept and noted as a potential source of noise. After deduplicating, we filtered below 30% identity to get a set of 3,868 non-redundant AMP sequences. A 30% pairwise identity cutoff is used commonly as a rule-of-thumb; above 40% of the set becomes mostly close family sequences, while under 25% would mean throwing away a great deal of data. Four negative sets, each 1000 sequences long, are generated: composition-matched shuffled AMPs, intrinsically disordered proteins from DisProt15, sequences with equal-frequency randomly drawn residues, and a set with an equal number of each of the first three sequences.
Model Training and Ablation Study
For our machine learning model, we employed the pre-trained 35M parameter model of ESM-2 (facebook/esm2_t12_35M_UR50D), trained on 250M protein sequences16, and appended a classifier head which returns AMP or non-AMP. The four configurations were fine-tuned equally using HuggingFace Transformers17 for 3 epochs with a learning rate of 2e-5, training batch size 8 (eval batch size 16), 85/15 stratified split, and a random seed of 42. This is an ablation study, wherein we change only the negative set while all other hyperparameters are kept the same. We assess them based on F1-score and ROC-AUC.
Candidate Generation and Filtering
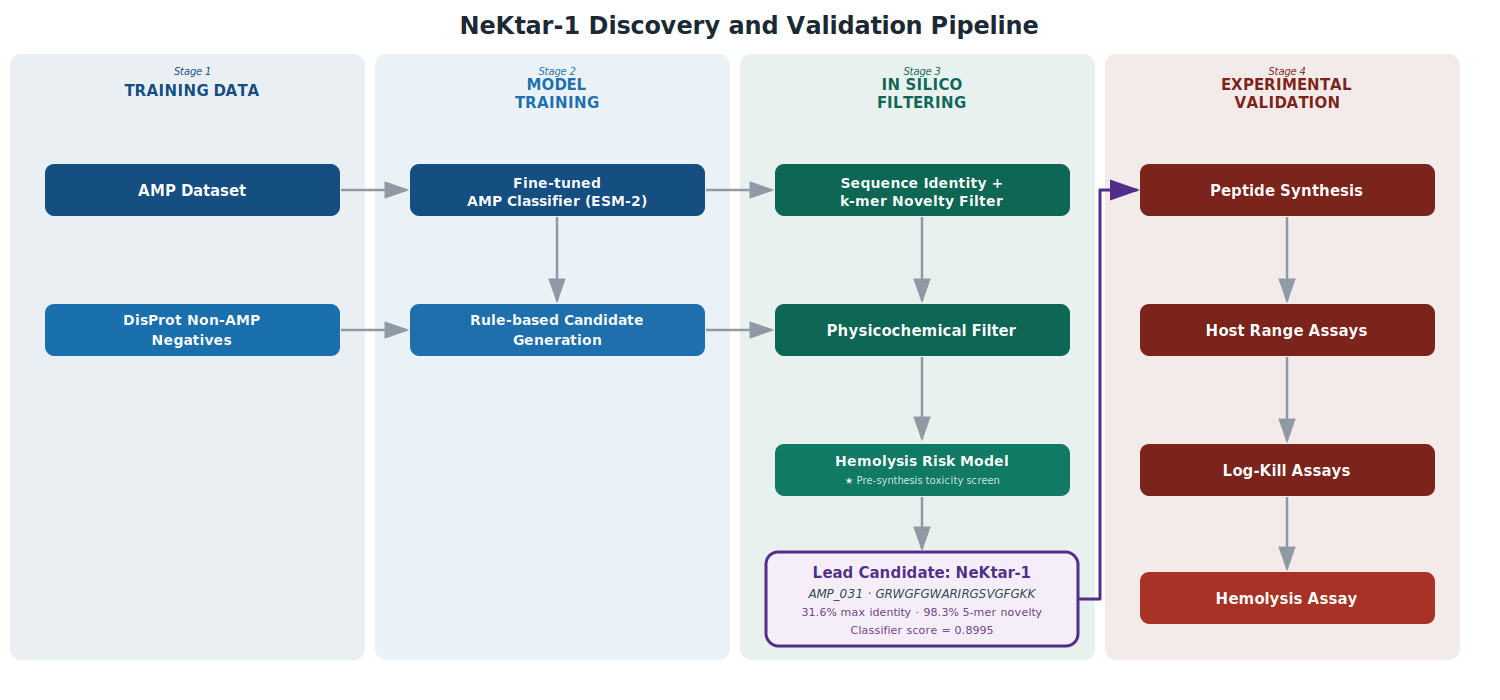
We selected 1,000 sequences using rule-based sampling to try to achieve a composition of 30% cationic, 50% hydrophobic, and 20% flexible amino acid residues. We filtered the sequences in this order: an ESM-2 confidence score above 0.90 (999 sequences remain); a net charge from +2 to +9 (754 sequences remain); a GRAVY value18 of -1.0 down to +0.5 (528 sequences remain); a length between 18 and 30 residues (374 sequences remain). We filtered based on the 50 highest scores.
Novelty Analysis
Maximum pairwise identity compared with full APD3 was calculated. A normalized Levenshtein distance was calculated as well. Novelty of the k-mers was assessed by determining the proportion of 5-residue fragments absent from a sample of 500 sequences from the APD3 database (this is a sampling estimate, not an exhaustive search).
Hemolysis Risk Scoring and Lead Selection
We calculated a composite hemolysis-risk score (from 0 to 1) for each candidate on the basis of five correlates: GRAVY, aromatic content, tryptophan density, net charge, and the longest uninterrupted stretch of hydrophobicity. A selectivity score was calculated as the AMP-confidence times (1 – the hemolysis risk). A total of 18 out of the top 50 had a risk of below 0.4. We selected 5 weighted metrics (selectivity, 35%; length-normalized performance, 25%; predicted salt tolerance, 20%; protease resistance, 15%; and ease of synthesis, 5%), calculated a composite score, and selected the highest-ranking AMP as AMP_031 (with a score of 1.0925).
Experimental Validation
Peptide Synthesis
AMP_031 (GRWGFGWARIRGSVGFGKK) was commercially synthesized by Biomatik using solid-phase peptide synthesis, purified by HPLC to 88.88%, with identity confirmed by mass spectrometry. As our study’s primary intention was a proof-of-concept, this purity was sufficient for our study. Once the peptide was synthesized and received, we dissolved the peptide in sterile water to make a 500 µg/mL stock, and then we stored it in a freezer at −20 °C. Right before we began our serial dilution assays, the stock was diluted using PBS to factor in salinity.
Bacterial Strains and Culture Conditions
There were six strains that were tested. This includes E. coli BL21 (a lab strain), E. coli ATCC 35218, P. aeruginosa ATCC 27853, A. baumannii ATCC 19606, B. cereus ATCC 4342, and S. pyogenes D471. Each strain was grown overnight at 37 °C in LB, a nutrient broth. Then we rinsed it in PBS, and adjusted it to about 100 million bacteria per milliliter (OD600 = 1.0).
Initial Activity Screening
In the first experiment where we tested NeKtar-1, we plated 10 µL of NeKtar-1 (250 µg/mL) on the dry LB agar on half the plate and a PBS control on the other half. We let them incubate overnight at 37 °C. We also set up halo assays to test the antimicrobial ability of our peptide on the LB agar plate. However, there were no halos on those plates after incubation, so our immediate reaction was that NeKtar-1 simply does not have any antibacterial activity. After finding killing in liquid assays, we realized that the peptide is too membrane-active and did not readily diffuse through the agar. We did not see a halo on those plates because the setup of the halo diffusion assay was not compatible with NeKtar-1.
Quantitative Log-Kill Assays
Two-fold dilutions of NeKtar-1 were prepared ranging from 250 to 31.25 µg/mL in a 96-well plate format. We added bacteria at an OD600 = 1.0, incubated for 10-15 min at room temperature, plated 10-fold dilutions onto LB agar, and incubated overnight at 37 °C. We defined the endpoint as the minimum concentration causing at least a 3-log (99.9%) kill. These are very quick log kill assays (10-15 min) as opposed to formal MBC determinations (18-24 hours)19. We call these MBC values by shorthand only because of the fast membrane-associated activity of the peptides.
Hemolysis Assay
We incubated bovine red blood cells at 1% or 10% in PBS at pH 7.4 with varying concentrations of peptide (from 31.25 to 250 µg/mL), added an equal volume of RBCs, and incubated at 37°C for 90 min, with the conditions identical among tests. The positive control (0.1% Triton X-100) and the negative control (PBS) were used, and we measured absorbance at 545 nm. Moreover, HC50 was calculated based on linear interpolation on a log scale. We also used the equation HC50/MBC as a representation of the therapeutic index (TI).
Computational Hemolysis Prediction Benchmarking
We submitted NeKtar-1 and our custom risk model to two external servers, HemoPI 2.0 and ToxinPred20,21, and compared their results with our results with the experimental one. For this prediction, we do mention that neural predictors for hemolysis, like HAPPENN22 or AMPDeep23, use similar sets of features.
Biosafety
All work was conducted under BSL-2 containment at the University of Maryland IBBR, under IBC Protocol #176 and the supervision of a principal investigator.
Results
Negative Sampling Strategy Significantly Impacts Model Performance
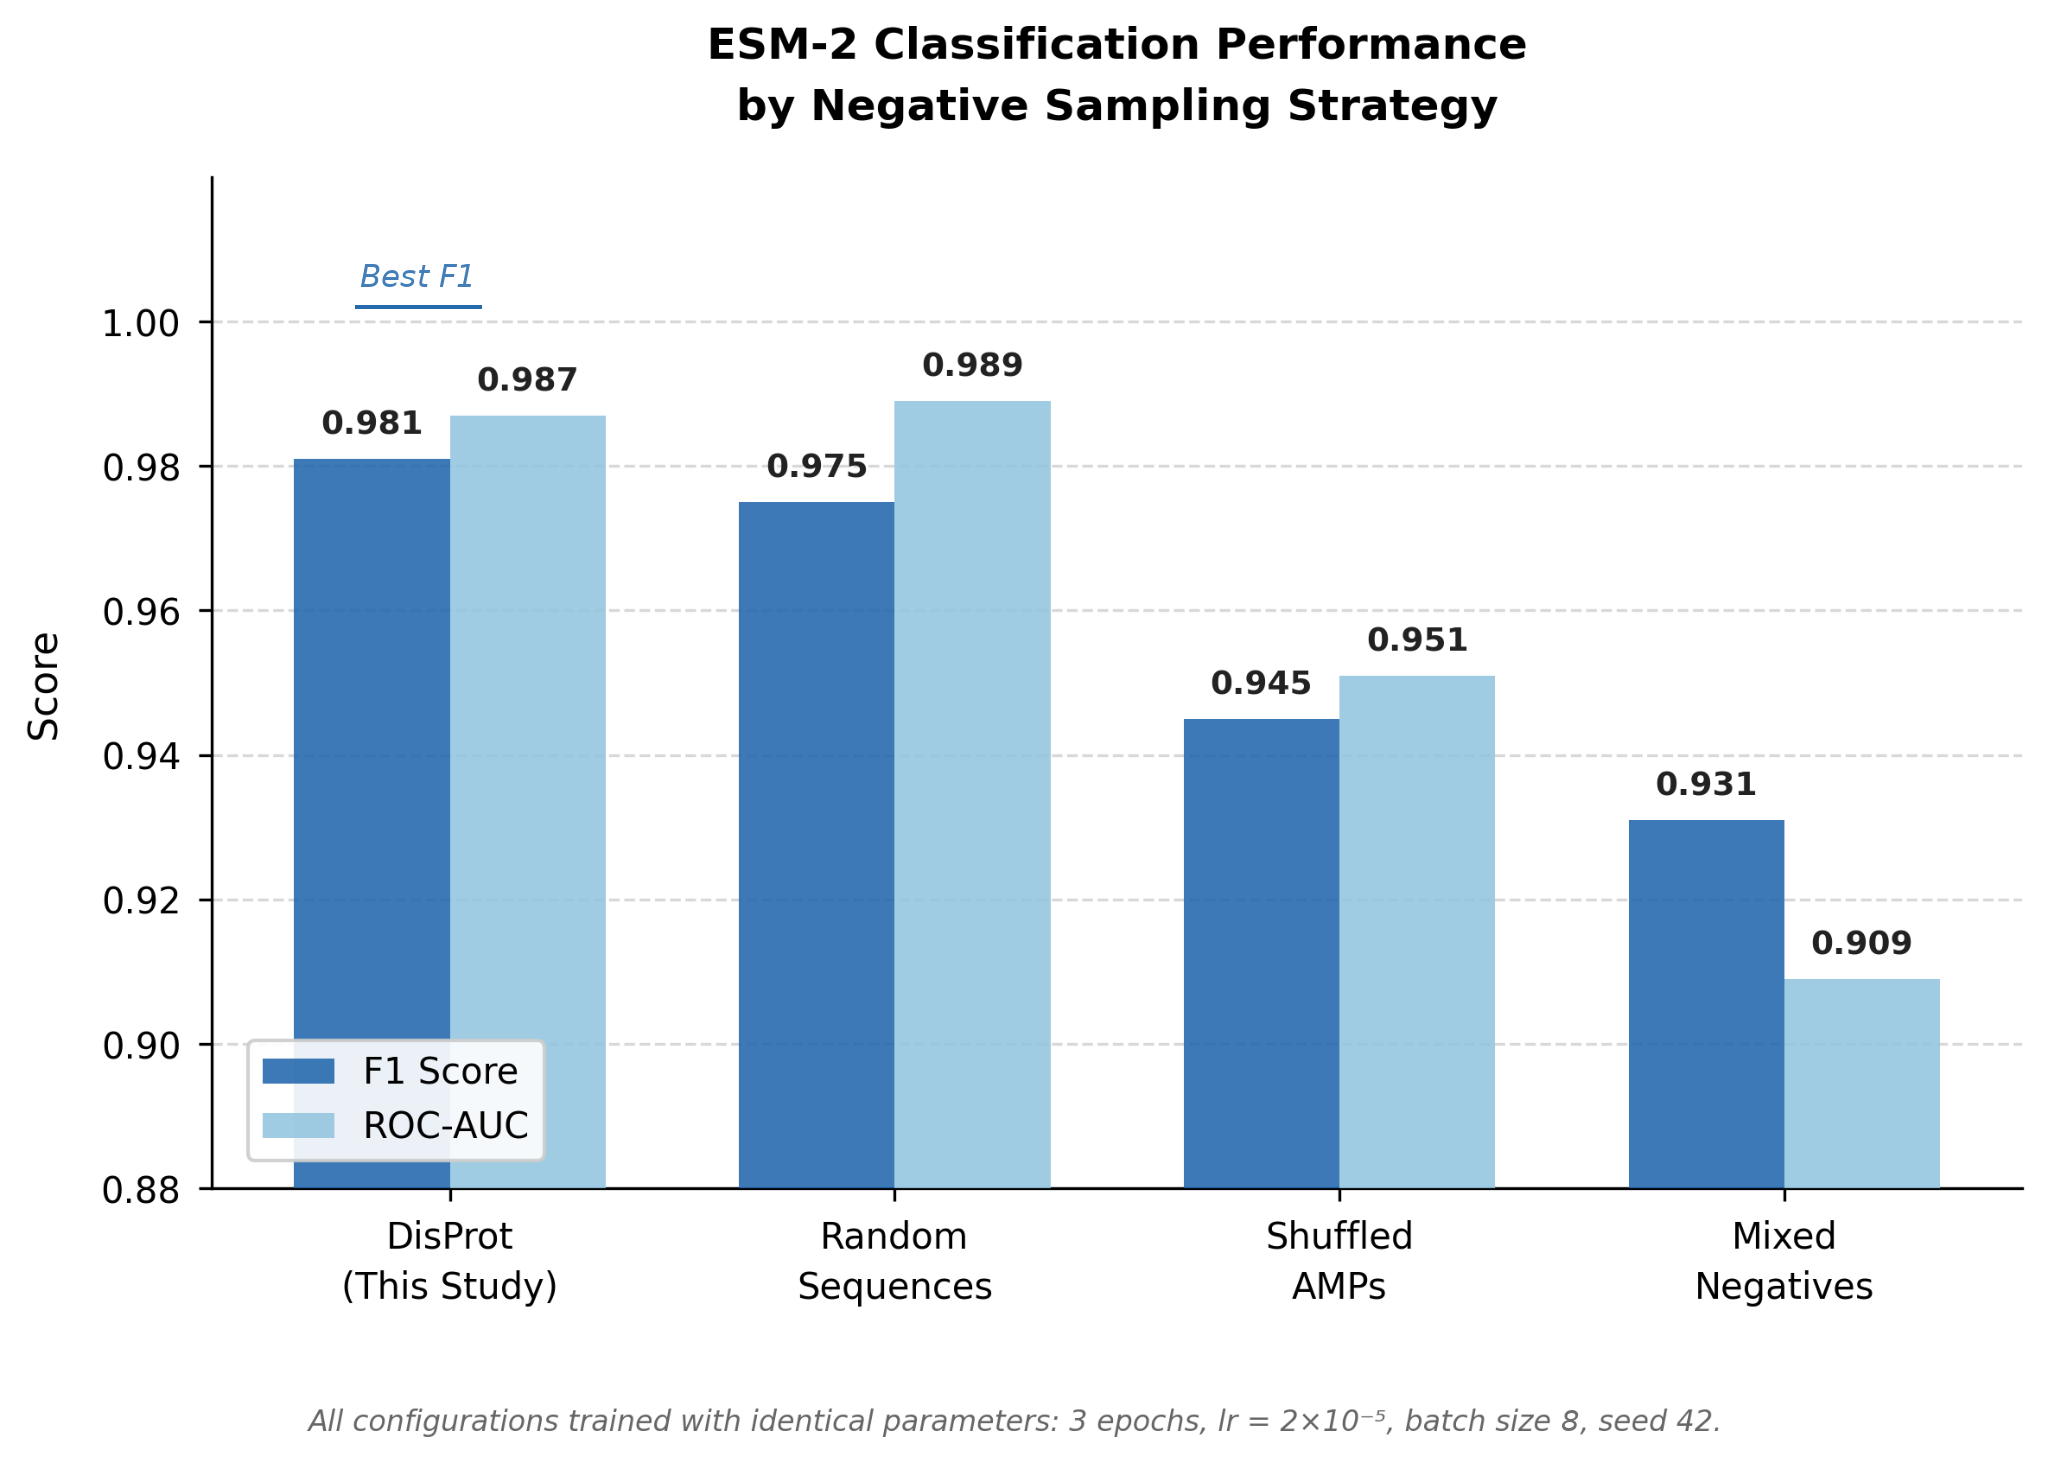
Performance was largely affected by the choice of negative sampling. The DisProt negatives yielded the highest performance, with an F1 of 0.981 and a ROC-AUC of 0.987. Random sequences had a slightly better ROC-AUC of 0.989, but it had a lower F1 score of 0.975. The shuffled AMPs reached an F1 of 0.945 and a ROC-AUC of 0.951, and the mixed set performed the worst with an F1 of 0.931 and a ROC-AUC of 0.909. Ultimately, we chose DisProt as our final negative set based on its F1 score, since that metric was most important to us. However, this came from a single train/test split and one seed (42), so cross-validation and confidence intervals are still required to fully ensure accurate conclusions. We had initially expected a varied negative set to make the model more accurate, but the opposite happened. Training on disordered proteins that closely resembled real peptides seemed to teach the model more useful distinctions, while the mixed set just added noise.
| Negative Sampling Strategy | F1 Score | ROC-AUC | Notes |
| DisProt (disordered proteins) | 0.981 | 0.987 | Best F1 score; note: random sequences achieved marginally higher ROC-AUC (0.989 vs. 0.987) |
| Random sequences | 0.975 | 0.989 | High AUC, lower F1 |
| Shuffled AMPs | 0.945 | 0.951 | Composition-matched |
| Mixed negatives | 0.931 | 0.909 | Worst overall |
| Filtering Stage | Criterion | Threshold | n remaining |
| 1. Initial generation | ESM-2 AMP confidence | > 0.90 | 999 |
| 2. Net charge | Net charge at pH 7 | +2 to +9 | 754 |
| 3. GRAVY score | GRAVY hydrophobicity index | -1.0 to +0.5 | 528 |
| 4. Length | Peptide length | 18-30 AA | 374 |
| 5. Top candidates | Rank by AMP confidence | Top 50 | 50 |
| 6. Hemolysis risk | Composite hemolysis risk score | < 0.4 | 18 |
| 7. Composite ranking | Selectivity + synthesis + salt tolerance + protease resistance | Highest score | 1 (NeKtar-1, score 1.0925) |
NeKtar-1 Is a Novel Antimicrobial Peptide Candidate
A total of 1,000 sequences were initially generated, but through each filtering step, the number of sequences progressively decreased, first to the top 50, then to 18 low-risk options, and finally to a single sequence, AMP_031. This peptide consisted of only 19 amino acids, having the best synthesis feasibility and a composite score of 1.0925. It had a sequence of GRWGFGWARIRGSVGFGKK and was renamed to “NeKtar-1.”
As part of this study, it was key to validate that NeKtar-1 had a novel sequence. After we compared it to the APD3 database of known peptides, the closest match was only 31.6%, and a Levenshtein analysis confirmed the divergence. Furthermore, for k-mer novelty, 19.5% of its 3-mers, 79.5% of its 4-mers, and 98.3% of its 5-mers were absent from the sampled reference, giving a composite novelty score of 0.678.
A helical wheel analysis was also performed. Using the Eisenberg scale24, NeKtar-1 scored really low (µH = 0.092), well below the ~0.35 amphipathic threshold. In addition, the high glycine content (6 of 19 residues, or 32%) interferes with the regular folding pattern needed to form a helix25. With a GRAVY score of −0.537 and the lack of a distinct hydrophobic face, it is likely that NeKtar-1 does not fold into a typical amphipathic helix26. Rather, we believe that because of the net +5 charge, NeKtar-1 is able to bind electrostatically to the negatively charged bacterial membrane, and the tryptophan and phenylalanine residues hold it in place.
NeKtar-1 Demonstrates Selective Bactericidal Activity Against Gram-Negative Pathogens
Initial Host Range Screening
In the spot assays, NeKtar-1 cleared E. coli BL21, E. coli ATCC 35218, and P. aeruginosa ATCC 27853, but produced no clearing against A. baumannii, B. cereus, or S. pyogenes, and, as noted, no halos, consistent with a contact-dependent mechanism.
* E. coli ATCC 35218 carries TEM-1 beta-lactamase-mediated ampicillin resistance. B. cereus ATCC 4342 was reclassified as Bacillus tropicus by ATCC after experimental use; it was designated B. cereus at the time of use. S. pyogenes D471 is from the Lancefield Streptococcal Collection, Rockefeller University; it is not an ATCC strain.
| Strain | Gram Stain | Clearing Zone |
| E. coli BL21 | Negative | Yes |
| E. coli ATCC 35218 (TEM-1 beta-lactamase-mediated ampicillin resistance) | Negative | Yes |
| P. aeruginosa ATCC 27853 | Negative | Yes |
| A. baumannii ATCC 19606* | Negative | No |
| B. cereus ATCC 4342* | Positive | No |
| S. pyogenes D471 (Lancefield Streptococcal Collection, Rockefeller University)* | Positive | No |
Protocol Optimization Using E. coli BL21
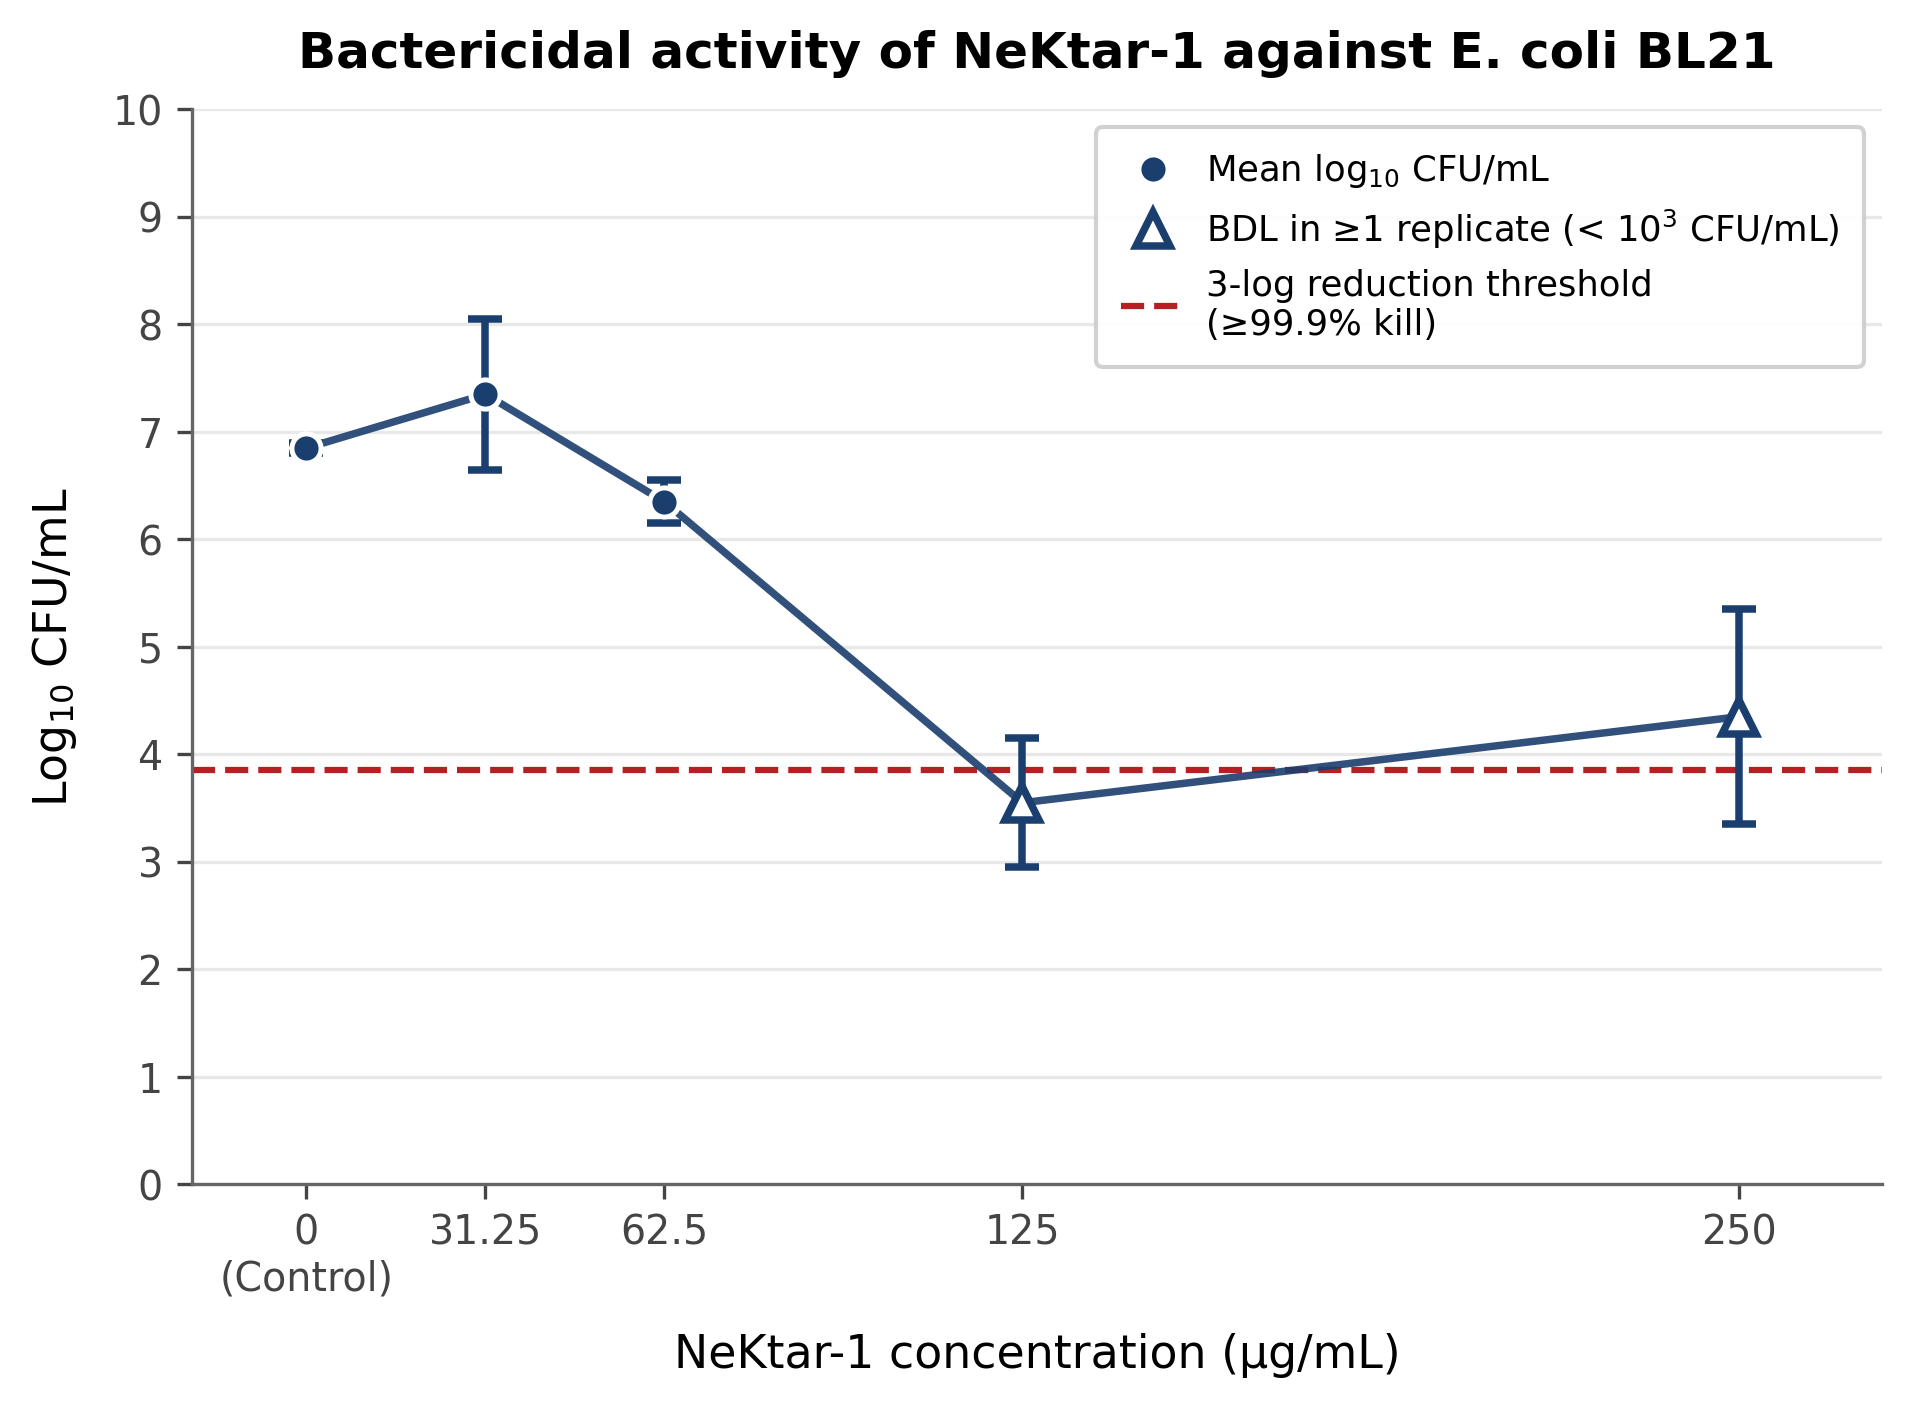
To establish our assay and verify our ability to get “killer” effects under our lab conditions before testing the real, low-supply ATCC strains, we tested NeKtar-1 against E. Coli BL21, a lab strain with a known, relatively permeable outer membrane and an excellent test subject for early AMP research. In repeated experiments with E. coli BL21, NeKtar-1 was found to cause dose-dependent cell death, with total eradication occurring at 250 or 125 µg/mL in a majority of cases (lower dose results were more erratic). These results are shown here as preliminary-formal endpoint experiments that utilized the clinical ATCC strains listed below.
Quantitative Bactericidal Activity Against Clinical Strains
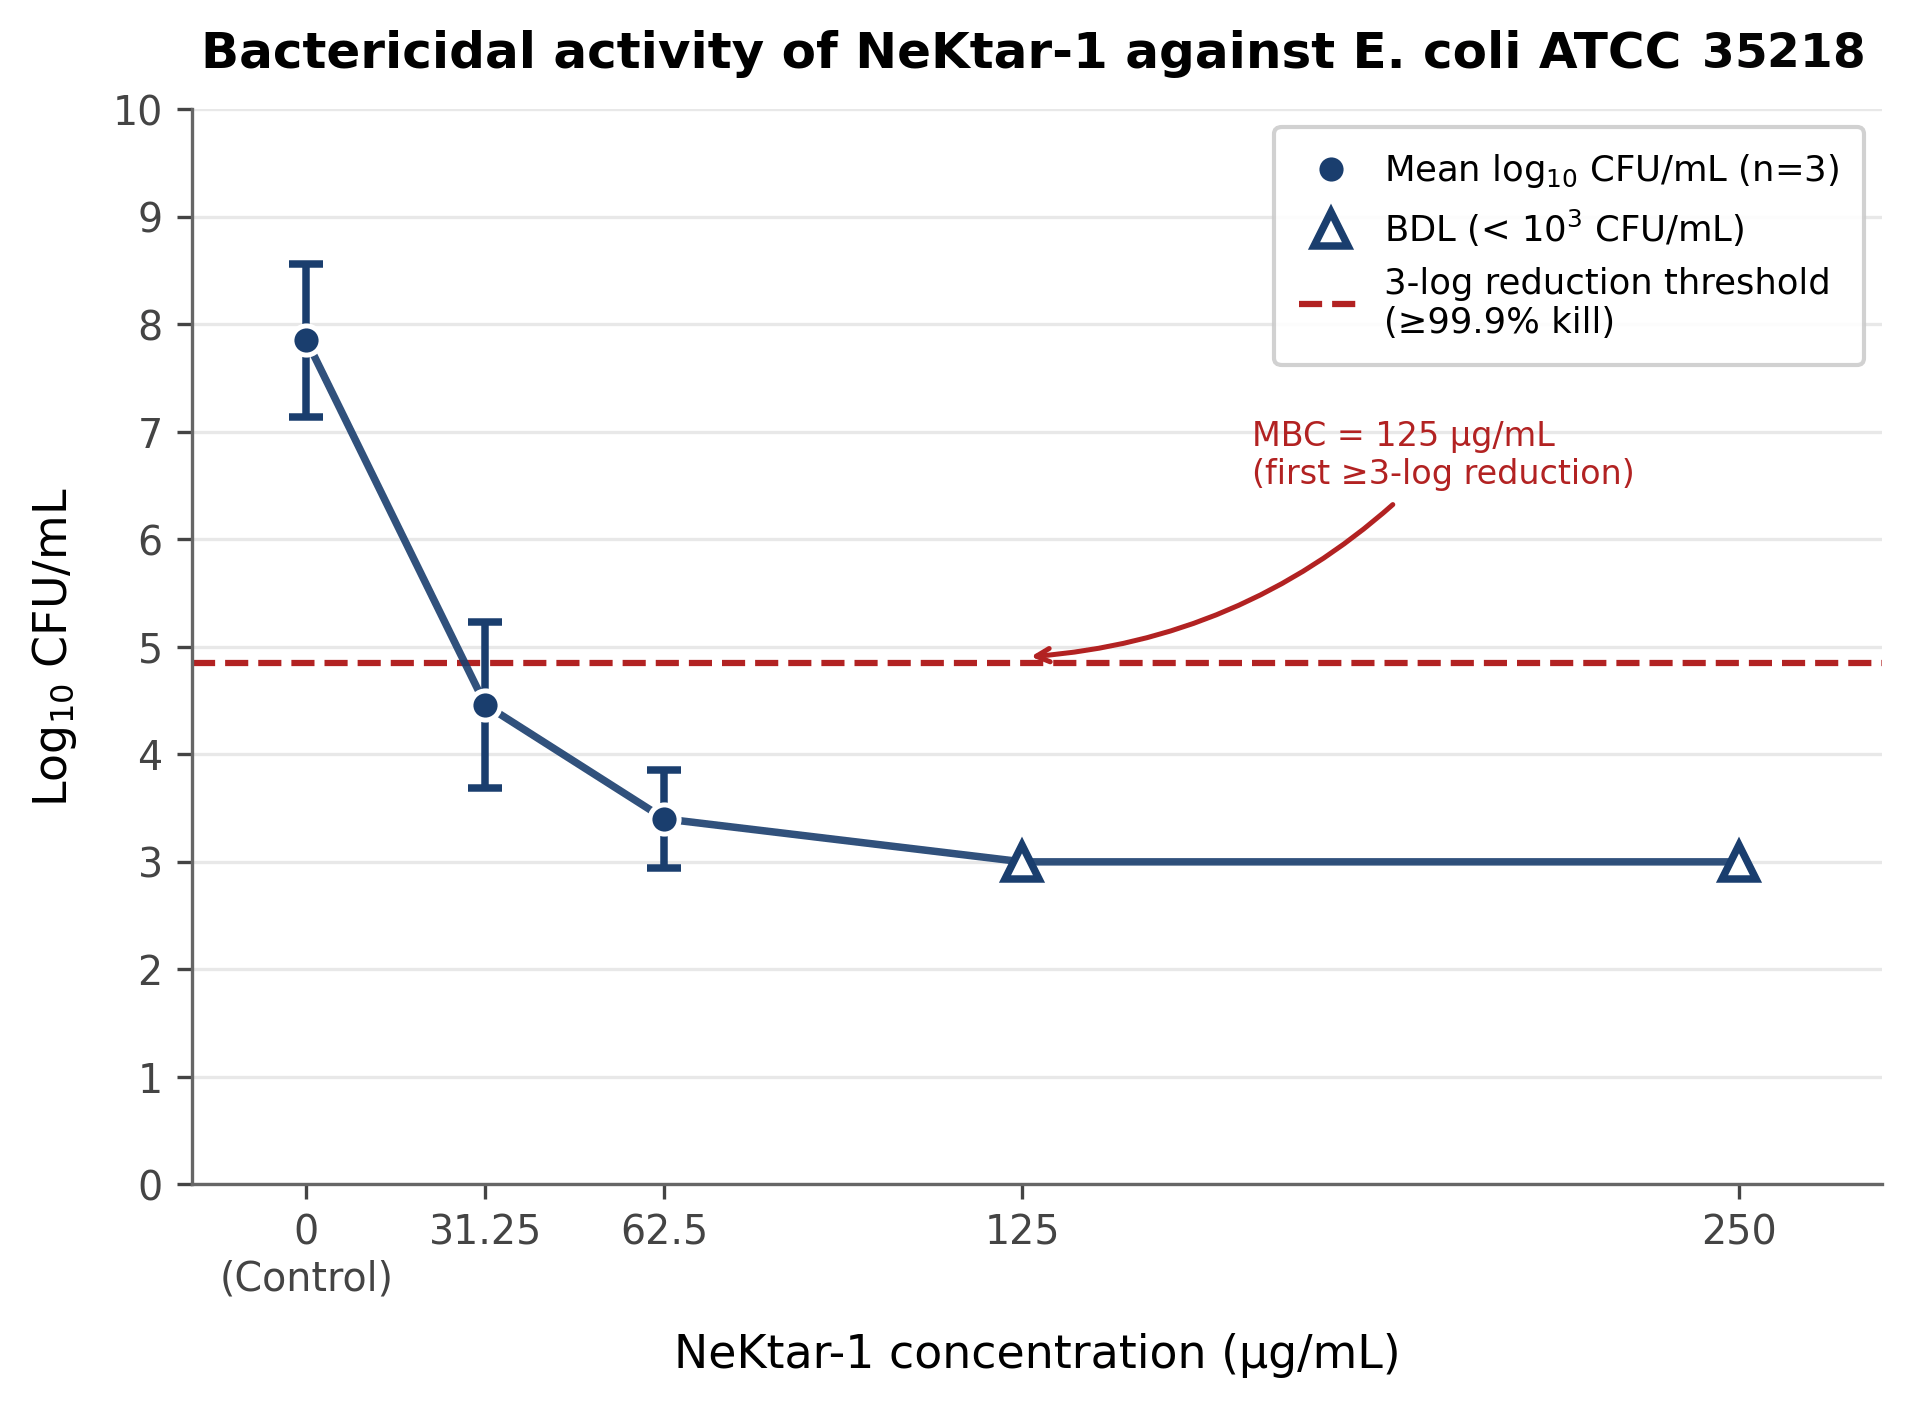
Preliminary validation studies were performed using the clinically relevant strains E. Coli ATCC 35218 and P. Aeruginosa ATCC 27853 on three biological replicates (n=3). In two of three replicates, the contamination appeared as separate raised, opaque, mucoid, orange colonies easily distinguishable from target colonies; these colonies were removed by morphology, and those plates were not re-analyzed. Against E. coli ATCC 35218, NeKtar-1 achieved greater than a 4.1-log reduction at both 250 and 125 µg/mL, starting from 1.2×10⁷ CFU/mL, corresponding to greater than 99.99% kill. Given the inter-replicate variability, we conservatively report the MBC against E. coli ATCC 35218 as 125 µg/mL. However, against P. aeruginosa ATCC 27853, NeKtar-1 was substantially more potent. It produced complete sterilization at all four concentrations from a starting density of 8.0×10⁷ CFU/mL, corresponding to greater than a 4.9-log reduction, and this was reproducible across all three replicates. Because sterility was reached at the lowest concentration tested, the MBC against P. aeruginosa ATCC 27853 was at or below 31.25 µg/mL, at least four times more potent than against E. coli.
Experimental Hemolysis Testing Reveals a Systematic Failure of Computational Prediction
Hemolytic Activity of NeKtar-1
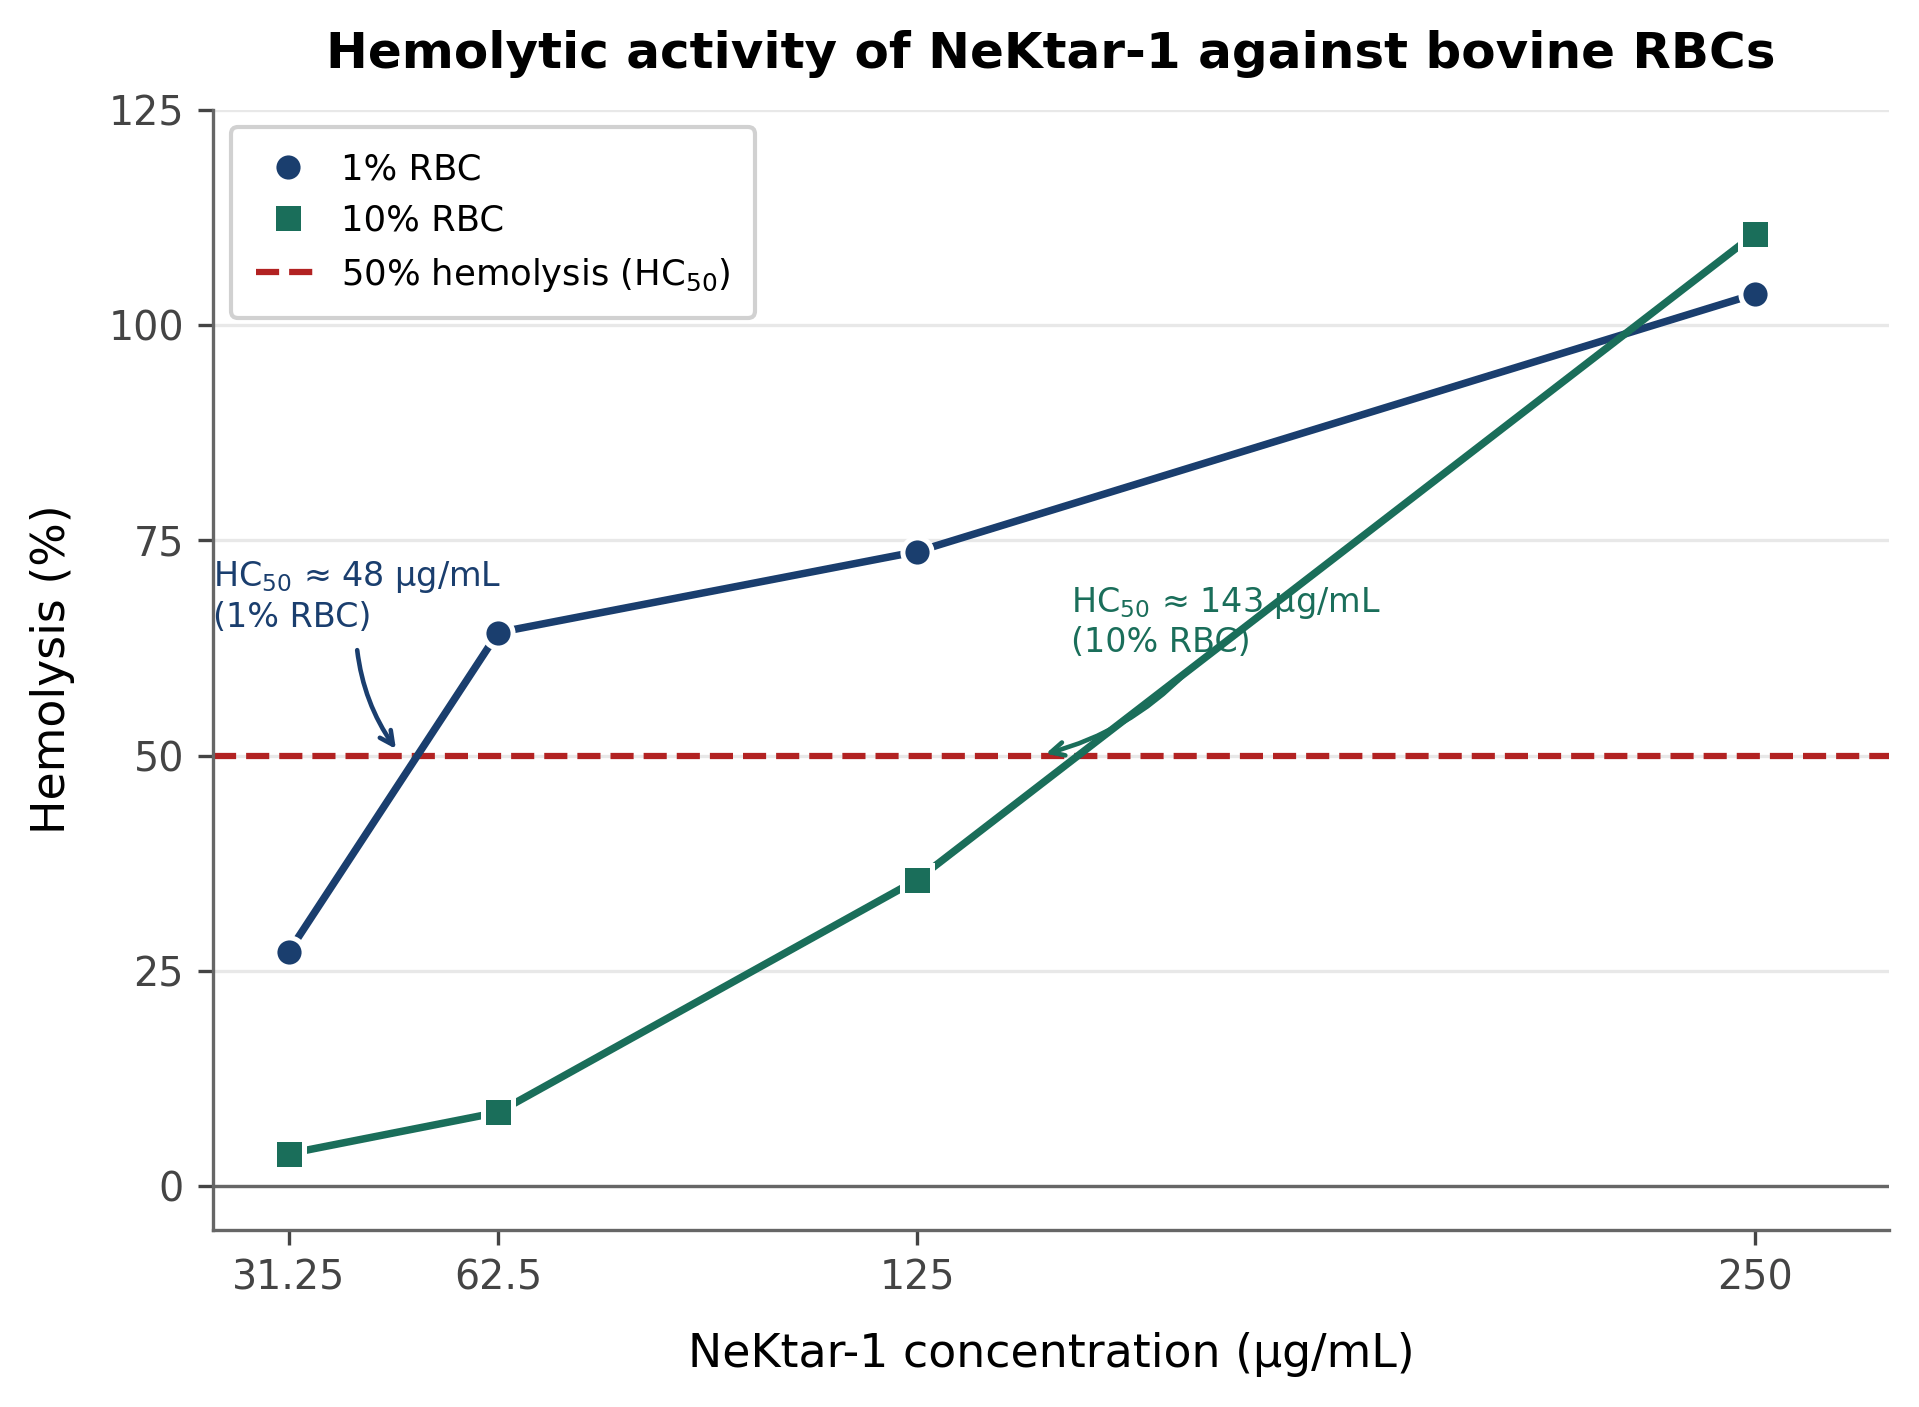
NeKtar-1 was initially a logical choice given our model predicting just 0.1 hemolysis, as it made the cut. In reality, however, NeKtar-1 was a potent hemolytic agent, showing increasing hemolysis as the dose at 1% RBC: 27.2%, 64.3%, 73.7% at 31.25, 62.5, and 125 µg/mL, respectively, and even 103.6% lysis at 250 µg/mL. This resulted in an HC50 value of approx 48 µg/mL (~22.6 µM given MW of 2122Da); above 100% denotes maximal lysis or light filtering artifact, so replication is advised as it is a single data point.
| NeKtar-1 Concentration (µg/mL) | Hemolysis at 1% RBC (%) | Hemolysis at 10% RBC (%) |
| 250 | 103.6 | 110.6 |
| 125 | 73.7 | 35.6 |
| 62.5 | 64.3 | 8.6 |
| 31.25 | 27.2 | 3.8 |
At 10% RBC, the effect was much gentler at lower doses (3.8% and 8.6%), pushing the HC50 up to about 143 µg/mL.
The resulting therapeutic index (HC50/MBC) was about 0.38 for E. coli and 1.5 for P. aeruginosa.
All Three Computational Hemolysis Prediction Tools Failed to Predict Hemolytic Activity
All three computed programs gave a classification of non-hemolytic for NeKtar-1; the custom model produced a risk score of 0.1, HemoPI 2.0 computed a predicted HC50 of approximately 113 µM (~240 µg/mL), and ToxinPred assigned an SVM score of -1.28. Our actual results, on the other hand, displayed the reverse; the computed HC50 in the actual experimental conditions resulted in a HC50 of roughly 22.6 µM, thus our experimental conditions indicate our peptide was more hemolytic than anticipated, thus implying a systemic failure as opposed to random error.
The key outcome of the tests was that our custom model (with 0.1 probability) and HemoPI 2.0 (which predicted an HC50 of 113 µM or 240 µg/mL) both gave “non-hemolytic” classifications, as did the machine learning tool ToxinPred, which reported a 1.28 score for the SVM and thus “non-toxic.” These predictions all failed by ~ 5fold in the opposite direction from the true experimental value of 22.6 µM. Since the result failed consistently across the 3 models, we must conclude it’s not a one-off error but a genuine deficiency in predicting hemolytic potency.
| Prediction Tool | Predicted HC50 | Classification | Experimental HC50 |
| Custom model (this study) | Risk score 0.1 | Non-hemolytic | ~22.6 µM (~48 µg/mL) |
| HemoPI 2.0 (Kumar et al., 2025) | ~113 µM (~240 µg/mL) | Non-hemolytic | ~22.6 µM (~48 µg/mL) |
| ToxinPred | SVM score −1.28 | Non-toxic | ~22.6 µM (~48 µg/mL) |
Discussion
Summary of Results
This study shows that a machine-learning pipeline can produce a novel, experimentally validated antimicrobial peptide. NeKtar-1 achieved greater than a 4.1-log reduction against E. coli ATCC 35218 and greater than a 4.9-log reduction against P. aeruginosa ATCC 27853, and it was Gram-negative selective. Our negative-sample results also found that DisProt negatives had their best performance regarding F1. However, the random sequence performed higher on the ROC-AUC scale (we cannot make this claim confidently as we did not run multi-seed statistics). Moreover, our hemolysis results managed to extract a blind spot in the field related to the nature of amphipathicity.
Species-Selective Activity Suggests Outer Membrane Composition as a Determinant of Susceptibility
NeKtar-1 kills Gram-negatives but not Gram-positives, which fits the mechanism of cationic AMPs: they are attracted electrostatically to the lipopolysaccharides on the Gram-negative outer membrane, which Gram-positive bacteria do not have7.
NeKtar-1 was about four times more potent against P. aeruginosa than against E. coli, likely because the lipopolysaccharides of P. aeruginosa carry greater negative charge, enhancing electrostatic attraction to the +5 peptide. The therapeutic index was also better against P. aeruginosa (1.5) than against E. coli (0.38).
Systematic Failure of Computational Hemolysis Prediction Points to an Amphipathicity Blind Spot
If we look a bit closer into the amphipathicity blind spot, it’s striking that the three independent methods we’ve tried (our model, HemoPI 2.0 and ToxinPred), which operate differently, both with different architectural choices and different datasets, make the same error. This suggests there is a possible fault in these tools. The reason why is likely that they work based on bulk features, like the GRAVY score, for example. While it may seem harmless to look at the GRAVY of NeKtar-1, it does not account for how the residues are placed in the sequence. A peptide can have an overall low average hydrophobicity, but with a significantly hydrophobic face that sticks into the membranes23. We recommend improving this by adding a feature representing either the amphipathicity or features for the secondary structure that are being predicted. Other neural tools, such as HAPPENN22 and AMPDeep23, could share the same limitation. Based on our findings, we also suggest that any computationally designed antimicrobial peptide should go through some sort of experimental testing.
Methodological Contributions and Recommendations
As a methodological suggestion, we propose that DisProt-based negatives are superior because they represent the most biologically plausible (real proteins and proteins with realistic composition), whereas shuffled sequences are non-biological and mixed sets send the wrong signals. We suspect that the same would hold for other protein-language-model binary classification problems. In addition, Sub-MBC tests against P. aeruginosa will be carried out to characterize NeKtar-1 in combination with the second version, NeKtar-2, which, from the beginning of design, allows amphipathicity calculations and validation of predicted hemolyses in large populations of peptides. We also compared NeKtar-1 to a known AMP, Magainin-2, which is well-studied and active against P. aeruginosa27. Magainin-2 has an MBC around 16 to 64 µg/mL, an HC50 in the hundreds of µg/mL, and a therapeutic index up to about 10, whereas NeKtar-1’s ≤31.25 µg/mL against P. aeruginosa is comparable in potency but its therapeutic index of about 1.5 is much lower and needs optimization. Reducing its hemolysis would raise that therapeutic index.
Limitations
There were multiple limitations in this study. First, the ranking of negative-sampling strategies is based on just one single train/test split and one random seed, with no cross-validation or confidence intervals. Doing more rounds of training and testing would help make this finding more solid. Secondly, the hemolysis measurements need additional repetition, as it was only done once. Third, activity was measured in PBS instead of something more like real body fluid or physiological media, and the k-mer novelty is estimated from a 500-sequence sample, so it is not exhaustive. Fourth, while usage of bovine RBCs are standard for early-stage work28, testing on human red blood cells could have yielded a more accurate representation of the peptide’s hemolysis activity. Fifth, there was no side-by-side comparison between NeKtar-1 and another existing AMP or antibiotic, and the length, charge, and hydrophobicity distributions were not matched across the negative sets. Finally, the 88.88% synthesis purity was adequate for this proof-of-concept but for future work, a purity of ≥95% would be more beneficial.
Closing Thought
For us, the takeaway message from all of this is the kill rate. Seeing NeKtar-1 kill E. coli and P. aeruginosa, even antibiotic-resistant ones, in a lab setting, is not just a prediction. We also want to highlight that hemolysis should come with caution. Many tools we tested classified NeKtar-1 as safe, but it wasn’t. It means the three tools put too much weight on just the number of charged and non-charged residues and don’t capture how the amino acids are packed in three dimensions. If that’s the case, designing peptides will need to build in amphipathicity from the beginning, as the spatial organization of the residues is so crucial to the function of AMPs that otherwise the model essentially just leaves it to chance.
Appendix
Appendix A. ESM-2 AMP Classifier Architecture
References
- M. Naghavi, et al. Global burden of bacterial antimicrobial resistance 1990-2021: a systematic analysis with forecasts to 2050. The Lancet. Vol. 404, pg. 1199-1226, 2024, https://doi.org/10.1016/S0140-6736(24)01867-1. [↩]
- C. J. L. Murray, et al. Global burden of bacterial antimicrobial resistance in 2019: a systematic analysis. The Lancet. Vol. 399, pg. 629-655, 2022, https://doi.org/10.1016/S0140-6736(21)02724-0. [↩]
- L. B. Rice. Federal funding for the study of antimicrobial resistance in nosocomial pathogens: no ESKAPE. J Infect Dis. Vol. 197, pg. 1079-1081, 2008, https://doi.org/10.1086/533452. [↩]
- C. D. Fjell, J. A. Hiss, R. E. Hancock, G. Schneider. Designing antimicrobial peptides: form follows function. Nature Reviews Drug Discovery. Vol. 11, pg. 37-51, 2012, https://doi.org/10.1038/nrd3591. [↩]
- C. L. Ventola. The antibiotic resistance crisis: part 1: causes and threats. P&T. Vol. 40, pg. 277-283, 2015. [↩]
- R. E. W. Hancock, H. G. Sahl. Antimicrobial and host-defense peptides as new anti-infective therapeutic strategies. Nat Biotechnol. Vol. 24, pg. 1551-1557, 2006, https://doi.org/10.1038/nbt1267. [↩]
- K. A. Brogden. Antimicrobial peptides: pore formers or metabolic inhibitors in bacteria? Nature Reviews Microbiology. Vol. 3, pg. 238-250, 2005, https://doi.org/10.1038/nrmicro1098. [↩] [↩] [↩] [↩]
- K. Sidorczuk, P. Gagat, F. Pietluch, J. Kała, D. Rafacz, L. Bąkała, J. Słowik, R. Kolenda, S. Rödiger, L. C. H. W. Fingerhut, I. R. Cooke, P. Mackiewicz, M. Burdukiewicz. Benchmarks in antimicrobial peptide prediction are biased due to the selection of negative data. Briefings in Bioinformatics. Vol. 23, bbac343, 2022, https://doi.org/10.1093/bib/bbac343. [↩]
- Y. Wan, et al. Discovering highly potent antimicrobial peptides with a deep generative model and automated high-throughput screening. Nature Reviews Bioengineering. 2024, https://doi.org/10.1038/s44222-024-00152-x. [↩]
- J. Huang, Y. Xu, Y. Xue, Y. Huang, X. Li, X. Chen, Y. Xu, D. Zhang, P. Zhang, J. Zhao, J. Ji. Identification of potent antimicrobial peptides via a machine-learning pipeline that mines the entire space of peptide sequences. Nature Biomedical Engineering. Vol. 7, pg. 797-810, 2023, https://doi.org/10.1038/s41551-022-00991-2. [↩]
- J. Yan, J. Cai, B. Zhang, Y. Wang, D. F. Wong, S. W. I. Siu. Recent progress in the discovery and design of antimicrobial peptides using traditional machine learning and deep learning. Antibiotics. Vol. 11, pg. 1451, 2022, https://doi.org/10.3390/antibiotics11101451. [↩]
- E. F. Haney, S. K. Straus, R. E. W. Hancock. Reassessing the host defense peptide landscape. Front Chem. Vol. 7, pg. 43, 2019, https://doi.org/10.3389/fchem.2019.00043. [↩]
- G. Wang, X. Li, Z. Wang. APD3: the antimicrobial peptide database as a tool for research and education. Nucleic Acids Research. Vol. 44, pg. D1087-D1093, 2016, https://doi.org/10.1093/nar/gkv1278. [↩]
- X. Kang, F. Dong, C. Shi, S. Liu, J. Sun, J. Chen, H. Li, H. Xu, X. Lao, H. Zheng. DRAMP 2.0, an updated data repository of antimicrobial peptides. Scientific Data. Vol. 6, pg. 148, 2019, https://doi.org/10.1038/s41597-019-0154-y. [↩]
- F. Quaglia, et al. DisProt in 2022: improved quality and accessibility of protein intrinsic disorder annotation. Nucleic Acids Research. Vol. 50, pg. D480-D487, 2022, https://doi.org/10.1093/nar/gkab1082. [↩]
- Z. Lin, H. Akin, R. Rao, B. Hie, Z. Zhu, W. Lu, N. Smetanin, R. Verkuil, O. Kabeli, Y. Shmueli, A. Dos Santos Costa, M. Fazel-Zarandi, T. Sercu, S. Candido, A. Rives. Evolutionary-scale prediction of atomic-level protein structure with a language model. Science. Vol. 379, pg. 1123-1130, 2023, https://doi.org/10.1126/science.ade2574. [↩]
- A. Vaswani, N. Shazeer, N. Parmar, J. Uszkoreit, L. Jones, A. N. Gomez, Ł. Kaiser, I. Polosukhin. Attention is all you need. Advances in Neural Information Processing Systems. Vol. 30, pg. 5998-6008, 2017. [↩]
- J. Kyte, R. F. Doolittle. A simple method for displaying the hydropathic character of a protein. J Mol Biol. Vol. 157, pg. 105-132, 1982, https://doi.org/10.1016/0022-2836(82)90515-0. [↩]
- Clinical and Laboratory Standards Institute. M07-Ed12: methods for dilution antimicrobial susceptibility tests for bacteria that grow aerobically, 12th edition. 2024. [↩]
- A. S. Rathore, N. Kumar, S. Choudhury, N. K. Mehta, G. P. S. Raghava. Prediction of hemolytic peptides and their hemolytic concentration. Communications Biology. Vol. 8, pg. 176, 2025, https://doi.org/10.1038/s42003-025-07615-w. [↩]
- S. Gupta, P. Kapoor, K. Chaudhary, A. Gautam, R. Kumar, Open Source Drug Discovery Consortium, G. P. S. Raghava. In silico approach for predicting toxicity of peptides and proteins. PLoS ONE. Vol. 8, e73957, 2013, https://doi.org/10.1371/journal.pone.0073957. [↩]
- P. B. Timmons, C. M. Hewage. HAPPENN is a novel tool for hemolytic activity prediction for therapeutic peptides which employs neural networks. Scientific Reports. Vol. 10, pg. 10869, 2020, https://doi.org/10.1038/s41598-020-67701-3. [↩] [↩]
- M. Salem, A. Keshavarzi Arshadi, J. S. Yuan. AMPDeep: hemolytic activity prediction of antimicrobial peptides using transfer learning. BMC Bioinformatics. Vol. 23, pg. 389, 2022, https://doi.org/10.1186/s12859-022-04952-z. [↩] [↩] [↩]
- D. Eisenberg, R. M. Weiss, T. C. Terwilliger. The hydrophobic moment detects periodicity in protein hydrophobicity. Proc Natl Acad Sci USA. Vol. 81, pg. 140-144, 1984, https://doi.org/10.1073/pnas.81.1.140. [↩]
- T. Wieprecht, M. Dathe, E. Krause, M. Beyermann, W. L. Maloy, D. L. MacDonald, M. Bienert. Modulation of membrane activity of amphipathic, antibacterial peptides by slight modifications of the hydrophobic moment. FEBS Lett. Vol. 417, pg. 135-140, 1997, https://doi.org/10.1016/s0014-5793(97)01266-0. [↩]
- A. Giangaspero, L. Sandri, A. Tossi. Amphipathic alpha helical antimicrobial peptides. Eur J Biochem. Vol. 268, pg. 5589-5600, 2001, https://doi.org/10.1046/j.1432-1033.2001.02494.x. [↩]
- M. Zasloff. Antimicrobial peptides of multicellular organisms. Nature. Vol. 415, pg. 389-395, 2002, https://doi.org/10.1038/415389a. [↩]
- I. Greco, N. Molchanova, E. Holmedal, H. Jenssen, B. D. Hummel, J. L. Watts, J. Håkansson, P. R. Hansen, J. Svenson. Correlation between hemolytic activity, cytotoxicity and systemic in vivo toxicity of synthetic antimicrobial peptides. Sci Rep. Vol. 10, pg. 13206, 2020, https://doi.org/10.1038/s41598-020-69995-9. [↩]