Abstract
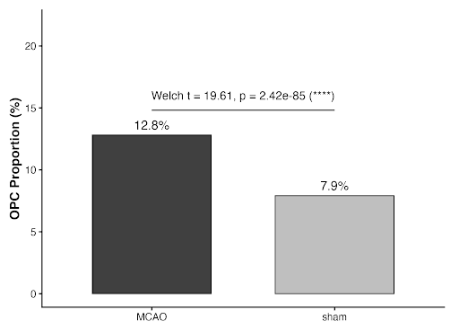
The glial scar that forms after ischemic injury creates a structurally and functionally complex barrier, yet how it regulates neural stem cell (NSC) fate remains unclear. I combined single-cell RNA sequencing reanalysis of a mouse model with middle cerebral artery occlusion (MCAO) with in vitro experiments using iPSC-derived NSCs to examine astrocyte-NSC interactions. Computational analysis revealed a reduction in NSC populations alongside increased oligodendrocyte progenitor cells post-injury. I hypothesized that reactive astrocytes in the glial scar, specifically pro-inflammatory astrocyte states, promote NSC fate shifting towards an OPC-like phenotype. Reactive astrocytes are key scar components, traditionally classified as A1 (neurotoxic) or A2 (neuroprotective). Cell-cell communication analysis identified TNFα, a pro-inflammatory cytokine secreted around the scar, to be a significant signaling molecule between NSCs and A1 astrocytes upregulated after injury. In vitro, NSCs co-cultured with A1 astrocytes or exposed to A1-conditioned media (CM) increased expression of NG2+ oligodendrocyte precursor cell (OPC) markers, a cellular population that localizes to the scar periphery. TNFα alone similarly promoted this phenotype. A1 astrocytes were generated by stimulating homeostatic astrocytes with microglia-derived cytokines, leading to TNFα upregulation by reverse transcription quantitative polymerase chain reaction (RT-qPCR) and sustained secretion by enzyme-linked immunosorbent assay (ELISA). Only strongly stimulated astrocytes maintained elevated TNFα after one week, indicating a threshold-dependent feedback mechanism. In contrast, astrocytes stimulated under A2 conditions (TNFα + IL-1β) did not sustain TNFα secretion. Finally, pharmacological inhibition of astrocyte activation with dantrolene or salubrinal appeared to reduce TNFα release and expression, and abrogate its effect on NSCs. Together, these results support a model in which A1 reactive astrocytes influence NSC state and promote OPC-associated marker expression, with TNFα as a potential mediator. Additional lineage-tracing and loss-of-function experiments will be required to determine whether TNFα is necessary and sufficient for NSC fate conversion, and whether converted cells remain differentiated, localize to the site of the glial scar, and contribute to its function.
Introduction
In response to acute and chronic inflammation or insult to the central nervous system (CNS), a glial scar forms, a physical and biochemical barrier formed by reactive glial cells1. The main cell types surrounding the glial scar lesion are reactive astrocytes, reactive microglia, and a dense ring of OPCs2. They isolate infiltrating immune cells and remodel the extracellular matrix (ECM) to limit further injury3. However, the glial scar creates a neurotoxic environment over time. Able to persist for several months, the scar forms a physical and biochemical block to axon regeneration4. Detection of PAMPs (such as viral RNA or LPS) or DAMPs (such as ATP, misfolded proteins, or myelin debris) triggers microglia taking on a reactive phenotype characterized by a distinct inflammatory gene signature5,6 Pro-inflammatory M1 reactive microglia secrete cytokines such as TNFα, IL-1α, IL-1β, and C1q7, which trigger astrocytes to take on what has been traditionally simplified into two different reactive phenotypes8. While the A2 phenotype is neuroprotective, secreting neurotrophic factors like BDNF9, A1 astrocytes have been previously thought to have minimal if any beneficial functions. Alongside an impaired ability to carry out regulatory functions of homeostatic astrocytes such as lactate and glutamate regulation, A1 astrocytes are thought to secrete an unidentified compound10 that leads to neuronal cell death. Although the A1/A2 dichotomy overly simplifies a much larger continuum of reactive astrocytes states11,12, it remains a useful experimental framework for capturing broad patterns in major astrocyte responses to CNS injury and disease.
NSCs are self-renewing, multipotent cells with the potential to differentiate into astrocytes, oligodendrocytes and neurons13,14. As a result of their sensitivity to inductive signaling, they tend to occupy specialized niches in the brain with regulated microenvironments that allow them to preserve multipotency, such as the subventricular zone (SVZ) lining the lateral ventricles and the subgranular zone (SGZ) of the dentate gyrus of the hippocampus15. NSC differentiation during glial scar formation has previously been a relatively unexplored area of research. While it is accepted that inflammation generally results in NSCs forming a higher proportion of glial cells rather than neurons16, the primarily signaling pathways resulting in this preference is an ongoing angle for investigation.
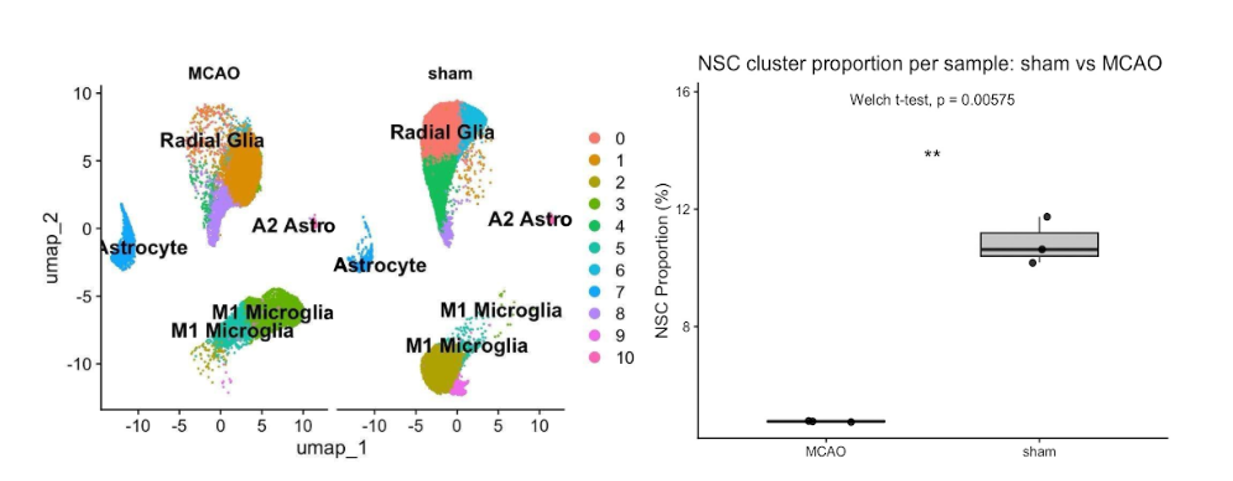
This project sought to address possible signaling molecules and cell types critical to directing NSC fate. Single-cell re-analysis of a murine model with a middle cerebral artery occlusion (MCAO) induced glial scar revealed a significant reduction in the number of NSCs in the aftermath of glial scar formation. This trend was consistent across multiple datasets, raising the question if NSCs were dying or being induced to differentiate, and what was the source of the inductive signal if they were specializing. Enrichment of other cell populations, particularly OPCs, supported the possibility of differentiation rather than cell death.
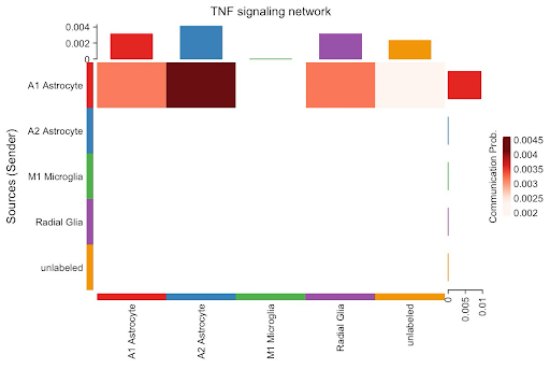
Upon examining key signaling pathways with NSCs as receivers, the TNFα signaling pathway between A1 reactive astrocytes and NSCs stood out to be significantly upregulated. This project examines the crucial interaction between A1 astrocytes and NSCs as the scar forms, contesting the notion that A1 astrocytes are purely detrimental and should be inhibited from formation17,18.
Dantrolene and salubrinal were used to dampen TNFα release in reactive astrocytes. These are inhibitors that converge on the endoplasmic reticulum (ER) stress signaling pathway. Dantrolene’s primary mechanism of action is stabilizing Ca2+ by blocking ryanodine receptors19,20, reducing pro-inflammatory PERK activation, while salubrinal inhibits eIF2α dephosphorylation when PERK is active to give the ER time to clear and refold proteins21.
Materials and Methods
Experiments were performed to test how factors secreted by M1 microglia and A1 astrocytes influence NSC differentiation. To further probe the interaction specifically between A1 astrocytes and NSCs, NSCs were given TNFα in isolation, incubated with CM from reactive astrocytes, and co-cultured in direct contact with reactive astrocytes. Cell lineage was cross-validated through both immunofluorescence microscopy (IF) and RT-qPCR.
Single-cell RNA-seq reanalysis
Publicly available single-cell RNA-seq data from a mouse MCAO model (3 sham, 3 MCAO; GSE174574) were processed in Seurat. Cells with <200 or >6,000 detected genes, as well as cells with >5% mitochondrial gene expression, were excluded. Data were log-normalized (NormalizeData), highly variable genes identified (FindVariableFeatures), and scaled (ScaleData). Elbow plots were generated to select the number of principal components to be 17 for principal component analysis (PCA). Graph-based clustering was performed using FindNeighbors (k = 15, dimensions 1-17) followed by FindClusters (resolution = 0.6). Clusters were annotated using established markers (log fold-change ≥ 0.5; ≥ 30% expressing cells). Cell-type proportions between conditions were compared using Welch’s t-tests. For cell-cell communication, a CellChat object was created from normalized data and annotated cell types. Ligand-receptor interactions were inferred using the mouse database and filtered to retain pairs with ≥ 10% expression in sender or receiver populations, then aggregated into signaling pathways for communication probability analysis.
| Marker genes | Cell type |
| Aqp4, Gfap, Aldh1l1 | Astrocytes |
| Mbp, Plp1, Mog | Oligodendrocytes |
| Pdgfra, Sox10, NG2 | OPCs |
| Snap25, Syt1, Rbfox3 | Neurons |
| Cx3cr1, Tmem119, P2ry12 | Microglia |
| Pecam1, Cldn5 | Endothelial cells |
| Foxj1, Dnah9 | Ependymal cells |
| Pdgfrb, Rgs5 | Pericytes |
| C3, Serpina3n, Vim, Lcn2, S100B | A1 Astrocytes |
| Emp1, Clcf1, Tgm1, Ptx3, S100a10 | A2 Astrocytes |
| Nes, Sox2, Prom1 | NSCs |
Experiment #1: NSCs + A1/A2 factors
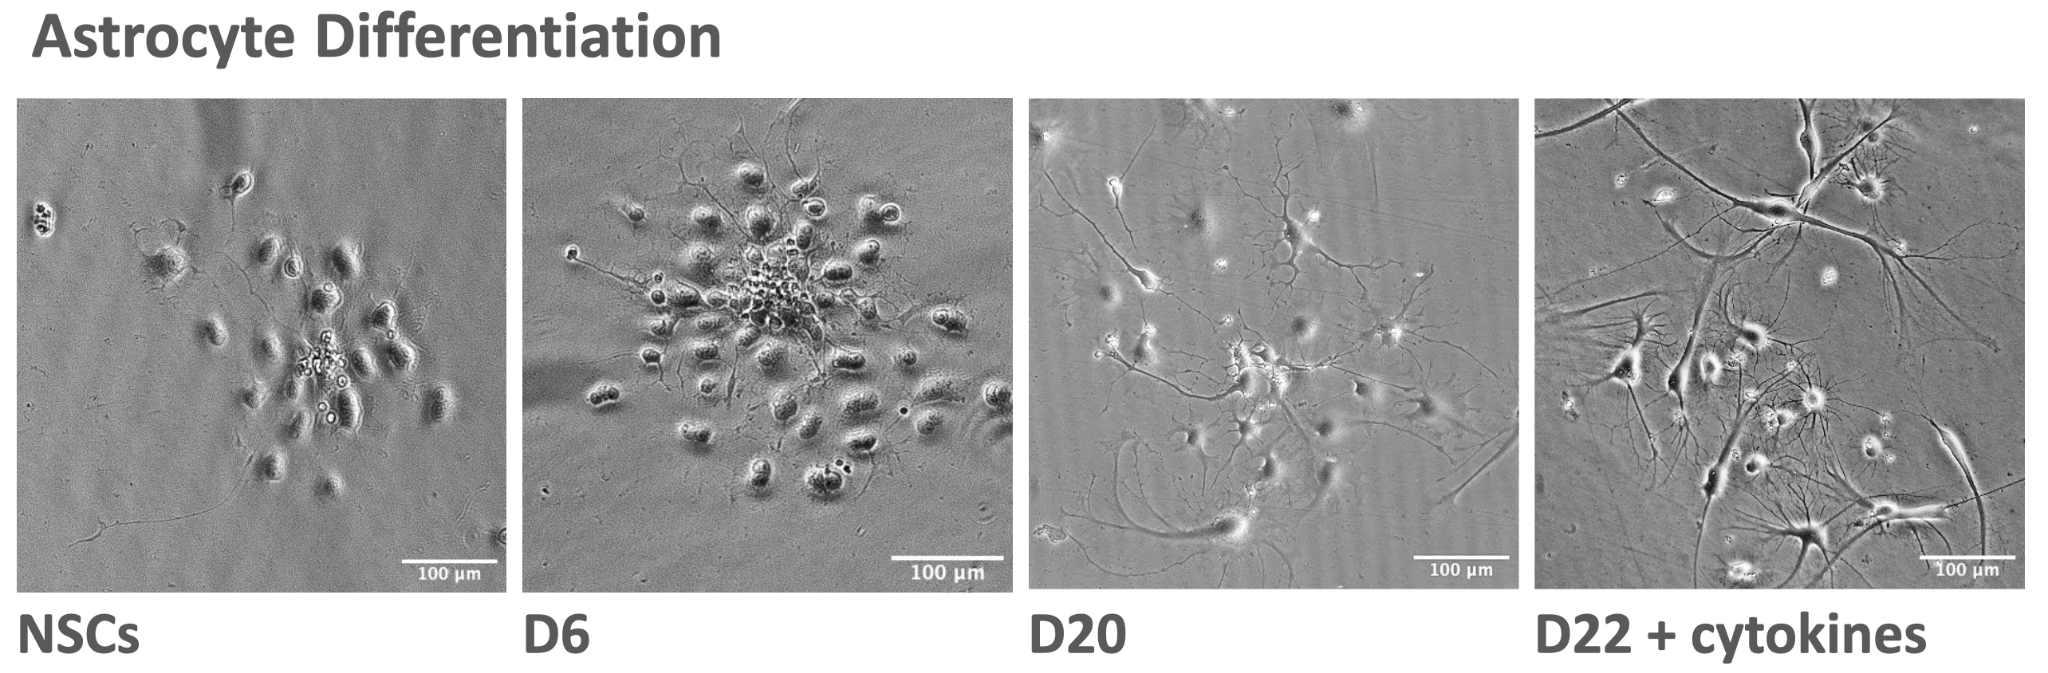
NSCs (ScTi003-A, STEMCELL Technologies) were grown in NSC maintenance media as floating neurospheres and passaged at >250 µm using Accutase. NSC identity was validated after two weeks through immunostaining on untreated cells, where >85% were found to be positive for a combination of NSC markers SOX2, Nestin, PAX6, and PROM1 while lacking robust expression of markers associated with neuronal or glial differentiation, such as βIII-tubulin, ALDH1L1, O4, MAP2, NEUN, OLIG2 and SOX10.
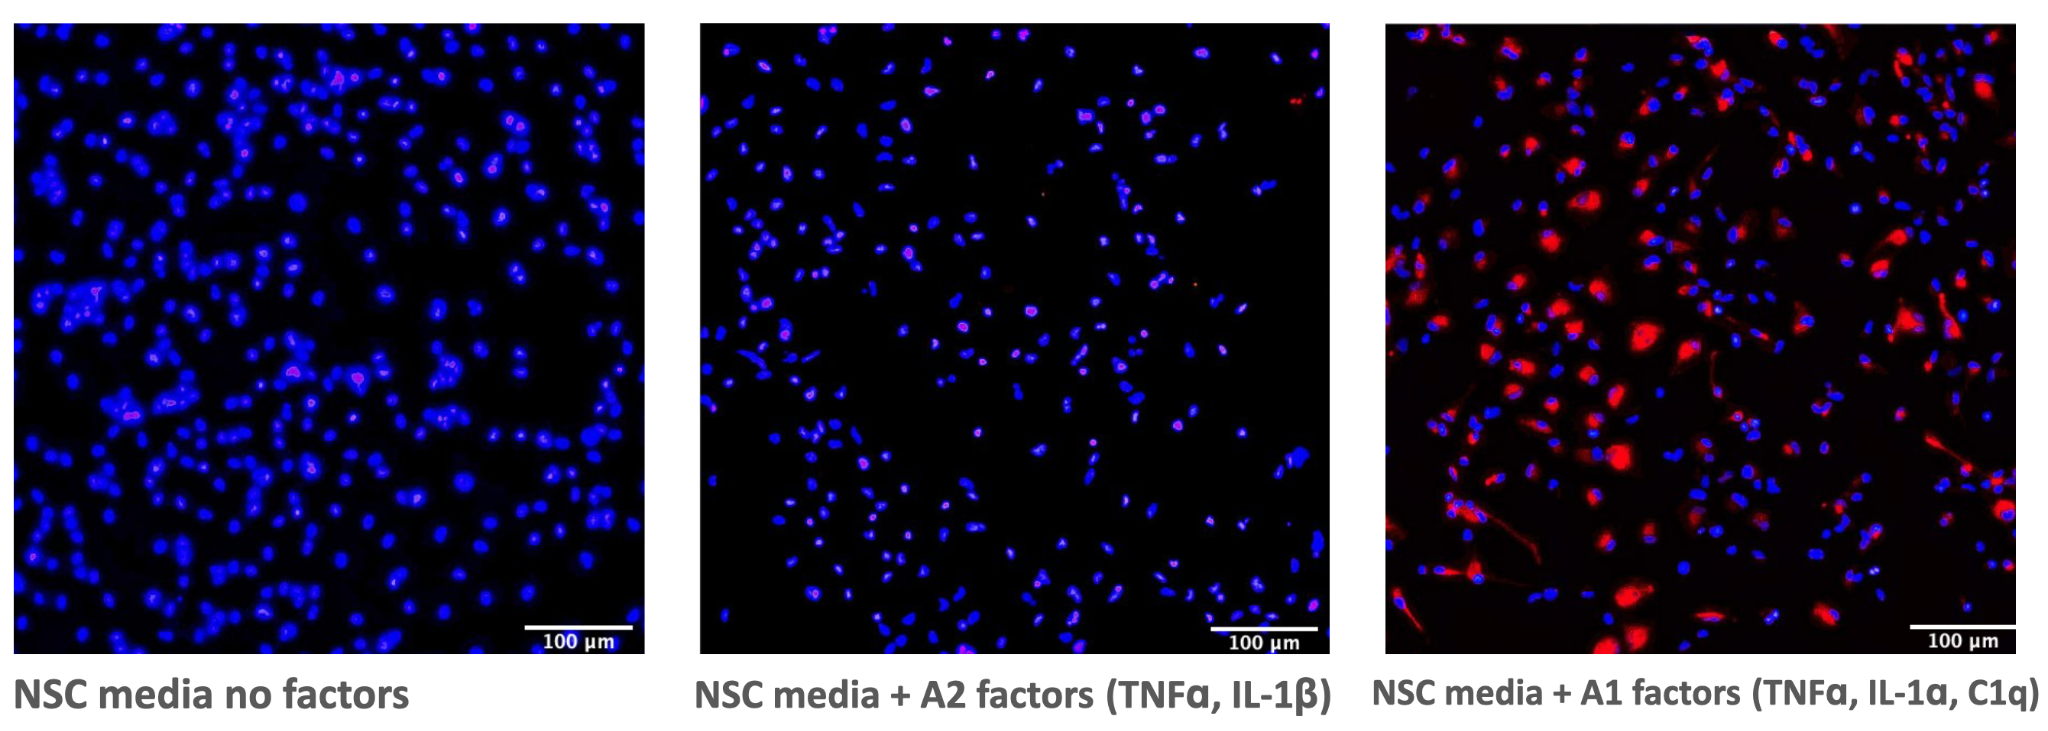
To test the combinations of cytokines released during glial scar formation on NSCs, NSCs were plated on Matrigel at a seeding density of 10k cells per well in 4 rows on a 96-well plate. After 24 h, cells were treated with A1 factors (TNFα, IL‑1α, C1q) or A2 factors (IL‑1β, TNFα). Two control rows were maintained in either NSC medium or blank differentiation medium. After 48 h, factors were removed and cells were washed 8x with PBS, then differentiated for 2 weeks.
To IF, cells were fixed in 4% PFA (15 min), incubated in blocking buffer (1 h 45 min), incubated with primary antibodies overnight at 4°C, then secondary antibodies at room temperature (3 h). 4’,6-diamidino-2-phenylindole (DAPI) was added to stain the nuclei in a 1:1000 dilution with staining buffer. Wells were washed 2 times and imaged on a LeicaLasX microscope.
Experiment #2: NSCs + individual factors
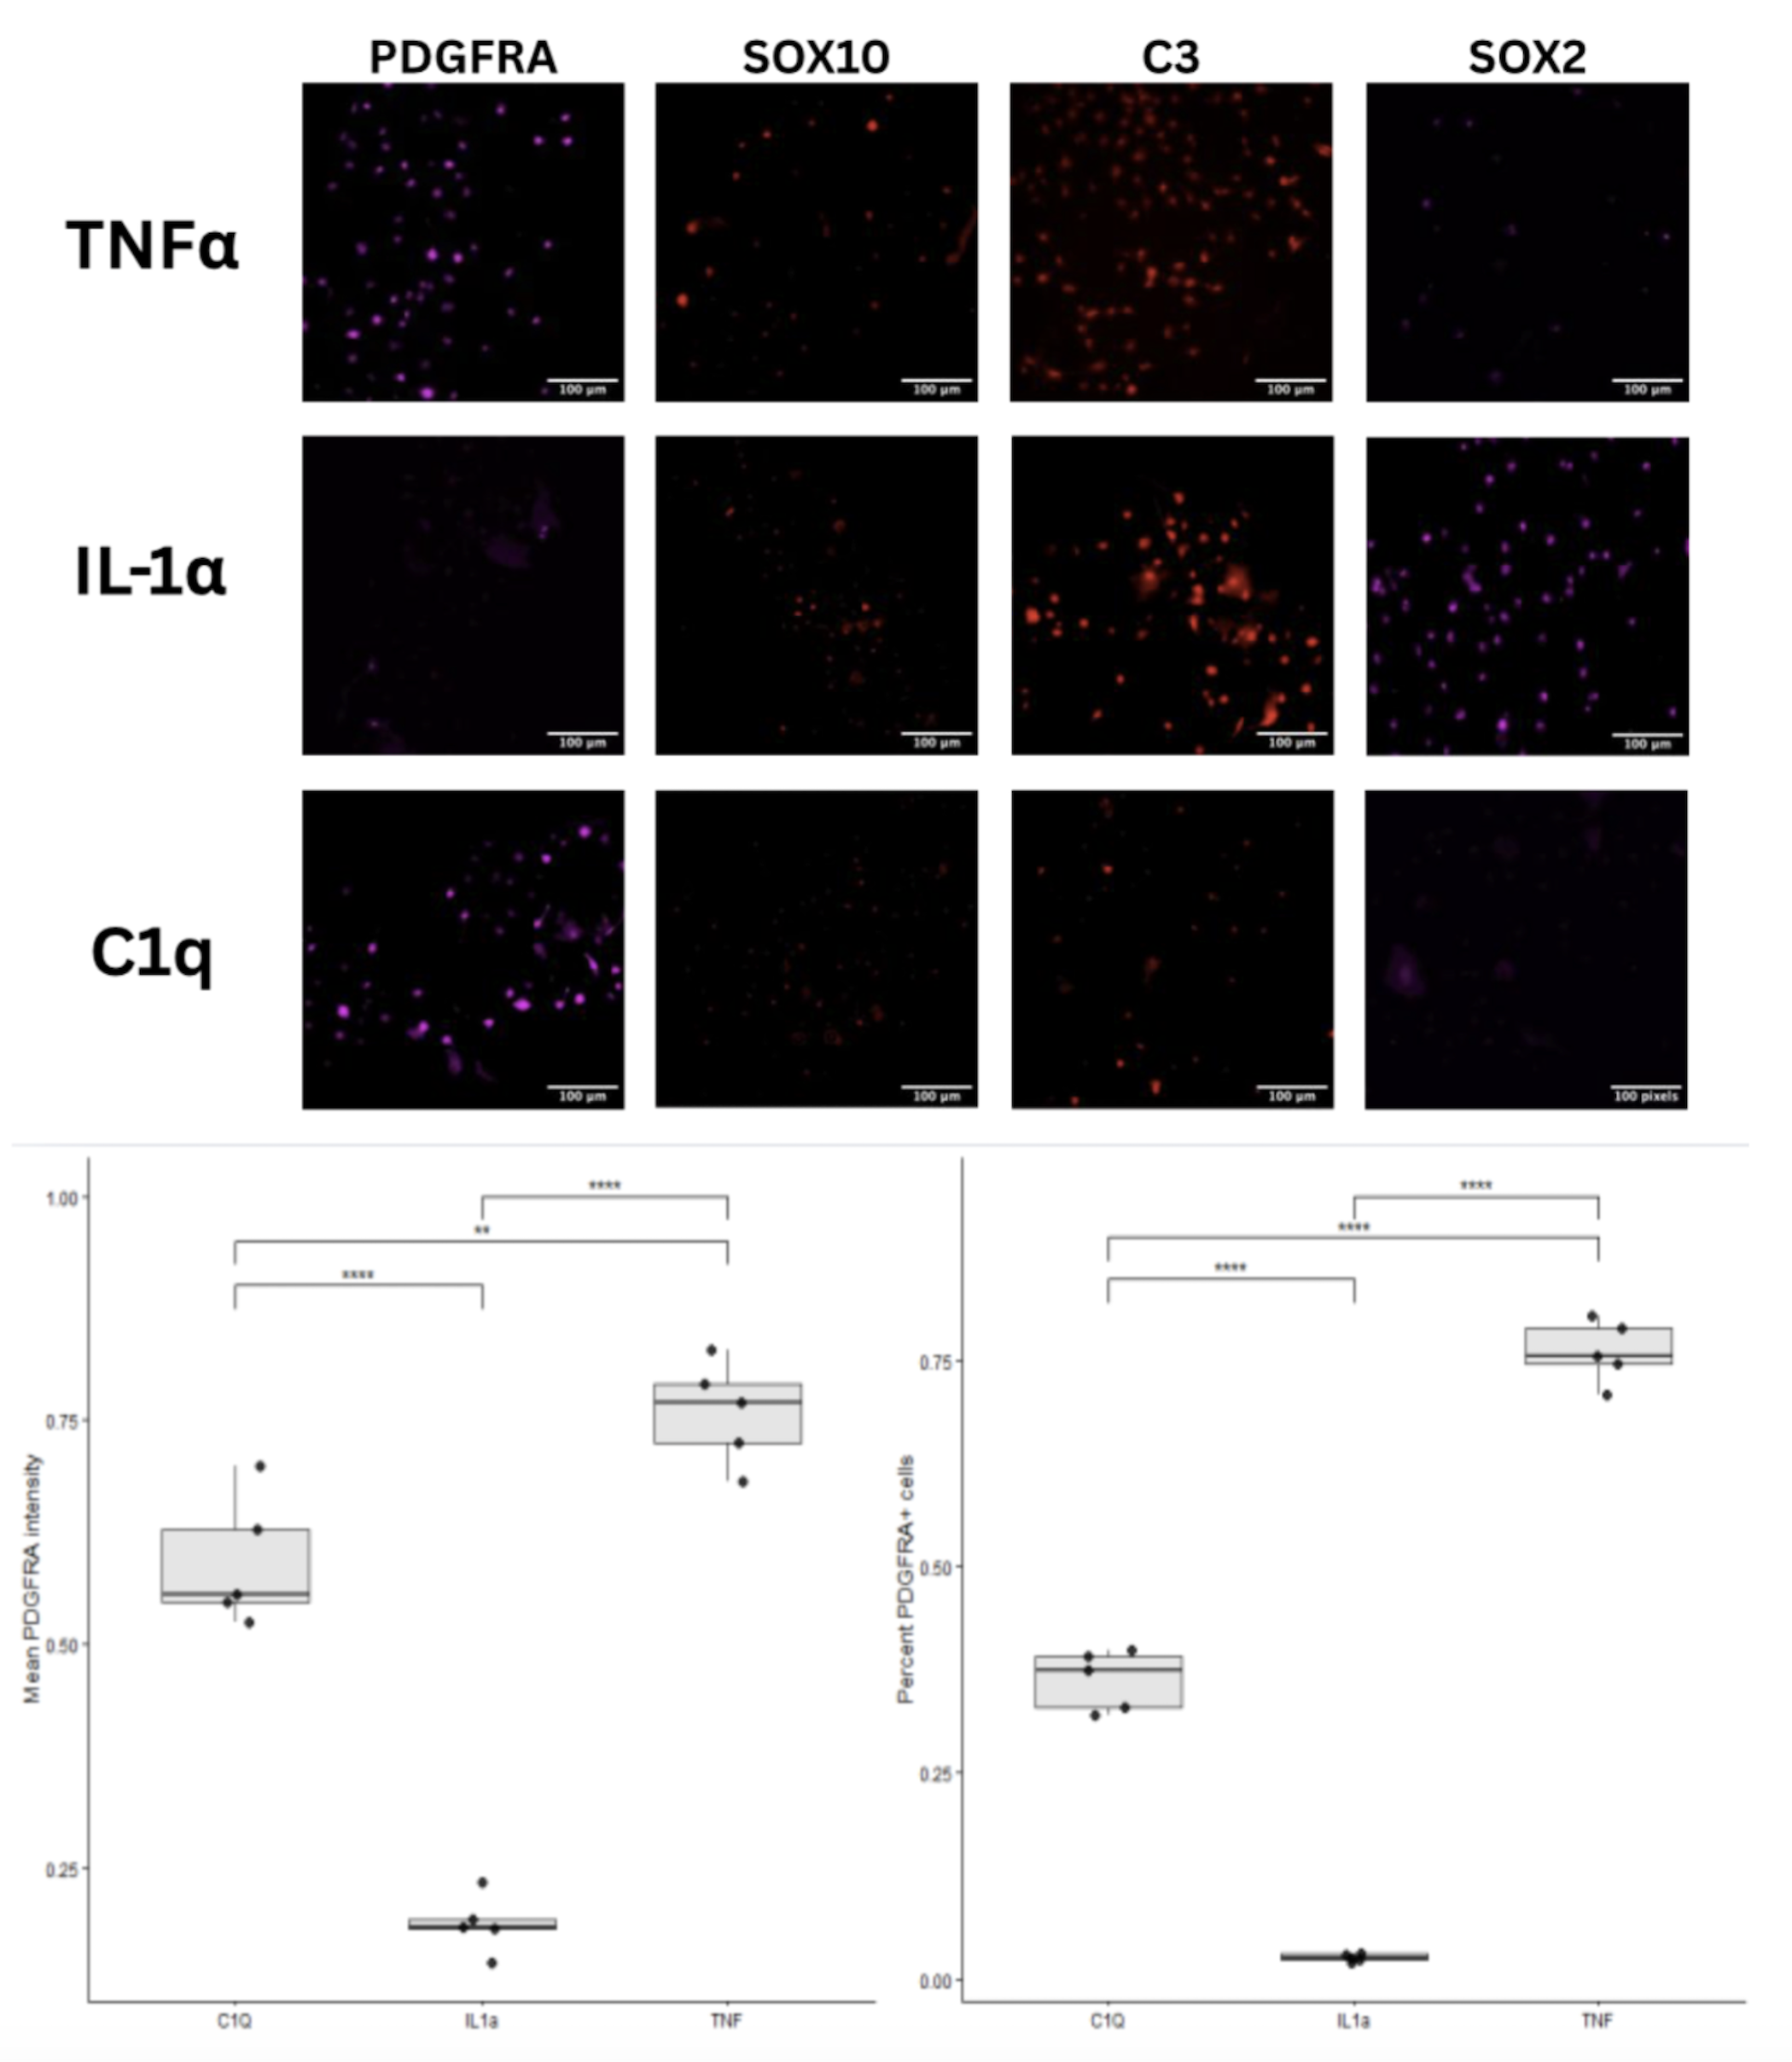
A1 factors were tested individually. NSCs were plated in five rows on a 96-well plate. One row received TNFα, one row IL-1α, and one row C1q. After 48 h of incubation with the cytokines, wells were washed 8x with PBS and media was replaced with normal NSC media. After 2 weeks, NSCs were fixed and stained.
Experiment #3: TNFα release by reactive astrocytes
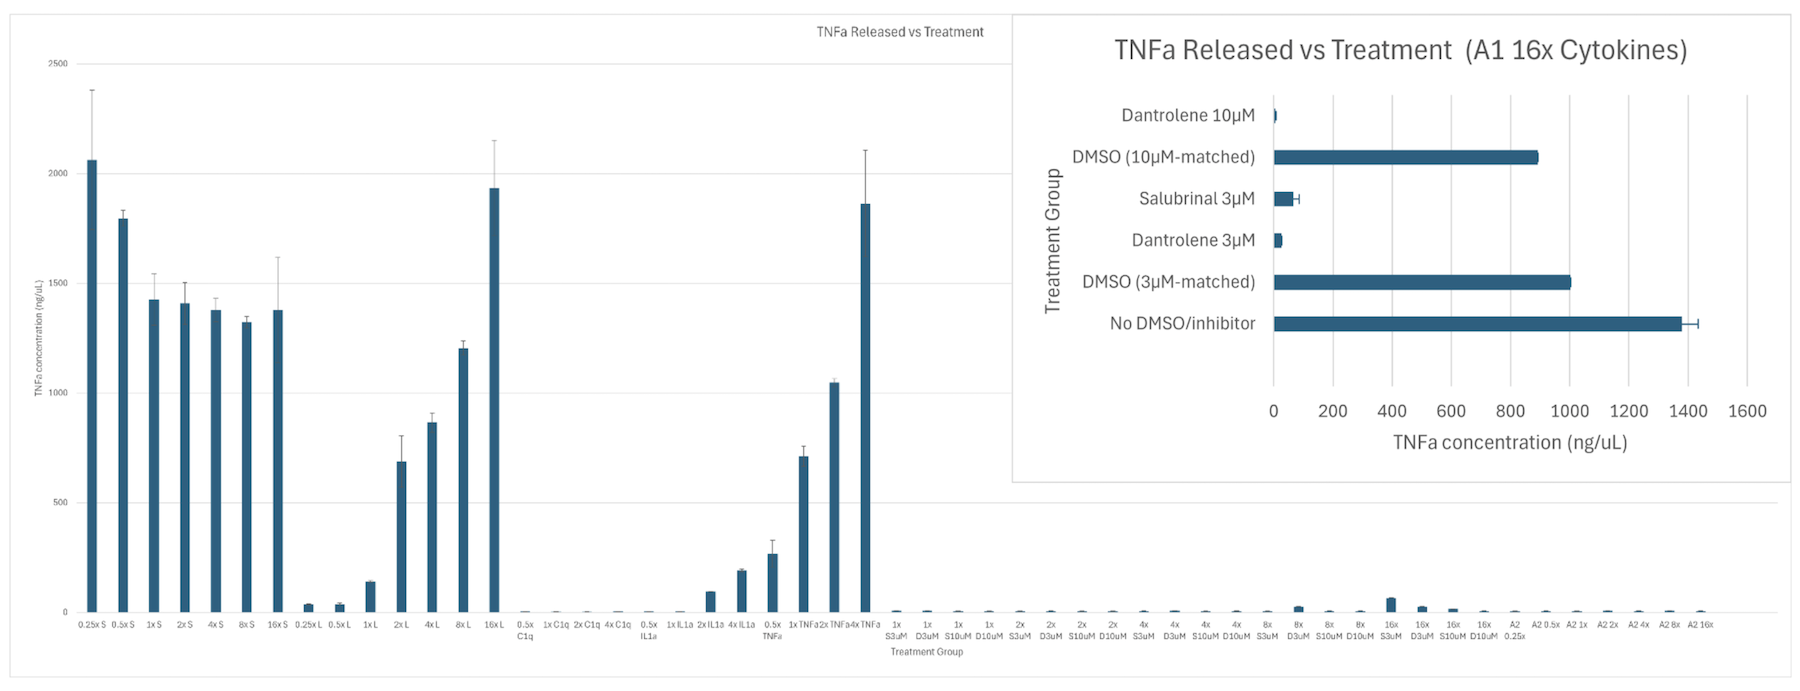
Homeostatic, A1, and A2 reactive astrocytes were generated. Astrocytes were administered activating cytokines on a range of concentrations, using a serial dilution to test cytokine concentrations of 0.25x, 0.5x, 1x, 2x, 4x, 8x, and 16x. The 1x concentration was 30 ng/mL for TNFα, 3 ng/mL for IL-1α, 30 ng/mL for IL-1β, and 400 ng/mL for C1q, mimicking the protocol used by Liddelow et al. (2017) for generating reactive astrocytes in vitro.
Activation with individual factors was also tested. Titration experiments comparing 4, 6, 8, and 10 PBS washes showed that in acellular Matrigel plates that received the same range of TNFα concentrations, 8 washes eliminated any traces of recombinant TNFα to below the threshold detectable by the ELISA kit, supporting that the TNFα later measured was endogenous rather than residual. Furthermore, a trypan blue live-dead count showed that astrocyte cultures subjected to 8 PBS washes maintained >90% viability. Dantrolene and salubrinal were dissolved in DMSO and applied at 3µM or 10µM to A1 astrocytes for 24 h after factor removal; vehicle controls received an equivolume DMSO. Wells were then washed 8x with PBS, returned to fresh astrocyte media, and CM was collected after 24 h and again after 7 days.
CM from all treatment groups was analyzed using a Human TNF alpha ELISA Kit (Invitrogen, KHC3013).
Experiment #4: NSCs + astrocyte CM
NSCs were plated on Matrigel in a 24-well plate and differentiated into astrocytes for 2 weeks with BMP4 and CNTF. Astrocytes were then activated with A1 or A2 factors, with homeostatic astrocytes as controls. After 5 days, factors were removed and some A1 astrocytes received 3µM or 10µM of dantrolene or salubrinal for 24 h, followed by 8x PBS washes and replacement with NSC media. After 24 h, CM was collected and 180 μL per well was applied to NSCs plated in Matrigel in a 96-well plate. NSCs were left to differentiate for 6 days, then fixed and stained or collected for RT-qPCR. rNA was extracted using the QIAGEN RNeasy kit, quantified by NanoDrop (typically 100 ng/μL, with acceptable 260/280 ratios) and reverse-transcribed with the High-Capacity RNA-to-cDNA kit (Thermo Fisher). RT-qPCR was then performed using PowerTrack 2x SYBR Green Master Mix. 3.5 μL of cDNA, 2 μL of indicator dye, and 29.5 μL of ultra-pure water were added to a total volume of 35 μL. Primers were prepared by adding 8 μL forward primer, 8 μL reverse primer, and 84 μL of ultra-pure water. 17.5 μL of the diluted primers were added to 175 μL SYBR Green and 122.5 μL of ultra-pure water before combined with cDNA to a 384-well plate. The ThermoCycler protocol was 37°C for 60 minutes, 95°C for 5 minutes, and 4°C for 30 minutes.
Experiment #5: NSCs + astrocyte co-culture
NSCs were transfected with a GFP⁺ lentivirus and co-cultured with homeostatic, A1, or A2 reactive astrocytes. Astrocytes were activated for 5 days, washed 8x with PBS, and then seeded with NSCs at a 1:1 ratio (10,000 cells each) in 96-well plates in NSC media. After 6 days, co-cultures were separated for downstream analysis using Flow Cytometry, gating for GFP⁺ NSCs versus GFP- astrocytes.
NSC process complexity was quantified in ImageJ. A binary mask of all cell processes was created and skeletonized. Then, the GFP-nuclear channel was examined to delete ROIs that lacked a GFP⁺ nucleus. Running AnalyzeSkeleton on the remaining skeletons yielded a Results table reporting the number of branches and average branch length per skeleton.
Image Quantification and Statistical Analysis
All experiments were performed with three independent biological replicates. For IF, ten fields of view were acquired per well and averaged to yield the image-based quantifications presented for each biological replicate. Cells were identified based on DAPI staining, and binary masks (minimum object size of 20 µm², circularity 0.3-1.0) were used to quantify the percentage of positive cells and mean fluorescence intensity per cell. Images were set to the same minimum and maximum intensity before comparison.
Error bars represent standard deviation. Two-tailed Welch’s t-tests were used for comparisons between two groups, while comparisons between more than two groups used one-way ANOVA with Tukey’s post-hoc test. P-values of <0.05 were determined to be significant.
| Astrocyte media | NSC media |
| PVA 90% 480 μL NAC 100x 480 μL Neurobasal (L glutamine) 24 mL DMEM / F12 (1:1) 24 mL N2 Supplement 480 μL B27 (Vit-A) 960 μL hEGF 48 μL ITSX Insulin 480 μL | DMEM/F12 500 ml Neurobasal 500 μL N2 5 mL B27 (50x) 20 mL Glutamax 10 mL Penn Strep 10 mL hEGF(20 ug/mL) 1 mL FGF2(20 ug/mL) 1 mL |
| Blocking Buffer | Staining Buffer |
| 5 mL 3% Triton X-100 1.5 mL horse serum 43.5 mL 1x TBS | 16.6 mL blocking buffer 33.4 mL 1x TBS |
| Blank differentiation media | Computational tools |
| DMEM/F12 500mL Neurobasal Medium 500mL GlutaMAX 10mL MEM-NEAA (100x) 10mL 2-mercaptoethanol 0.5mL N2 5mL B27 -VitA (50x) 20mL 2-p-L-AA (100x) 10mL | R Studio for single-cell sequencing, using datasets downloaded from NCBI ImageJ for editing immunofluorescence microscopy images and AnalyzeSkeleton to compare relative branch length between A1 and A2 astrocytes. |
| Target | Cell Type | Supplier | Product Code | Concentration |
| OLIG2 | OPC | Abcam | ab109186 | 1:500 |
| SOX10 | OPC | Abcam | ab227680 | 1:300 |
| C3 | A1 Astrocyte | Invitrogen | PA5-114921 | 1:300 |
| S100A10 | A2 Astrocyte | Invitrogen | MA5-15326 | 1:500 |
| S100B | A1 Astrocyte | Abcam | ab52642 | 1:500 |
| Nestin | A1 Astrocyte, NSC | Abcam | ab22035 | 1:500 |
| SOX2 | NSC | Abcam | ab97959 | 1:500 |
| GFAP | NSC | Abcam | ab4674 | 1:5000 |
| PDGFRA | OPC | Abcam | ab203491 | 1:500 |
| Reagent | Use | Supplier | Catalogue Number |
| TNFα | A1 induction, A2 induction | GibcoTM | 300-01A-10UG |
| IL-1α | A1 induction | GibcoTM | 200-01A-2UG |
| IL-1β | A2 induction | GibcoTM | 200-01B-2UG |
| C1q | A1 induction | MilliporeSigmaTM | 20-487-61MG |
| BMP4 | Astrocyte differentiation | GibcoTM | PHC9534 |
| CNTF | Astrocyte differentiation | GibcoTM | 450-13-20UG |
| Dantrolene | TNFα release inhibition | Selleck Chemicals® | E4902 |
| Salubrinal | TNFα release inhibition | Thermo ScientificTM Chemicals | J64192.LB0 |
| QIAGEN RNeasy kit | RNA extraction | QIAGENTM | 74104 |
| High-Capacity RNA-to-cDNA kit | cDNA synthesis | Applied BiosystemsTM | 4387406 |
| PowerTrack 2x SYBR Green Mix | RT-qPCR | Applied BiosystemsTM | A46109 |
| Human TNFα ELISA Kit | TNFα quantification | InvitrogenTM | KHC3013 |
| Human iPSC-derived Neural Progenitor Cells (SCTi003-A) | Neural progenitor cells for experimentation and astrocyte differentiation | STEMCELLTM Technologies | 200-0620 |
Results
Experiment #1: NSCs + A1/A2 factors
After two weeks of differentiation, A1-treated NSCs exhibited a significantly higher proportion of C3⁺ cells (68.3% ± 6.1%) than control (5.4% ± 1.8%) or A2-treated cells (7.1% ± 2.3%) (one-way ANOVA with Tukey’s post hoc test, p < 0.001***). Most C3⁺ cells (72.5% ± 5.8%) were also PDGFRA⁺ of C3⁺ cells were also PDGFRA⁺, and exhibited increased branching phenotypically characteristic of the dense, fibrous web around the site of the glial scar.
Experiment #2: NSCs + individual factors
TNFα-treated NSCs upregulated OPC-associated markers relative to IL-1α or C1q. TNFα-treated NSCs exhibited both higher PDGFRA mean fluorescence intensity (0.758 ± 0.036 vs. 590 ± 0.032 for C1q and 0.187 ± 0.014 for IL-1α ) and a greater fraction of PDGFRA⁺ cells (0.761 ± 0.017 vs 0.363 ± 0.016 and 0.026 ± 0.002 respectively; one-way ANOVA with Tukey post hoc, all p < 0.01**). In contrast, IL-1α-treated NSCs showed low PDGFRA and SOX10 but robust expression of A1-associated markers GFAP and C3, with SOX2 expression restricted to this group.
Experiment #3: TNFα release by reactive astrocytes
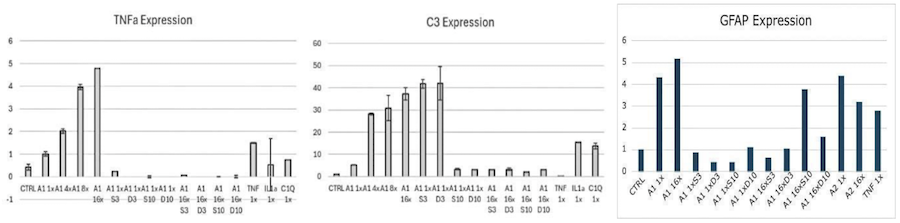
Astrocytes stimulated with the highest cytokine concentrations exhibited the most sustained release of TNFα after 7 days. Out of the astrocytes that had received TNFα, IL-1α, or C1q alone only the group that had received TNFα demonstrated significant TNFα release after 24 h as well as after a week. However, A2 astrocytes given TNFα and IL-1β in combination did not release TNFα. Dantrolene and salubrinal reduced TNFα release by ELISA and TNFα mRNA and other A1-associated inflammatory markers by RT-qPCR.
Experiment #4: NSCs + astrocyte CM
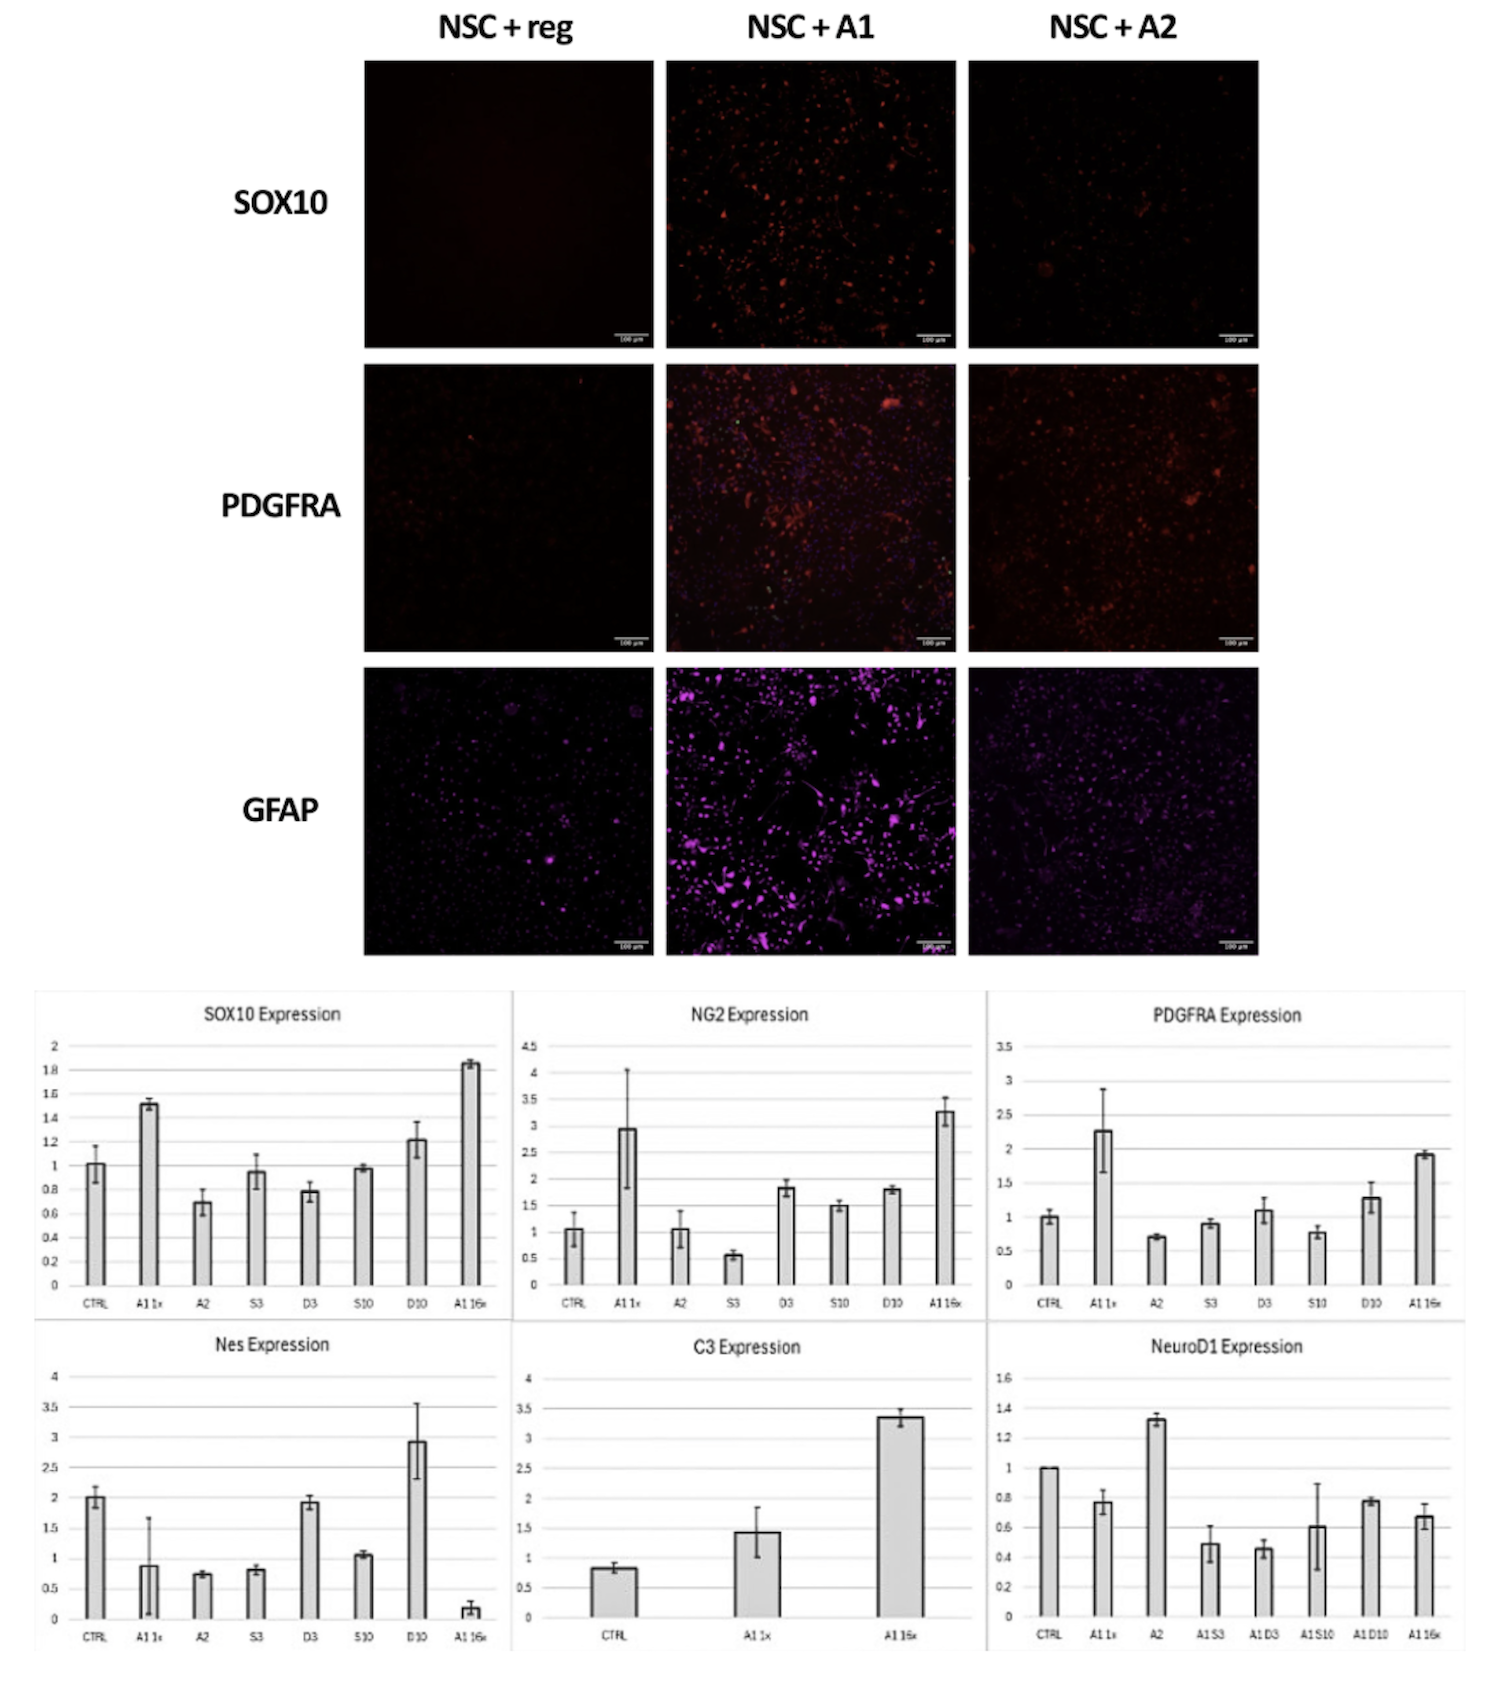
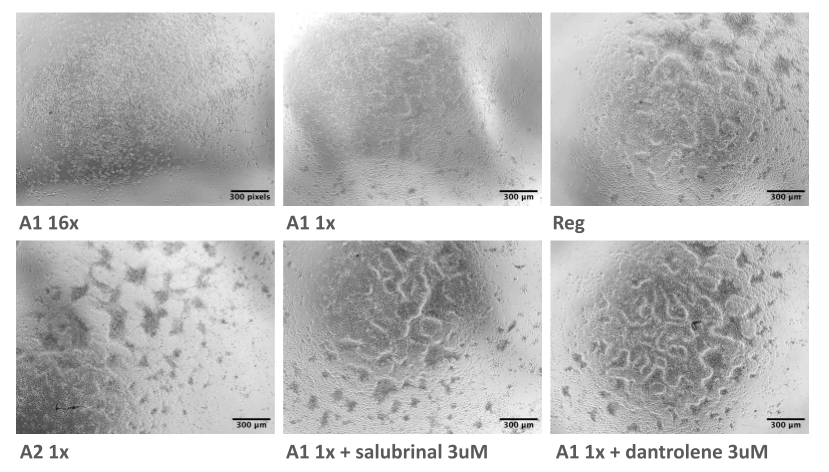
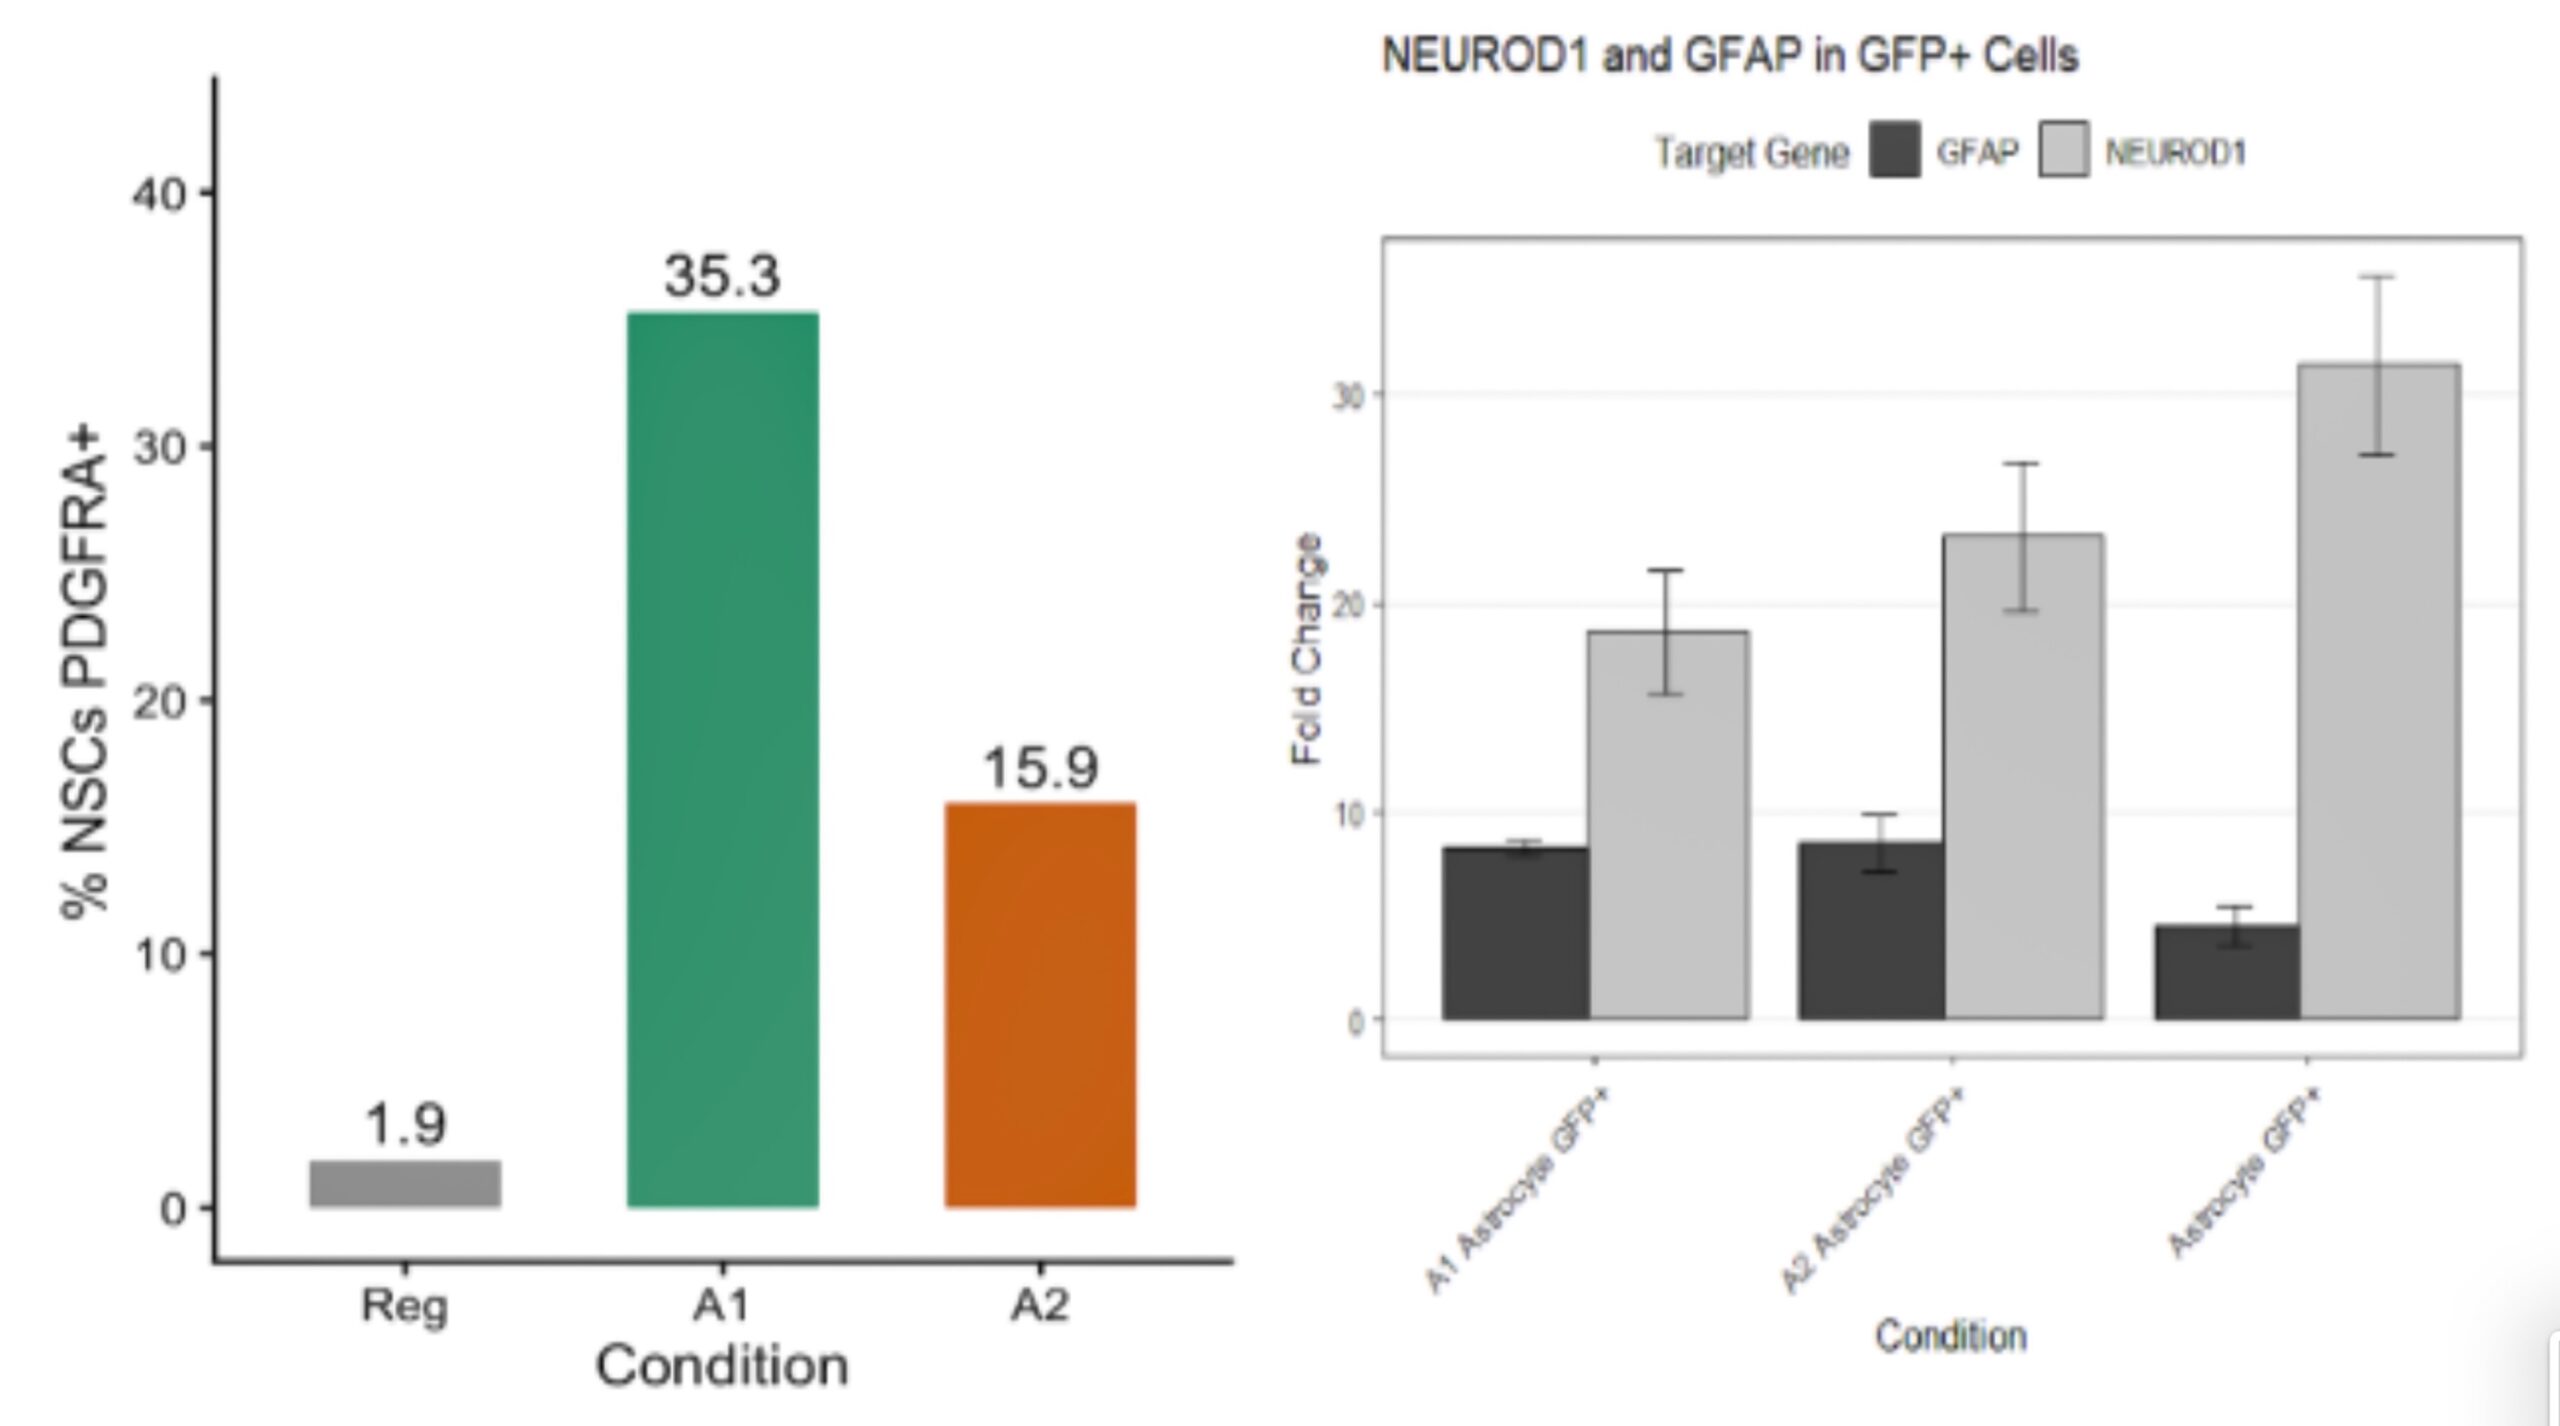
A1 astrocyte CM increased PDGFRA⁺ NSCs (58.9% ± 6.0%) compared to homeostatic CM (9.6% ± 3.8%) and A2 CM (22.3% ± 4.1%) (p < 0.001***). SOX10⁺ cells similarly increased (54.1% ± 5.7% vs 7.2% ± 3.5% and 20.5% ± 3.9%, respectively). Mean fluorescence intensity for both markers increased by approximately 2-fold. CM from inhibitor-treated A1 astrocytes abrogated these effects, preserved multipotent markers, and allowed neurosphere-like aggregate formation.
Experiment #5: NSC + reactive astrocyte co-cultures
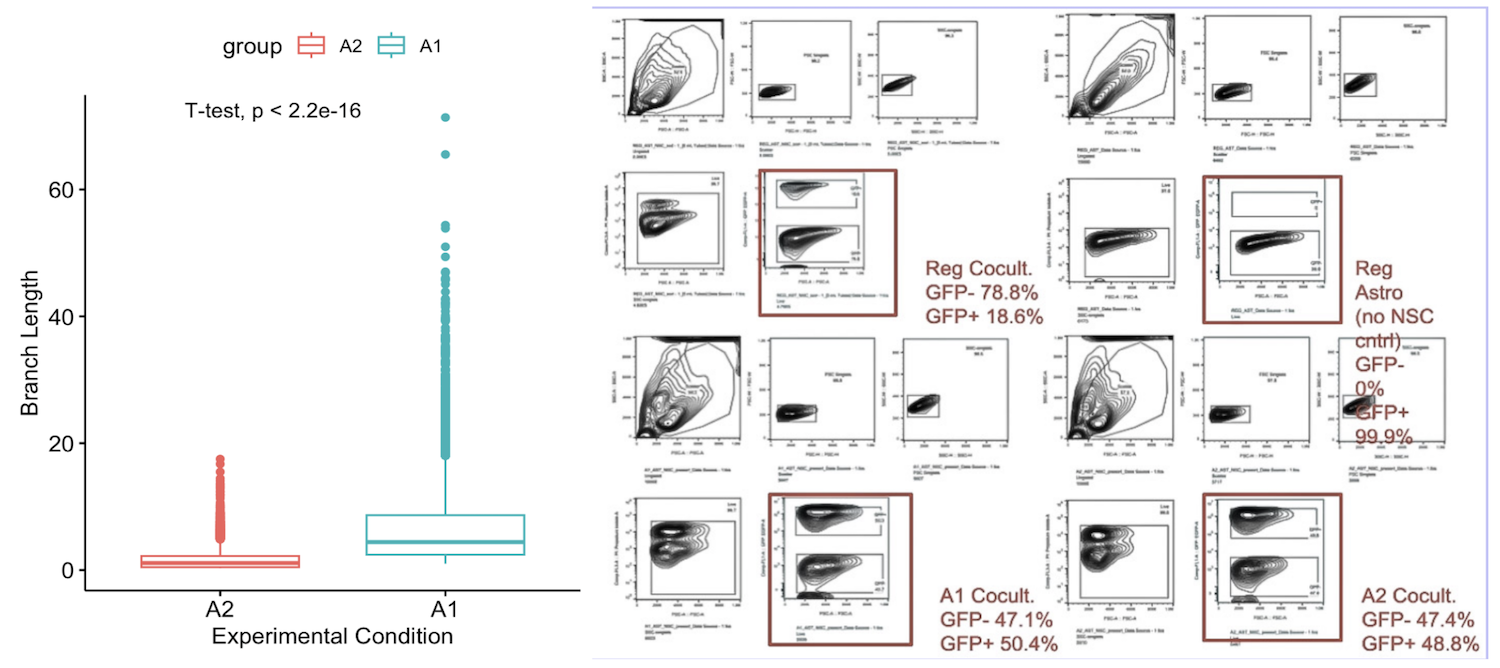
NSCs co-cultured with A1 astrocytes demonstrated increased proliferation, as shown by a higher percentage of GFP⁺ cells despite all groups being seeded 1:1. Additionally, this group exhibited longer average branch lengths (6.48 ± 5.98 μm; n = 10,851 branches) than those with A2 astrocytes (1.66 ± 1.64 μm; n = 8,882 branches). A1 co=cultures also showed higher PDGFRA and lower NEUROD1 expression relative to homeostatic co-cultures.
| Treatment | Control | Readout | Purpose | |
| Exp 0: scRNA-seq reanalysis | MCAO vs. sham mouse brains | Sham | Cell proportions, CellChat signaling | NSC/OPC amount, signaling changes |
| Exp 1: NSCs + A1/A2 factors | A1 factors (TNFα + IL-1α + C1q); A2 factors (TNFα + IL-1β) | NSC media, blank differentiation media | IF (C3, GFAP, PDGFRA) | Inflammatory cytokines on NSC fate |
| Exp 2: NSCs + individual factors | TNFα, IL-1α, C1q | NSC media | IF (PDGFRA, SOX10, C3, SOX2) | Inflammatory cytokines on NSC fate |
| Exp 3: TNFα release by reactive astrocytes | Homeostatic, A1, A2 astrocytes; ± inhibitors | Homeostatic astrocytes; DMSO | ELISA, RT-qPCR | TNFα production and inhibitor effects |
| Exp 4: NSCs + astrocyte CM | CM from homeostatic, A1, A2 astrocytes; inhibitor-treated A1 CM | Homeostatic CM | IF, RT-qPCR | Astrocyte-secreted factors on NSC differentiation |
| Exp 5: NSC + reactive astrocyte co-cultures | A1, A2, homeostatic astrocytes | Homeostatic co-culture | Flow cytometry, morphology (branch length), IF, RT-qPCR | Contact-dependent effects on NSC differentiation |
Discussion and future directions
This study identifies a key signaling pathway between A1 reactive astrocytes and NSCs that is upregulated during glial scar formation. Through direct exposure to as well as experiments involving conditioned media and co-cultures, TNFα from A1 astrocytes drove NSCs to increase expression of OPC-associated markers, though lineage-tracing and functional myelination assays are needed to distinguish differentiation from transient state changes. Reactive astrocytes stimulated at higher concentrations of pro-inflammatory microglia-derived cytokines exhibited the most sustained TNFα release after one week, and TNFα alone was sufficient to induce robust TNFα production compared to IL-1α or C1q alone. A2 astrocytes generated with a combination of TNFα and IL-1β, showed no TNFα release, consistent with an antagonistic relationship between the two cytokines and supporting the interpretation that the assay was not merely detecting residual exogenous TNFα. Acellular titration tests support that TNFα was effectively removed, but further experiments where neutralizing antibodies are added or an assay differentiating endogenous from recombinant ligand would further help confirm this claim. Administration of dantrolene and salubrinal for 24 h after the activation period successfully suppressed TNFα expression and release in reactive astrocytes, mitigating the effect seen on NSCs, which instead retained multipotent markers and neurosphere-forming qualities.
To note is that accumulating evidence suggests the A1/A2 classification to be an oversimplification. Thus, “A1-like” and “A2-like” in the context of this study should be understood as heuristic rather than definite ends of a spectrum of reactive states, and reactive astrocyte responses likely demonstrate far more heterogeneity and context-dependence.
A limitation is that dantrolene and salubrinal could modulate other cytokines as well. A future experiment would be using an AAV vector with an Gfap-specific promoter to knock down TNFα in astrocytes, then comparing the effect of A1-activated astrocytes in which TNFα is knocked-down on NSC fate to regular A1 astrocytes. To better demonstrate the mechanism of A1 astrocytes recruiting NSCs to the site of the scar, a MCAO mouse model with AAV5-GfaAVC1D-TNFshRNA injected 2-3 weeks pre-injury could be combined with GFP⁺ NSC transplantation and subsequent analysis of NSC recruitment to the lesion. Computational analysis relied on mouse scRNA data due to human ischemic stroke datasets containing insufficient numbers of NSCs to robustly analyze cell-cell communication. On the contrary, mouse datasets capture well-characterized NSC niches and provide multiple replicate time points to map NSC lineage progression and interactions. Cross-species differences in timing of NSC differentiation and inflammatory gene expression must be considered. Experiments are being repeated on primary cell lines. iPSC-derived cells show slightly differing inflammatory transcriptomic profiles as compared to primary cells23. Additionally, iPSC-derived astrocytes often retain a more fetal and immature state that lack robust expression of certain astrocyte markers such as AQP4 and ALDH1L124.
Additional cytotoxicity assays will quantify the effects of high cytokine doses and inhibitors beyond trypan blue counts. Co-cultures will be repeated at a lower seeding density (5k:5k) to avoid excessive astrocyte confluence. To better understand the heterogeneity of reactive astrocytes25 (with some uniquely presenting markers such as OLIG2 or Nestin) and how different methods of glial scar induction yield transcriptomically unique populations of reactive astrocytes, organoid models will be used. Brain organoids typically see the appearance of glial cells between days 60-90, and at this time point organoids will be either injected with LPS, administered supernatant from A1 astrocytes, or kept in hypoxic conditions mimicking ischemia. Then, Flow Cytometry and single-cell sequencing may be applied to identify unique subtypes of reactive astrocytes. From there further experiments will measure their TNFα producing capacity and effect on NSCs.
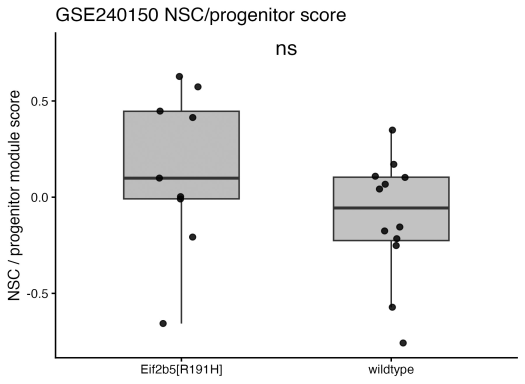
Vanishing White Matter Disease (VWMD) is a condition in which astrocytes fail to activate and take on the typical A1 inflammatory subtype due to mutations in genes encoding subunits of eukaryotic translation initiation factor 2B (eIF2B)26. A lack of glial scarring is seen in VWMD, with oligodendrocytes and OPCs failing to home to the site of the glial scar despite the presence of major lesions to the white matter27. Analyzing a bulk RNA-seq dataset from an eIF2B knockout, the same drastic reduction in the NSC population that is seen in wild type populations that have undergone an event provoking glial scar formation is not demonstrated. This suggests that by impairing astrocytes in their ability to activate, their effects on NSC differentiation is inhibited, reducing a population that would normally contribute to proper formation of the architecture of the glial scar.
While there are instances of excessive glial scarring and reactive astrogliosis leading to deleterious effects on axon regeneration and neuronal toxicity, the signaling axis between A1 reactive astrocytes and NSCs to form C3⁺ OPCs may be instrumental in forming the protective barrier that the glial scar provides. Thus, clinical emphasis should be placed on modulating rather than inhibiting the activation of A1 astrocytes, and seeking to better understand how we may exploit their protective functions in containing damage and facilitating remyelination.
References
- Wanner, I. B., Anderson, M. A., Song, B., Levine, J., Fernandez, A., Gray-Thompson, Z., Ao, Y., & Sofroniew, M. V. (2013). Glial scar borders are formed by newly proliferated, elongated astrocytes that interact to corral inflammatory and fibrotic cells via STAT3-dependent mechanisms after spinal cord injury. Journal of Neuroscience, 33(31), 12870–12886. https://doi.org/10.1523/JNEUROSCI.2121-13.2013
[↩]
- Buss, A., Pech, K., Kakulas, B. A., Martin, D., Schoenen, J., Noth, J., & Brook, G. A. (2009). NG2 and phosphacan are present in the astroglial scar after human traumatic spinal cord injury. BMC Neurology, 9(1). https://doi.org/10.1186/1471-2377-9-32 [↩]
- Kjell, J., & Götz, M. (2020). Filling the gaps – a call for comprehensive analysis of extracellular matrix of the glial scar in region-and injury-specific contexts. Frontiers in Cellular Neuroscience, 14. https://doi.org/10.3389/fncel.2020.00032 [↩]
- Hu, R., Zhou, J., Luo, C., Lin, J., Wang, X., Li, X., Bian, X., Li, Y., Wan, Q., Yu, Y., & Feng, H. (2010). Glial scar and neuroregeneration: Histological, functional, and magnetic resonance imaging analysis in chronic spinal cord injury. Journal of Neurosurgery: Spine, 13(2), 169–180. https://doi.org/10.3171/2010.3.SPINE09190 [↩]
- Cheng, Li, et al. “M1-Type Microglia Can Induce Astrocytes to Deposit Chondroitin Sulfate Proteoglycan After Spinal Cord Injury.” Neural Regeneration Research, vol. 17, no. 5, 2022, p. 1072, https://doi.org/10.4103/1673-5374.324858 [↩]
- Henning, L., Antony, H., Breuer, A., Müller, J., Seifert, G., Audinat, E., Singh, P., Brosseron, F., Heneka, M. T., Steinhäuser, C., & Bedner, P. (2022). Reactive microglia are the major source of tumor necrosis factor alpha and contribute to astrocyte dysfunction and acute seizures in experimental temporal lobe epilepsy. Glia, 71(2), 168–186. https://doi.org/10.1002/glia.24265 [↩]
- Bhatt, M., Sharma, M., & Das, B. (2024). The role of inflammatory cascade and reactive astrogliosis in glial scar formation post-spinal cord injury. Cellular and Molecular Neurobiology, 44(1), 78. https://doi.org/10.1007/s10571-024-01519-9 [↩]
- Fan, Y.-Y., & Huo, J. (2021). A1/A2 astrocytes in central nervous system injuries and diseases: Angels or devils? Neurochemistry International, 148, 105080. https://doi.org/10.1016/j.neuint.2021.105080 [↩]
- Su, Y., Chen, Z., Du, H., Liu, R., Wang, W., Li, H., & Ning, B. (2019). Silencing miR‐21 induces polarization of astrocytes to the a2 phenotype and improves the formation of synapses by targeting glypican 6 via the signal transducer and activator of transcription‐3 pathway after acute ischemic spinal cord injury. The Faseb Journal, 33(10), 10859–10871. https://doi.org/10.1096/fj.201900743r [↩]
- Liddelow, S. A., Guttenplan, K. A., Clarke, L. E., Bennett, F. C., Bohlen, C. J., Schirmer, L., Bennett, M. L., Münch, A. E., Chung, W.-S., Peterson, T. C., Wilton, D. K., Frouin, A., Napier, B. A., Panicker, N., Kumar, M., Buckwalter, M. S., Rowitch, D. H., Dawson, V. L., Dawson, T. M., & Stevens, B. (2017). Neurotoxic reactive astrocytes are induced by activated microglia. Nature, 541(7638), 481–487. https://doi.org/10.1038/nature21029 [↩]
- Delgado-García, L. M., Ojalvo-Sanz, A. C., Nakamura, E., Martín-López, E., Marimelia Porcionatto, & Lopez-Mascaraque, L. (2024). Dissecting reactive astrocyte responses: Lineage tracing and morphology-based clustering. Biological Research, 57(1). https://doi.org/10.1186/s40659-024-00532-y [↩]
- Batiuk, M. Y., Martirosyan, A., Wahis, J., de Vin, F., Marneffe, C., Kusserow, C., Koeppen, J., Viana, J. F., Oliveira, J. F., Voet, T., Ponting, C. P., Belgard, T. G., & Holt, M. G. (2020). Identification of region-specific astrocyte subtypes at single cell resolution. Nature Communications, 11(1). https://doi.org/10.1038/s41467-019-14198-8 [↩]
- Ye, Dou, et al. “Identifying Genes That Affect Differentiation of Human Neural Stem Cells and Myelination of Mature Oligodendrocytes.” Cellular and Molecular Neurobiology, vol. 43, no. 5, 22 Dec. 2022, pp. 2337–2358, https://doi.org/10.1007/s10571-022-01313-5 [↩]
- Gonzalez-Perez, O. (2012). Neural stem cells in the adult human brain. Biological and Biomedical Reports, 2(1), 59–69. https://pmc.ncbi.nlm.nih.gov/articles/PMC3505091 [↩]
- Ioannidis, K., et al. (2021). 3D reconstitution of the neural stem cell niche: Connecting the dots. Frontiers in Bioengineering and Biotechnology, 9, 705470. https://doi.org/10.3389/fbioe.2021.705470 [↩]
- Soung, A. L., Davé, V. A., Garber, C., Tycksen, E. D., Vollmer, L. L., & Klein, R. S. (2022). Il-1 reprogramming of adult neural stem cells limits neurocognitive recovery after viral encephalitis by maintaining a proinflammatory state. Brain, Behavior, and Immunity, 99, 383–396. https://doi.org/10.1016/j.bbi.2021.10.010 [↩]
- Wang, J., et al. (2023). Inhibition of A1 astrocytes and activation of A2 astrocytes for the treatment of spinal cord injury. Neurochemical Research, 48(3), 767–780. https://doi.org/10.1007/s11064-022-03820-9 [↩]
- Li, H., et al. (2024). Targeting astrocytes polarization after spinal cord injury: A promising direction. Frontiers in Cellular Neuroscience, 18. https://doi.org/10.3389/fncel.2024.1478741 [↩]
- Li, F., Hayashi, T., Jin, G., Deguchi, K., Nagotani, Nagano, I., Shoji, M., Chan, P. H., & Abe, K. (2005). The protective effect of dantrolene on ischemic neuronal cell death is associated with reduced expression of endoplasmic reticulum stress markers. Brain Research, 1048(1-2), 59–68. https://doi.org/10.1016/j.brainres.2005.04.058 [↩]
- Ovcjak, A., Xiao, A., Kim, J.-S., Xu, B., Szeto, V., Turlova, E., Abussaud, A., Chen, N., Miller, S. P., Sun, H.-S., & Feng, Z.-P. (2022). Ryanodine receptor inhibitor dantrolene reduces hypoxic-ischemic brain injury in neonatal mice. Experimental Neurology, 351, 113985. https://doi.org/10.1016/j.expneurol.2022.113985 [↩]
- Fan, X., Chen, J., Zhang, Z., Chen, F., Wang, H., Cai, Y., & Li, J. (2022). Salubrinal alleviates traumatic spinal cord injury through suppression of the eIF2α/ATF4 pathway in mouse model. BIOCELL, 46(6), 1527–1535. https://doi.org/10.32604/biocell.2022.018269 [↩]
- Welser-Alves, J. V., & Milner, R. (2013). Microglia are the major source of TNF-α and TGF-β1 in postnatal glial cultures; regulation by cytokines, lipopolysaccharide, and vitronectin. Neurochemistry International, 63(1), 47–53. https://doi.org/10.1016/j.neuint.2013.04.007 [↩]
- Spreng, A.-S., Brüll, M., Leisner, H., Suciu, I., & Leist, M. (2022). Distinct and dynamic transcriptome adaptations of iPSC-generated astrocytes after cytokine stimulation. Cells, 11(17), 2644. https://doi.org/10.3390/cells11172644 [↩]
- Szeky, B., Jurakova, V., Fouskova, E., Feher, A., Zana, M., Karl, V. R., Farkas, J., Bodi-Jakus, M., Zapletalova, M., Pandey, S., Kucera, R., Lochman, J., & Dinnyes, A. (2024). Efficient derivation of functional astrocytes from human induced pluripotent stem cells (hiPSCs). PloS One, 19(12), e0313514. https://doi.org/10.1371/journal.pone.0313514 [↩]
- Anderson, M. A., Ao, Y., & Sofroniew, M. V. (2014). Heterogeneity of reactive astrocytes. Neuroscience Letters, 565, 23–29. https://doi.org/10.1016/j.neulet.2013.12.030 [↩]
- Dooves, S., Bugiani, M., Postma, N. L., Polder, E., Land, N., Horan, S. T., van Deijk, A.-L. F., van de Kreeke, A., Jacobs, G., Vuong, C., Klooster, J., Kamermans, M., Wortel, J., Loos, M., Wisse, L. E., Scheper, G. C., Abbink, T. E. M., Heine, V. M., & van der Knaap, M. S. (2016). Astrocytes are central in the pathomechanisms of vanishing white matter. Journal of Clinical Investigation, 126(4), 1512–1524. https://doi.org/10.1172/jci83908 [↩]
- Geva, M., Cabilly, Y., Assaf, Y., Mindroul, N., Marom, L., Gali, R., Pinchasi, D., & Elroy‑Stein, O. (2010). A mouse model for eukaryotic translation initiation factor 2B leucodystrophy reveals abnormal development of brain white matter. Brain, 133(8), 2448–2461. https://doi.org/10.1093/brain/awq180 [↩]