Zachary Zhi1, Rohan Bojja1, Nathaniel Hong1, Felix Grun1 & John Lowengrub1
1 University of California Irvine, California, USA
Abstract
Fibroblasts are integral to tissue maintenance and wound healing. However, in the tumor microenvironment, activated fibroblasts can promote cancer progression through the extracellular matrix via the secretion of cytokines that recruit and polarize immune cells and the modification of drug penetration and paracrine signaling. Fibroblasts are widespread across the body and are often subject to chemotherapeutic agents, yet their metabolic response to these agents remains unclear. While cancer therapeutics are intended to influence cancerous cells solely, evidence demonstrates that chemotherapeutic agents, including doxorubicin, often modify fibroblast metabolism and signaling mechanisms in sublethal concentrations, including the alteration of TGF-β signaling pathways and myofibroblast differentiation. This study’s goal is to understand the effects of three anti-cancer agents on the metabolism of mouse-derived fibroblast cells: 2-deoxyglucose, which inhibits glycolysis; 5-fluorouracil, which inhibits pyrimidine synthesis; and doxorubicin, which is an anthracycline chemotherapeutic. The analysis of untargeted LC-MS uncovered that treatment-induced metabolic shifts include the common feature rt/mz 7.78/453.17, tentatively identified as 5α-androstan-3β,17α-diol disulfate, along with features linked to lipid, steroid, redox, mitochondrial, and polyamine metabolism. The consistent feature-based shifts in all treatment groups show how the introduction of anti-cancer agents can alter fibroblast metabolomic patterns, but the significant metabolites found require future confirmation through MS/MS fragmentation. This study emphasizes that stromal metabolism could play an integral role in the chemotherapy remodeling of tumor microenvironments, and these findings can provide the basis for future validation studies.
Keywords: Cancer Therapeutics; Metabolomics; 2-deoxyglucose; 5-fluorouracil; Doxorubicin
Introduction
Fibroblasts are stromal cells that maintain tissue architecture, regulate the composition of the extracellular matrix (ECM), and support wound repair mechanisms1. Fibroblasts also regulate tissue metabolism and are dynamically responsive to environmental and chemical stimuli. Since fibroblasts are distributed across the body, they are often subject to systemic chemotherapeutic agents; thus, it is imperative to understand their metabolic response to treatments, as comprehension is still incomplete.
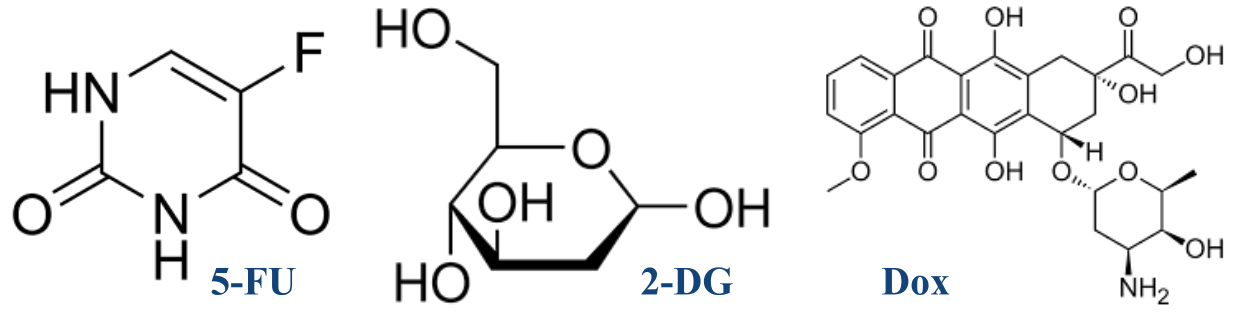
While chemotherapy targets the rapid division of malignant cells, it is also shown that chemotherapeutic agents can alter the physiology of fibroblasts and other non-cancerous stromal cells. Doxorubicin (Dox) has been studied to show an increase in the secretion of pro-inflammatory mediators at non-lethal concentrations, which include IL-6 and MMP12. IL-6 has been shown to induce paracrine signaling, resulting in heightened cancer cell proliferation and treatment resistance3. Furthermore, doxorubicin can cause the modulation of TGF-β signaling while suppressing fibrogenic markers such as CCN2 and COL14. 5-fluorouracil (5-FU) is known to be related to structural damage and decreased collagen deposition in proliferating fibroblasts5. It is also shown that 5-FU inhibits fibroblast proliferation by reducing matrix metalloproteinase 9 expression6. 2-deoxyglucose (2-DG) is a metabolic inhibitor that can cause metabolic stress, the impairment of autophagy, and the promotion of apoptosis under non-lethal doses7,8. Overall, these findings imply that chemotherapeutic agents can alter fibroblast signaling and metabolic pathways independently of cytotoxicity.
While there is growing realization that stromal cells influence therapeutic outcomes, fibroblast-dependent resistance, especially attributed to 5-FU, has also been demonstrated with chemoresistance in colorectal cancer models9. However, research on this chemotherapy resistance has mainly focused on intrinsic mechanisms10,11,12. Fibroblasts can alter cytokine signaling pathways, remodel ECM, and induce stress-dependent metabolic reprogramming, but how these changes affect overall treatment response remains unclear13,14. Additionally, fibroblast tissue heterogeneity and plasticity complicate predictions of drug treatment effects15.
To fill this gap, the metabolic response of fibroblasts was studied in isolation while utilizing experimental cell cultures and mass spectrometry. Mouse-derived fibroblasts were treated with 5-FU, 2-DG, and Dox, and further statistical analysis was conducted to identify patterns and significant metabolite changes. This study aims to refine how anticancer therapeutics can affect non-cancerous stromal cells and identify pathways that are affected by introduced chemotherapy exposure by identifying drug-induced metabolic changes.
Methods
Cell Culture
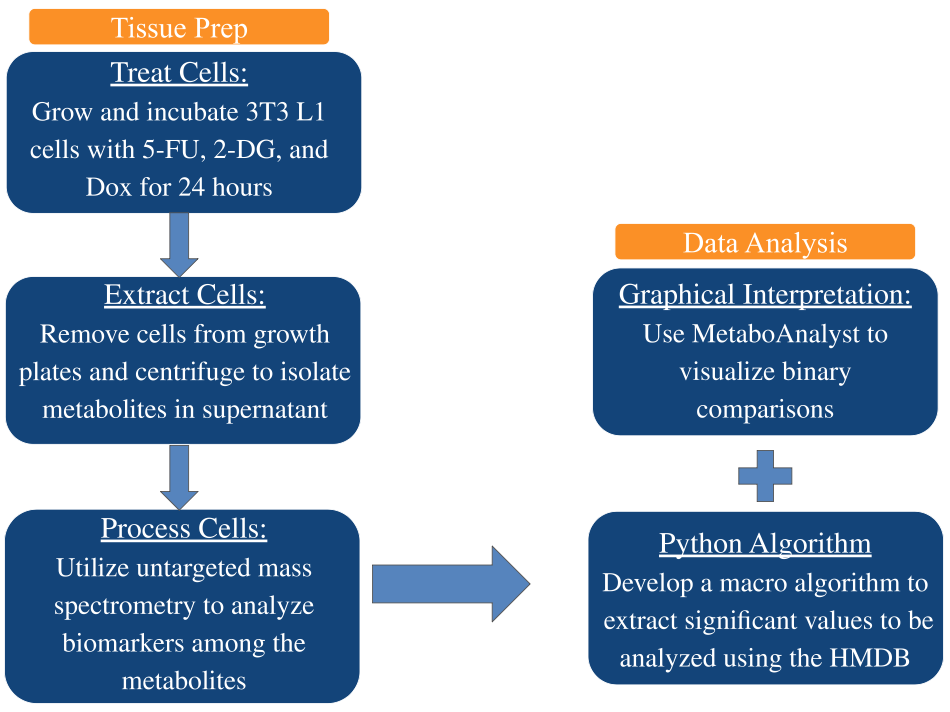
3T3 L-1Mouse-derived fibroblast cells were cultured in 10-centimeter tissue culture dishes. Dulbecco’s Modified Eagle Medium (DMEM) was used for maintenance of cells, which were supplemented with 10% calf serum (CS) in standard incubator temperatures and conditions (37 °C, 5% CO₂). The cells were cultured to 80% confluency directly before treatment, containing 3 × 10⁶ cells per 10-cm dish. The metabolite extraction volumes were standardized in all samples and were processed from identical 10-centimeter culture plates to maintain normalized cell numbers. Each treatment group included three independent cultured replicates, which were treated and extracted separately.
Drug Treatments
Fibroblast cells were each treated with either vehicle control, 2-DG, 5-FU, or Dox. Agent concentrations were based on published EC50/LD50 ranges for fibroblasts, which are intended to induce sub-lethal stress over 24-hour periods, rather than total cytotoxicity. Treatments were then applied to each replicated culture. The drug stock, depending on solubility requirements, is prepared in either distilled water, ethanol (100%), or dimethyl sulfoxide (DMSO), with the final concentrations being below 0.5% ethanol and 0.5% DMSO.
Cell Harvesting and Metabolite Extraction
Culture medium was aspirated after treatment, and phosphate-buffered saline (PBS) was used to gently wash cells twice to minimize metabolic disruptions. Trypsin-EDTA was used to detach cells, which were then resuspended in complete medium and pelleted with centrifugation at 1500 rpm for 10 minutes. Cell pellets were aspirated, resuspended in PBS, and dispersed. After microfuging at 400 rpm for 2 minutes, the cell pellet was aspirated again, rinsed using distilled water, and immediately resuspended and dispersed in 200 μL of distilled water. Addition of 800 μL of methanol, followed by brief vortexing, extracted metabolites. In order to rapidly suppress ongoing enzymatic activity during extraction, cold methanol addition was used as the primary metabolite-quenching step. No isotopically labeled internal standards or pooled quality-control (QC) samples were included in this exploratory study. Samples were incubated at 70 °C for 5 minutes, then centrifuged at 14,000 rpm for 5 minutes. Then, supernatants containing metabolites were collected and stored in mass spectrometry (MS) vials at –80 °C to await analysis. To preserve replicate-specific metabolic variation, each biological replicate was harvested and extracted independently.
Mass Spectrometry Analysis
10 μL of each sample was injected into the Waters Xevo G2-XS QTOF mass spectrometer, paired with the Waters Acquity BEH C18 column (50 × 2.1 mm, 1.7 μm), at a temperature of 50 °C. Solvent A (water containing 0.1% formic acid) and solvent B (acetonitrile containing 0.1% formic acid) were run at a flow of 0.4 mL/min for chromatographic separation. The gradient program was: 0–1 min, 97% A / 3% B; 1–10 min, linear gradient to 3% A / 97% B; 10–12 min, held at 3% A / 97% B; 12–13 min, returned to 97% A / 3% B; and 13–15 min, re-equilibration at 97% A / 3% B with final flow adjustment to 0.05 mL/min.
Mass spectrometry acquisition used positive-ion electrospray ionization (ESI+) in MSe acquisition mode over a range of 100–1000 m/z. Leucine enkephalin was the lockmass reference ion (m/z 566.771). The mass tolerance of ± 5 ppm was added during data processing. Common adducts include [M+H]+, [M+Na]+, [M+NH4]+, [M-H2O+H]+, [2M+H]+, and [M+2H]2+.
Each extracted biological replicate was analyzed using triplicate technical LC-MS injections to evaluate instrumental reproducibility and improve measurement reliability. Injection replicates were grouped during downstream preprocessing prior to statistical analysis.
Data Processing and Statistical Analysis
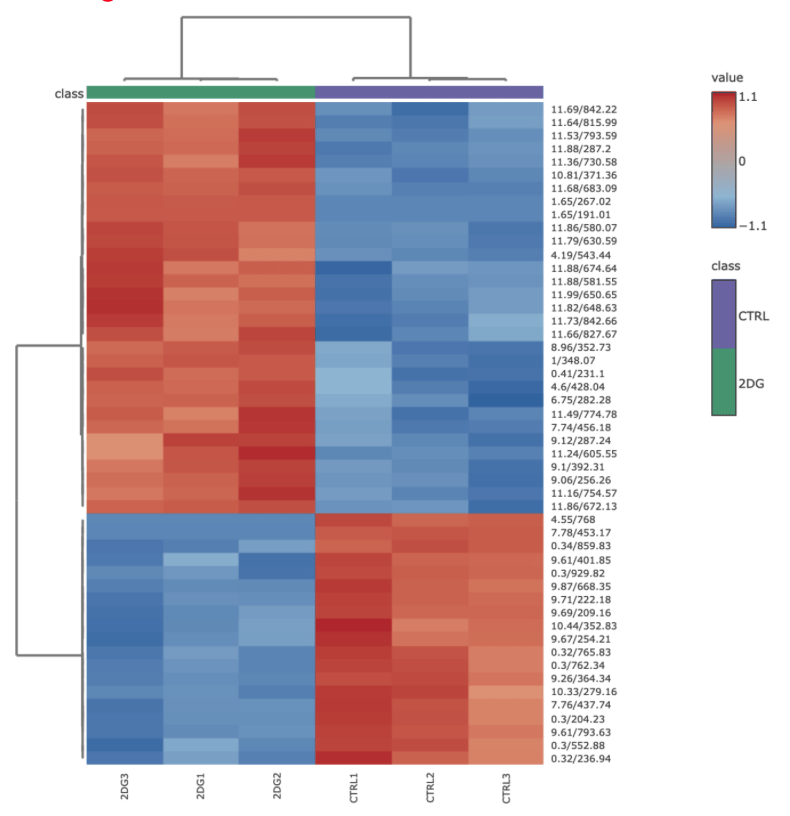
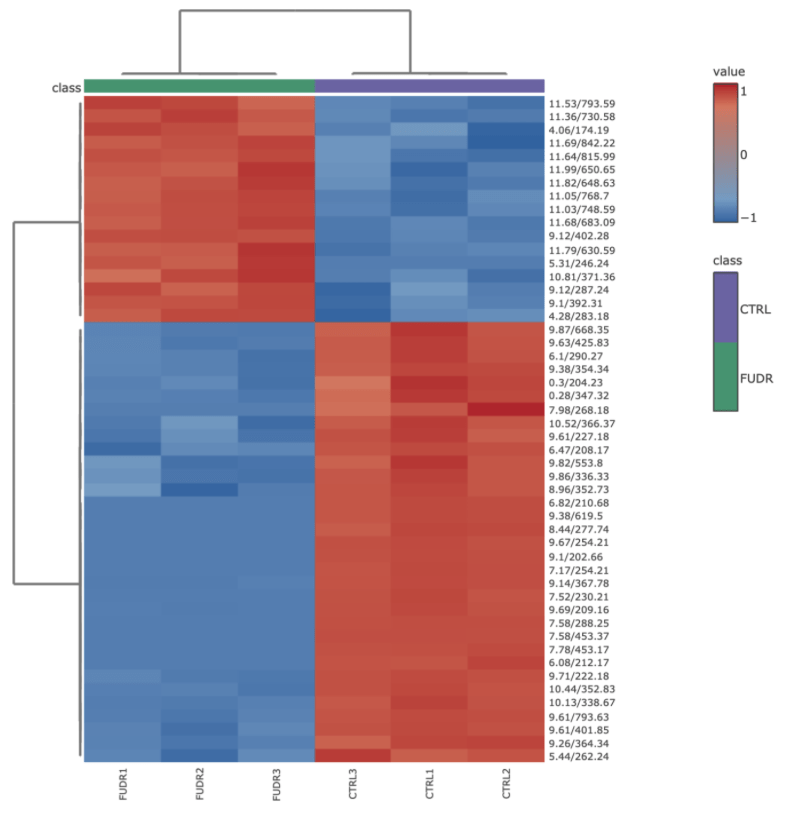
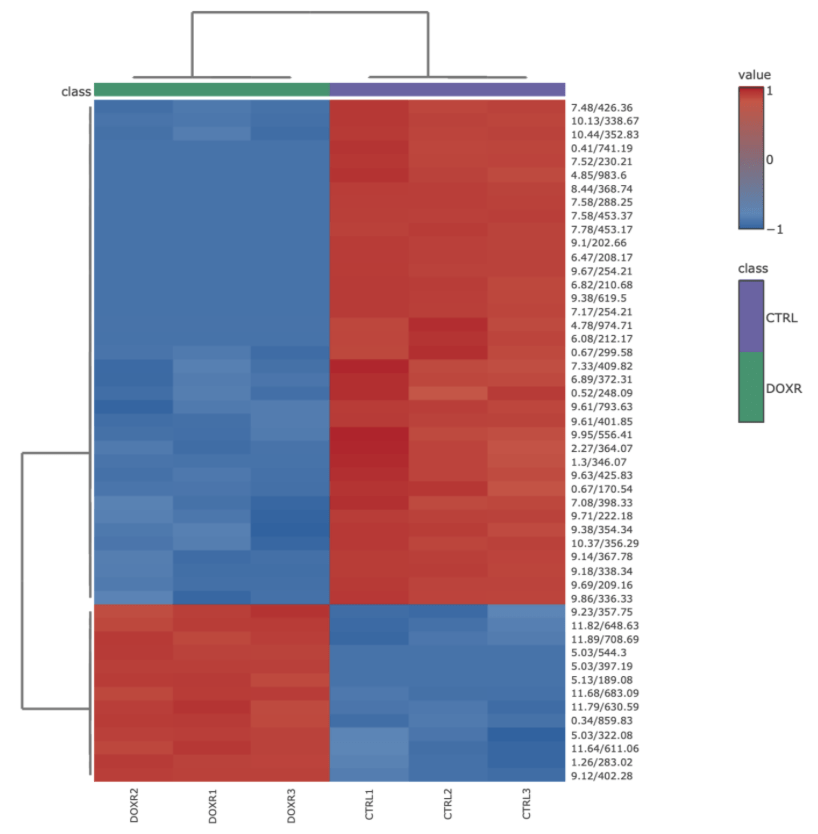
Raw MS data were processed using Progenesis QI software. Exact-mass (m/z) features were searched against the Human Metabolome Database (HMDB), LipidMaps, and additional reference databases using a mass tolerance window of ± 10 ppm. Where available, candidate metabolite annotations were further evaluated by comparison of MSe low- and high-collision-energy fragmentation spectra. Because dedicated data-dependent MS/MS acquisition and authentic reference standards were not used, metabolite annotations remain putative and should be interpreted as MSI Level 2 identifications16. Features were aligned and normalized in Progenesis QI using the software’s default global normalization algorithm based on overall ion abundance across samples to reduce technical variation between LC-MS runs. Normalized data were then exported as .csv files containing retention time, m/z, and intensity values. Custom Python scripts utilizing pandas dataframes were used to consolidate and preprocess MS feature information. (see Python Algorithm) Algorithm output data was then uploaded to MetaboAnalyst for statistical analysis. Principal component analysis (PCA) and multiple variants of partial least squares discriminant analysis (PLS-DA) were used to identify global metabolic shifts between treatment groups. Model validity was assessed using cross-validation to reduce the risk of overfitting. Volcano plots were generated to visualize significantly altered metabolites, and heatmaps were constructed to visualize overall clustering patterns and highlight coordinated changes across treatment groups (see Figures 5.1-5.3 and 6.1-6.3). Mass Spectra graphs were used to pinpoint findings for specific biomarkers. Technical injection replicates were grouped during downstream computational preprocessing prior to statistical analysis. A formal pooled QC workflow, extraction blanks, randomized injection order, and post-acquisition batch-drift correction were not incorporated into the present exploratory study, consistent with gaps identified in current community consensus guidance17. Future studies will incorporate pooled QC injections analyzed by fast data-dependent acquisition (FDDA) with exclusion-list strategies to obtain higher-quality MS/MS fragmentation spectra for improved database matching and de novo structural elucidation.
Sample sizes were selected based on commonly accepted practices in exploratory untargeted metabolomics studies using cultured cell models, where three independent biological replicates are frequently used to capture biological variability while maintaining experimental feasibility. Technical triplicate LC-MS injections were additionally performed to assess instrumental reproducibility and improve analytical confidence. For metabolites highlighted in the Results section, quantitative changes were calculated from replicate feature intensities for each treatment group relative to vehicle controls. Fold changes were calculated as the mean treatment intensity divided by the mean control intensity, and log2 fold changes were reported. Statistical significance was assessed using two-sided Welch’s t-tests, and Benjamini-Hochberg false discovery rate correction was applied across common LC-MS features for each treatment-control comparison.
PLS-DA models were generated using normalized LC-MS feature intensities exported from Progenesis QI. Prior to modeling, data were log10 transformed and Pareto scaled. Binary treatment-control PLS-DA models included six samples each, consisting of three control and three treatment samples, while the four-group model included twelve samples in total. Leave-one-out cross-validation was used to calculate R²Y and Q² values. Binary models retained two latent components, while the four-group model retained three components based on cross-validation performance and model complexity. Permutation testing was performed to assess the likelihood of overfitting. VIP scores were calculated from the retained PLS-DA models, and metabolites with VIP > 1.0 were considered important contributors to group separation.
Python Algorithm
A custom Python 3 script was used for post-processing volcano-plot output exported from MetaboAnalyst. The script was not used for normalization or primary statistical testing; these steps were performed upstream using Progenesis QI and MetaboAnalyst. The input file used various feature identifiers in rt/mz format, raw p-values, and log2 fold-change values. The features are classified as significant if the raw p-value < 0.05 and |log2 fold change| > 1. Significant features are then exported as a Comma-Separated Values file. The script parses the rt/mz identifier by distinguishing retention time and m/z values using the “/” delimiter, then converts the m/z values to numeric format, removes non-parsable entries, and exports a mass-only text file for downstream HMDB database searching. The complete script is provided in Supplementary File S1.
Results and Discussion
For a summary of the results described below, please refer to Table 1.
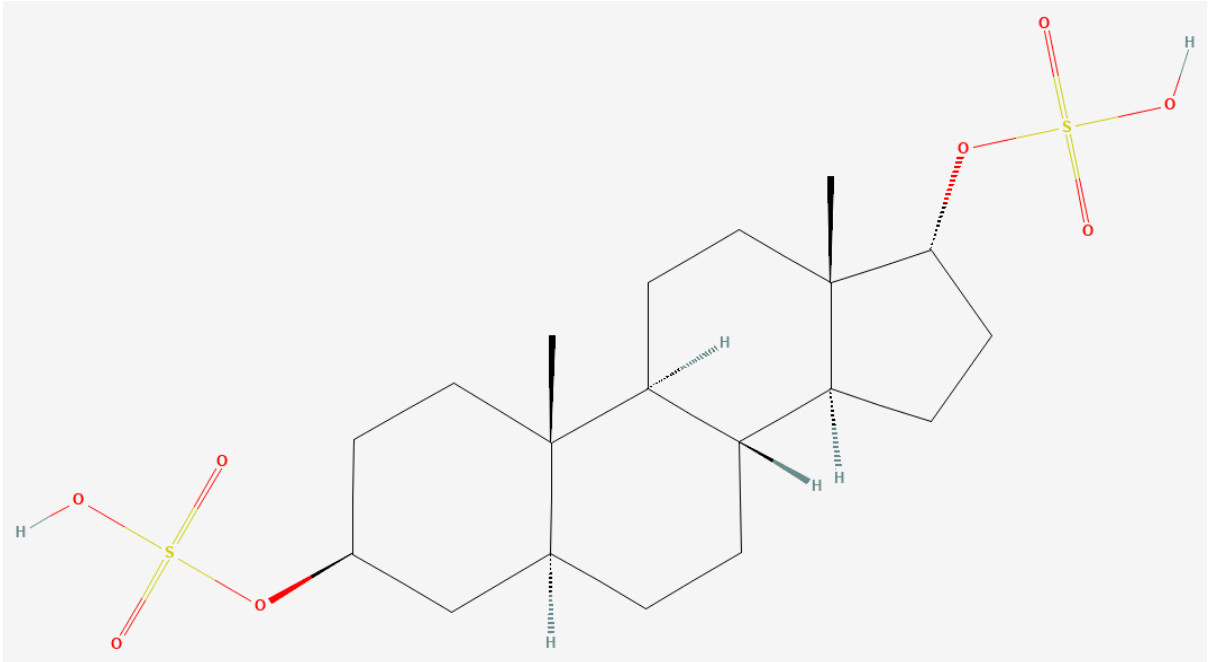
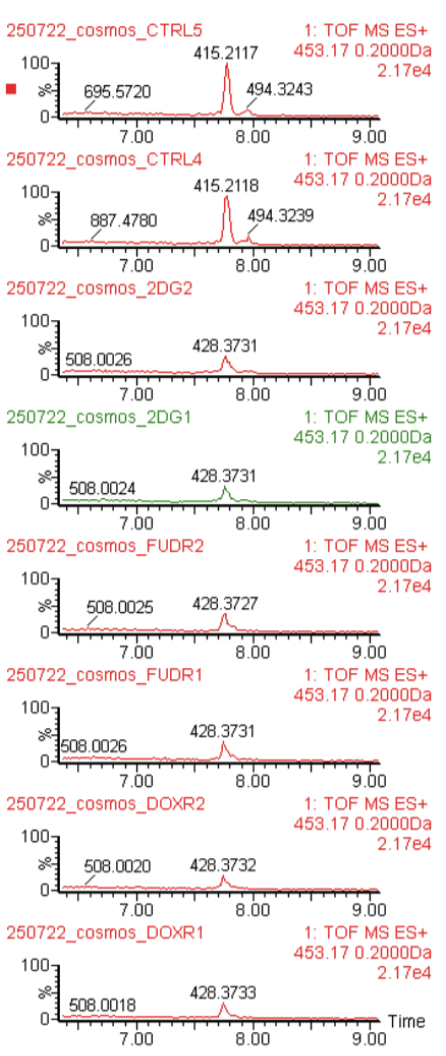
The LC-MS feature identified at rt/mz 7.78/453.17 decreased in all treatment groups. Annotated through HMDB database matching as 5α-Androstan-3β,17α-diol disulfate, this reproducible decrease suggests that all three treatments altered a shared metabolomic feature in fibroblasts. However, because the annotation was not confirmed by MS/MS fragmentation, adduct assignment, isotope fit, or authentic standard matching, conclusions about androgen metabolism, sulfation pathways, or immune–metabolic signaling should be interpreted with caution. It is known that steroid sulfation and desulfation pathways regulate local androgen and estrogen availability and have been implicated in hormone-dependent cancers18. Prior literature has linked plasma metabolites and immune-cell traits with lung adenocarcinoma risk, but the present isolated fibroblast experiment does not establish immune–metabolic signaling19.
Notable Molecules
N-Isobutyl-2,4,8-decatrienamide (HMDB0030188)
The feature (rt/mz 9.71/222.18) decreased in the 2-DG and 5-FU treatment groups, and according to the HMDB database, represents N-Isobutyl-2,4,8-decatrienamide. This feature was not used to support pathway interpretations because it does not represent an obvious endogenous fibroblast metabolite. Therefore, it is reported as an altered feature that requires future validation.
(8S,9S,10R,13R,14S,17R)-5,6-Dihydroperoxy-10,13-dimethyl-17-[(2R)-6-methylheptan-2-yl]-1,2,3,4,6,7,8,9,11,12,14,15,16,17-tetradecahydrocyclopenta[a]phenanthren-3-ol (HMDB0260189)
The feature rt/mz 7.58/453.37 was observed to decrease in the 5-FU and Dox treatment groups. Using the HMDB database, the feature is annotated as an oxidized sterol derivative. This may suggest that chemotherapeutic stress altered sterol-like or lipid oxidation-related features. Studies have connected the introduction of doxorubicin to oxidative stress-based cellular effects20. Conclusions should be interpreted cautiously since the specific metabolite identity was not further confirmed using MS/MS fragmentation or authentic standard comparison.
Octanoylcarnitine (HMDB0000791)
The feature rt/mz 7.58/288.25 decreased in both 5-FU and Dox treatment groups and is annotated as octanoylcarnitine according to the HMDB database. This could possibly suggest acylcarnitine concentration and mitochondrial fatty acid metabolism alterations. Studies have connected some chemotherapeutic agents, such as doxorubicin, to mitochondrial dysfunction; however, further validation by MS/MS fragmentation is needed, so the results should be interpreted cautiously21.
Pregnanediol (HMDB0004025)
The LC-MS feature at rt/mz 5.03/397.19 was increased in Dox-treated fibroblasts and was putatively annotated as pregnanediol. Studies have demonstrated that cultured fibroblasts often participate in steroid metabolism. However, this feature should be interpreted only as a putative steroid-like annotation, as its identity was not confirmed by MS/MS fragmentation. Progesterone metabolism or paracrine signaling implications require further validation22.
Oxalosuccinate (HMDB0304444)
The LC-MS feature at rt/mz 1.65/191.01 was increased under 2-DG treatment and was putatively annotated as oxalosuccinate. Because oxalosuccinate is associated with isocitrate dehydrogenase-related TCA cycle metabolism, this annotation may suggest a possible TCA cycle-related change if confirmed. However, the present untargeted data do not directly establish IDH disruption, altered mitochondrial flux, or redox imbalance23.
5-OH-DPAT (HMDB0246834)
The feature rt/mz 7.17/254.2 decreased in the treatment groups 5-FU and Dox, and according to the HMDB database, is annotated as 5-OH-DPAT. This synthetic feature is a dopamine receptor, but is unlikely to be confirmed as a fibroblast metabolite.
Therefore, this annotation was not used for pathway interpretations.
DG(i-15:0/0:0/20:4(5Z,7E,11Z,14Z)-OH(9)) (HMDB0298979)
The LC-MS feature at rt/mz 9.38/619.50 was decreased in 5-FU and Dox-treated cells and was putatively annotated as a hydroxylated diacylglycerol species. Diacylglycerols are broadly involved in lipid signaling pathways, but the current data do not directly demonstrate altered PKC signaling or membrane remodeling. If confirmed by MS/MS fragmentation and authentic standard comparison, this feature could represent a lipid-signaling-related change following chemotherapeutic exposure24.
N1,N8-Diacetylspermidine (HMDB0041947)
The LC-MS feature at rt/mz 7.52/230.21 was decreased following 5-FU and Dox exposure and was putatively annotated as N1,N8-diacetylspermidine. Polyamine metabolism has been linked to cellular proliferation and stress responses, but the present untargeted data do not directly establish changes in chromatin stability, DNA repair, or proliferative capacity25. If validated, this feature may suggest altered polyamine-related metabolism under chemotherapeutic stress26.
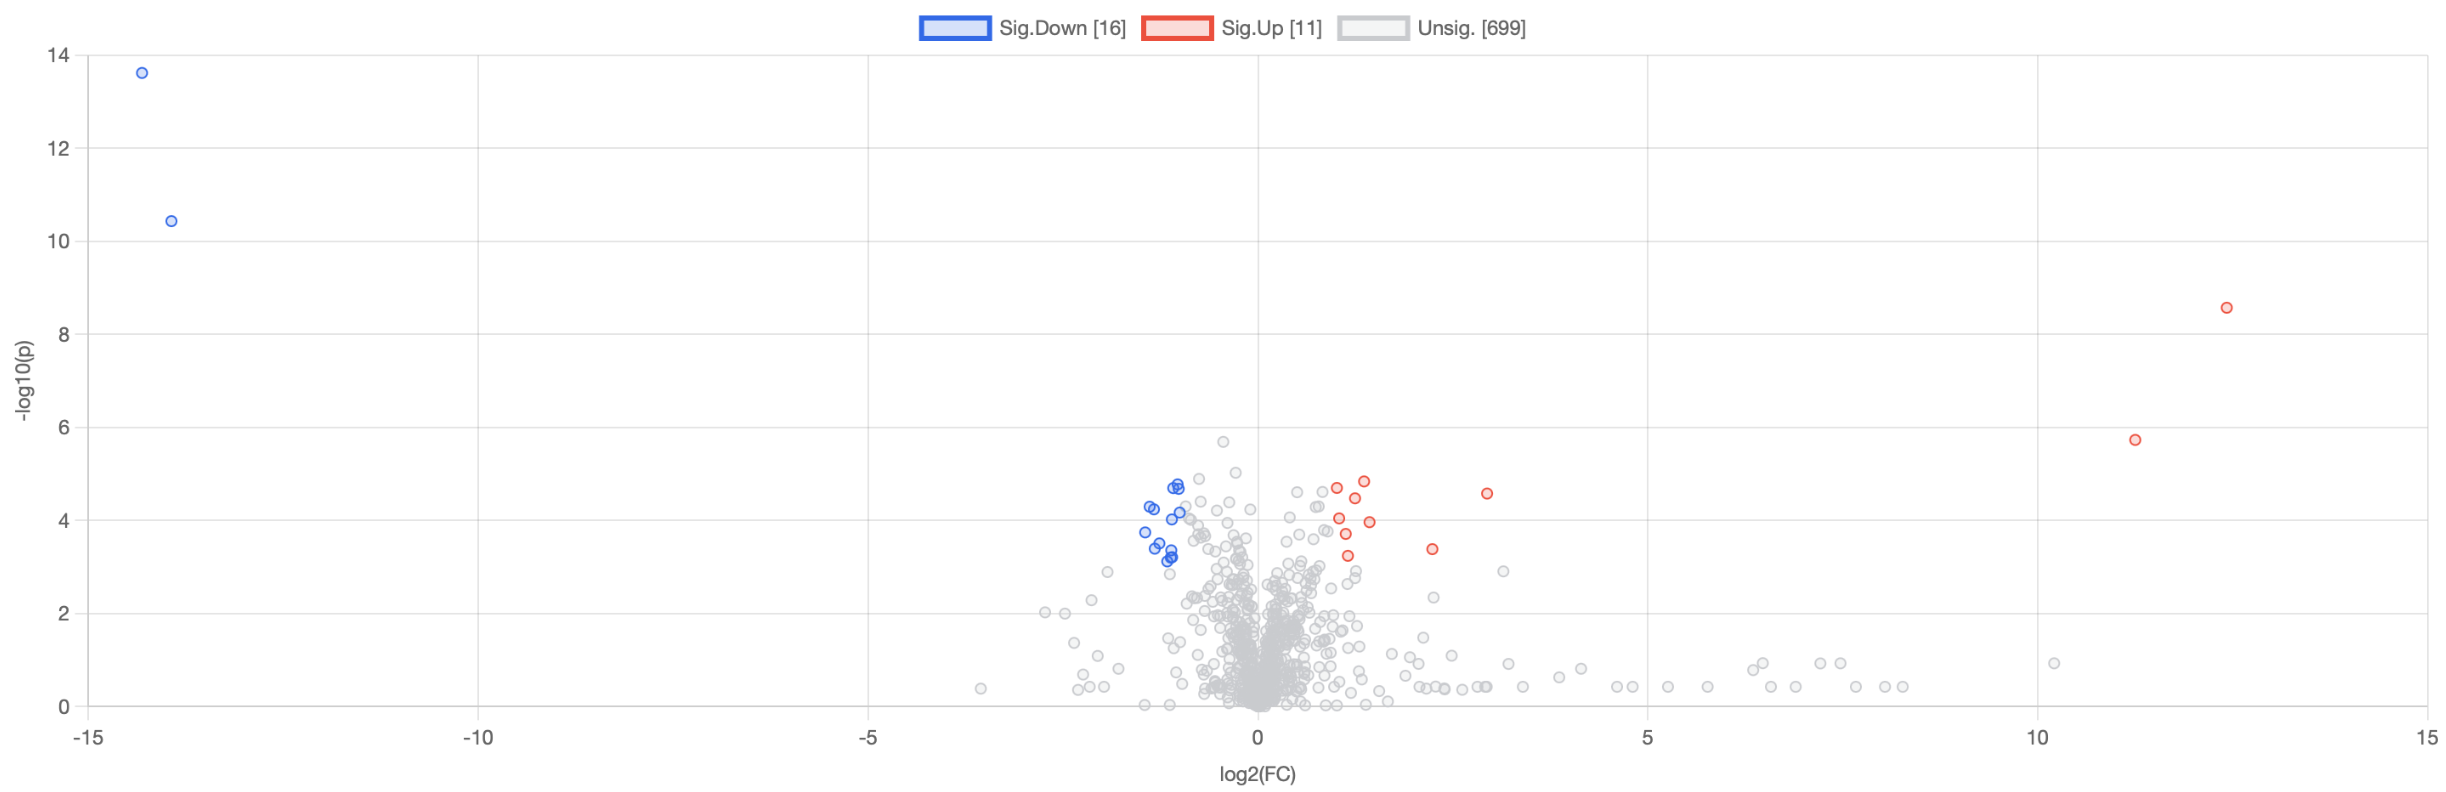
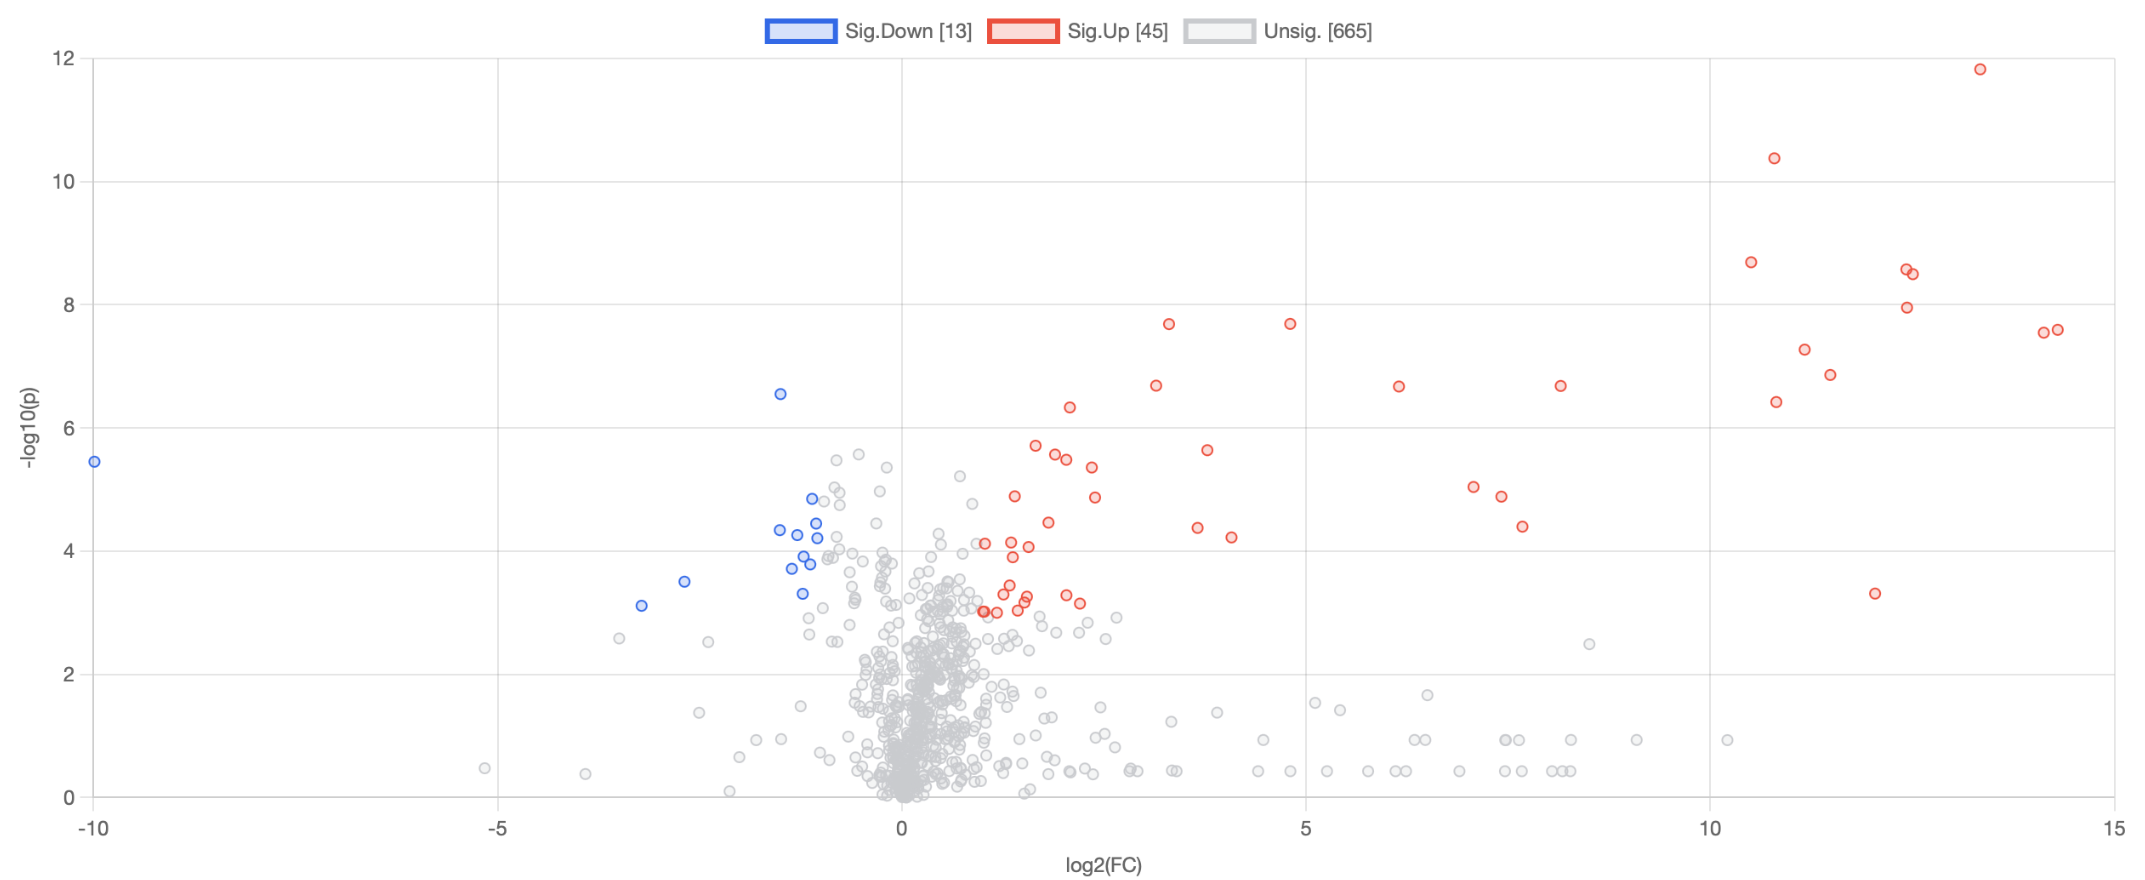
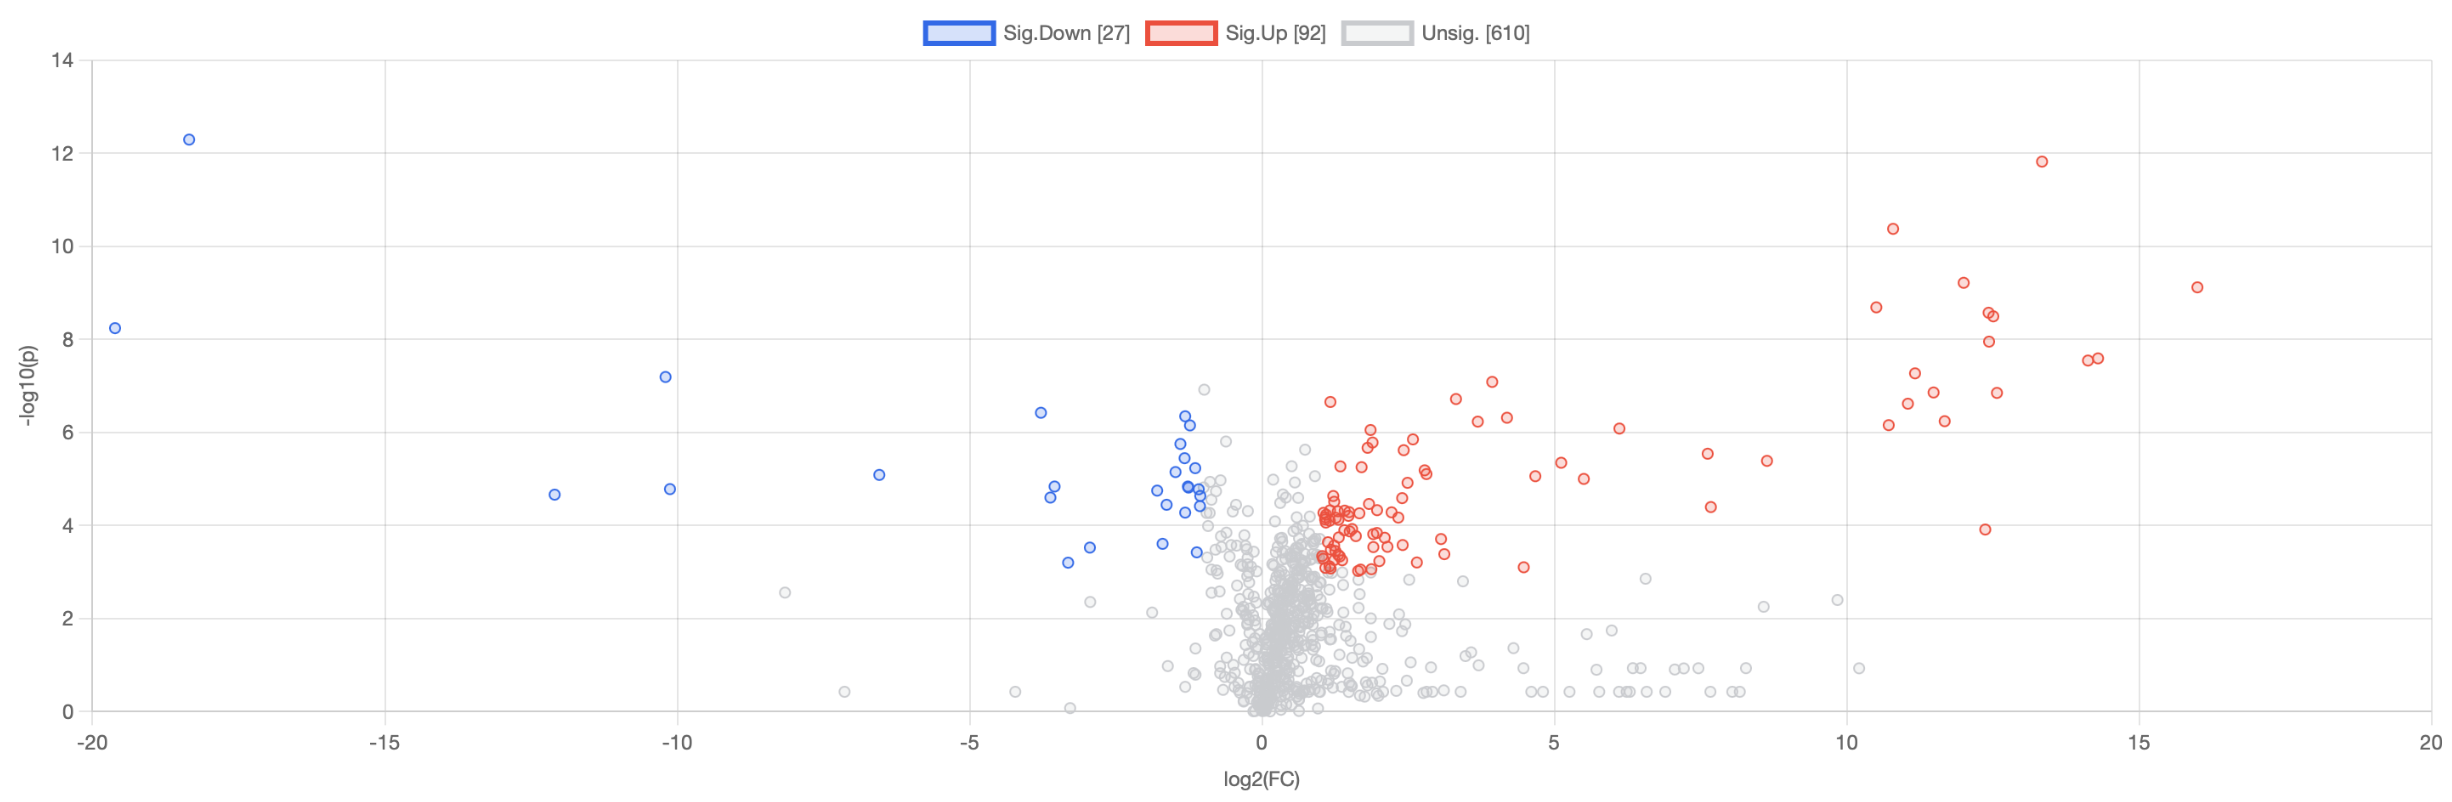
Volcano plots were used to visualize the magnitude and statistical significance of treatment-associated LC-MS feature changes, while heatmaps were used to assess whether differentially abundant features showed consistent clustering patterns across biological replicates. Figures 5.1-5.3 and 6.1-6.3 provide an overall view of metabolomics results for each treatment group:
PLS-DA validation metrics are summarized in Table 2. Binary treatment-control models showed high R²Y and Q² values, but permutation testing did not reach p < 0.05, likely due to the small number of biological replicates. Binary PLS-DA results, therefore, are exploratory, while supported by univariate fold-change and significance values. The four-group model has a stronger validation, with R²Y = 0.9861, Q² = 0.8269, and permutation p < 0.002.
| rt/mz | Putative metabolite | HMDB ID | Treatment comparison | Direction | Mean CTRL ± SD | Mean treatment ± SD | Fold change | log₂FC | Raw p-value | FDR q-value |
|---|---|---|---|---|---|---|---|---|---|---|
| 7.78/453.17 | 5α-Androstan-3β,17α-diol disulfate | HMDB0240625 | 2-DG vs CTRL | Decreased | 55,008 ± 3,826 | 10 ± 0 | 1.82E-04 | -12.43 | 0.0016 | 0.0259 |
| 7.78/453.17 | 5α-Androstan-3β,17α-diol disulfate | HMDB0240625 | 5-FU vs CTRL | Decreased | 55,008 ± 3,826 | 10 ± 0 | 1.82E-04 | -12.43 | 0.0016 | 0.0188 |
| 7.78/453.17 | 5α-Androstan-3β,17α-diol disulfate | HMDB0240625 | Dox vs CTRL | Decreased | 55,008 ± 3,826 | 10 ± 0 | 1.82E-04 | -12.43 | 0.0016 | 0.0119 |
| 9.71/222.18 | N-Isobutyl-2,4,8-decatrienamide | HMDB0030188 | 2-DG vs CTRL | Decreased | 98,264 ± 733 | 53,453 ± 3,634 | 5.44E-01 | -0.88 | 1.50E-03 | 0.0255 |
| 9.71/222.18 | N-Isobutyl-2,4,8-decatrienamide | HMDB0030188 | 5-FU vs CTRL | Decreased | 98,264 ± 733 | 10 ± 0 | 1.02E-04 | -13.26 | 1.85E-05 | 0.0061 |
| 7.58/453.37 | Oxidized cholesterol derivative | HMDB0260189 | 5-FU vs CTRL | Decreased | 103,633 ± 1,174 | 10 ± 0 | 9.65E-05 | -13.34 | 4.28E-05 | 0.0061 |
| 7.58/453.37 | Oxidized cholesterol derivative | HMDB0260189 | Dox vs CTRL | Decreased | 103,633 ± 1,174 | 10 ± 0 | 9.65E-05 | -13.34 | 4.28E-05 | 0.0020 |
| 7.58/288.25 | Octanoylcarnitine | HMDB0000791 | 5-FU vs CTRL | Decreased | 17,734 ± 371 | 10 ± 0 | 5.64E-04 | -10.79 | 1.46E-04 | 0.0086 |
| 7.58/288.25 | Octanoylcarnitine | HMDB0000791 | Dox vs CTRL | Decreased | 17,734 ± 371 | 10 ± 0 | 5.64E-04 | -10.79 | 1.46E-04 | 0.0037 |
| 5.03/397.19* | Pregnanediol | HMDB0004025 | Dox vs CTRL | Increased | 10 ± 0 | 9,534,300 ± 84,829 | 9.53E+05 | 19.86 | 2.64E-05 | 0.0017 |
| 1.65/191.01 | Oxalosuccinate | HMDB0304444 | 2-DG vs CTRL | Increased | 10 ± 0 | 203,671 ± 879 | 2.04E+04 | 14.31 | 6.21E-06 | 0.0019 |
| 7.17/254.21 | 5-OH-DPAT | HMDB0246834 | 5-FU vs CTRL | Decreased | 55,303 ± 5,414 | 10 ± 0 | 1.81E-04 | -12.43 | 0.0032 | 0.0267 |
| 7.17/254.21 | 5-OH-DPAT | HMDB0246834 | Dox vs CTRL | Decreased | 55,303 ± 5,414 | 10 ± 0 | 1.81E-04 | -12.43 | 0.0032 | 0.0165 |
| 9.38/619.5 | DG(i-15:0/0:0/20:4(5Z,7E,11Z,14Z)-OH(9)) | HMDB0298979 | 5-FU vs CTRL | Decreased | 201,343 ± 27,020 | 10 ± 0 | 4.97E-05 | -14.30 | 0.0060 | 0.0358 |
| 9.38/619.5 | DG(i-15:0/0:0/20:4(5Z,7E,11Z,14Z)-OH(9)) | HMDB0298979 | Dox vs CTRL | Decreased | 201,343 ± 27,020 | 10 ± 0 | 4.97E-05 | -14.30 | 0.0060 | 0.0231 |
| 7.52/230.21 | N1,N8-Diacetylspermidine | HMDB0041947 | 5-FU vs CTRL | Decreased | 22,994 ± 3,086 | 10 ± 0 | 4.35E-04 | -11.17 | 0.0060 | 0.0358 |
| 7.52/230.21 | N1,N8-Diacetylspermidine | HMDB0041947 | Dox vs CTRL | Decreased | 22,994 ± 3,086 | 10 ± 0 | 4.35E-04 | -11.17 | 0.0060 | 0.0231 |
The values in Table 1 represent the replicate LC-MS feature intensities for metabolites highlighted in the Results section. Fold change was calculated as the mean treatment intensity divided by the mean control intensity. Raw p-values were calculated using two-sided Welch’s t-tests, and FDR q-values were calculated using Benjamini-Hochberg correction across common LC-MS features for each treatment-control comparison. Metabolite annotations are putative and based on accurate mass/retention time matching to HMDB.
| Model | Samples entering model | Features | Latent components | R²Y | Q² (LOOCV) | LOOCV accuracy | Permutation p-value | VIP threshold |
|---|---|---|---|---|---|---|---|---|
| 2-DG vs CTRL | 6 (CTRL1–3; 2DG1–3) | 2,175 | 2 | 0.9996 | 0.8306 | 1.000 | 0.1 | VIP > 1.0 |
| 5-FU vs CTRL | 6 (CTRL1–3; FUDR1–3) | 2,175 | 2 | 0.9998 | 0.9530 | 1.000 | 0.1 | VIP > 1.0 |
| Dox vs CTRL | 6 (CTRL1–3; DOXR1–3) | 2,175 | 2 | 0.9999 | 0.9862 | 1.000 | 0.1 | VIP > 1.0 |
| Four-group model (CTRL, 2-DG, 5-FU, DOX) | 12 (all biological samples) | 2,175 | 3 | 0.9861 | 0.8269 | 1.000 | <0.0020 | VIP > 1.0 |
Note. PLS-DA models were generated using Progenesis-normalized LC-MS feature intensities, followed by log10 transformation and Pareto scaling prior to modeling. R²Y indicates model fit, and Q² LOOCV indicates leave-one-out cross-validation predictive performance. Permutation p-values refer to class-label permutation testing of Q². Binary models used exact exhaustive permutations preserving group sizes; the four-group model used 500 class-label permutations preserving group sizes. Because binary models contained only six samples, permutation p-values have limited resolution and should be interpreted cautiously. These PLS-DA models should be described as exploratory and supported by the univariate fold-change and significance values in Table 1. All models used 2,175 matched LC-MS features. Blank files were excluded from PLS-DA modeling. Metabolites with VIP > 1.0 were considered important contributors to group separation.
Conclusion
This study reveals many promising paths for future study. To strengthen observed trends, analysis can be expanded to include multiple fibroblast cell lines. Fibroblasts are often heterogeneous across tissues, and thus responses displayed in one model may not necessarily reflect those in other cellular or patient-derived systems. Additionally, to show how intercellular interactions can influence response to treatment and for a more physiologically relevant context, co-culture experimentation with cancer cells should be performed. Longitudinal studies that sample at multiple time points after treatment may reveal not only immediate but also delayed metabolic changes, allowing for more
in-depth views of drug action. Targeted validation of essential metabolic pathways identified in this study could reveal effects that contribute to treatment failure, such as mechanisms of drug resistance or off-target effects. Moreover, implementing a wider array of chemotherapies, including targeted therapies and immunotherapies, would allow comparisons across drug types to help charecterize fibroblast specific responses or vulnerabilities.
Despite the potential of this study’s preliminary observations, multiple limitations must be considered. Metabolic changes induced by treatment in fibroblasts may alter the tumor microenvironment by changing stromal support, modeling of the extracellular matrix, oxidative stress response, and paracrine signaling. These changes may potentially affect drug penetration, survival of cancer cells, and treatment resistance. However, these implications remain hypothesis-generating as this study used isolated fibroblast cultures and tentative metabolite matching. To determine whether fibroblast metabolic reprogramming directly affects patient outcomes and tumor remodeling, further co-culture, in vivo, and patient-derived studies should be conducted. Rather than using experimentally determined EC50 values in the present model, drug concentrations were chosen using published EC50/LD50 or half-maximal response ranges reported in fibroblast or related mammalian systems. This means that observed metabolomic differences, rather than being solely due to drug-specific metabolic reprogramming, may be partially attributed to differences in cell abundance, proliferation, extraction yield, or dynamic time-dependent responses. Direct evaluation of extraction efficiency and analytical recovery across samples is limited, as no exogenous internal standard was used during metabolite extraction. Finally, the absence of a tumor microenvironment context further limits the translational relevance, as fibroblast responses in vivo are significantly shaped by interactions with cancer cells, immune cells, and extracellular matrix components.
Together, these directions could significantly advance the field’s understanding of fibroblast metabolism in the context of cancer therapy, ultimately guiding strategies to minimize adverse effects and improve treatment efficacy.
Supplementary Information
References
- M. V. Plikus, X. Wang, S. Sinha, E. Forte, S. M. Thompson, E. L. Herzog, R. R. Driskell, N. Rosenthal, J. Biernaskie, V. Horsley. Fibroblasts: Origins, definitions, and functions in health and disease. Cell 2021, 184, 3852–3872. DOI: 10.1016/j.cell.2021.06.024. [↩]
- Narikawa, M.; Umemura, M.; Tanaka, R.; Hikichi, M.; Nagasako, A.; Fujita, T.; Yokoyama, U.; Ishigami, T.; Kimura, K.; Tamura, K.; Ishikawa, Y. Doxorubicin induces trans-differentiation and MMP1 expression in cardiac fibroblasts via cell death-independent pathways. PLoS ONE 2019, 14(9), e0221940. DOI: 10.1371/journal.pone.0221940. [↩]
- Guo, Z.; Zhang, H.; Fu, Y.; Kuang, J.; Zhao, B.; Zhang, L.; Lin, J.; Lin, S.; Wu, D.; Xie, G. Cancer-associated fibroblasts induce growth and radioresistance of breast cancer cells through paracrine IL-6. Cell Death Discovery 2023, 9, 9. DOI: 10.1038/s41420-023-01306-3. [↩]
- Patricelli, C.; Lehmann, P.; Oxford, J. T.; Pu, X. Doxorubicin-induced modulation of TGF-β signaling cascade in mouse fibroblasts: insights into cardiotoxicity mechanisms. Scientific Reports 2023, 13, 18944. DOI: 10.1038/s41598-023-46216-7. [↩]
- A. Ophir. Effects of 5-fluorouracil on proliferating fibroblasts in vivo. Experimental Eye Research 1991, 53, 799–803. DOI: 10.1016/0014-4835(91)90116-V. [↩]
- Xu, Y.; He, X.; Wang, Y.; Jian, J.; Peng, X.; Zhou, L.; Kang, Y.; Wang, T. 5-Fluorouracil reduces the fibrotic scar via inhibiting matrix metalloproteinase 9 and stabilizing microtubules after spinal cord injury. CNS Neuroscience & Therapeutics 2022, 28, 1854–1869. DOI: 10.1111/cns.13930. [↩]
- Aft, R. L.; Zhang, F. W.; Gius, D. Evaluation of 2-deoxy-D-glucose as a chemotherapeutic agent: mechanism of cell death. British Journal of Cancer 2002, 87, 805–812. DOI: 10.1038/sj.bjc.6600547. [↩]
- H. Xian, Y. Wang, X. Bao, H. Zhang, F. Wei, Y. Song, Y. Wang, Y. Wei, Y. Wang. Hexokinase inhibitor 2-deoxyglucose coordinates citrullination of vimentin and apoptosis of fibroblast-like synoviocytes by inhibiting HK2/mTORC1-induced autophagy. International Immunopharmacology 2023, 118, 110111. DOI: 10.1016/j.intimp.2022.109556. [↩]
- Nobari, S.; Najafi, R.; Mahdavinezhad, A.; Jalali, A.; Amini, R. The combination of zerumbone with 5-fluorouracil for sensitizing colorectal cancer-associated fibroblasts to treatment. BioMed Research International 2022, 2022, 9369328. DOI: 10.1155/2022/9369328. [↩]
- Gu, Y.; Yang, R.; Zhang, Y.; Guo, M.; Takehiro, K.; Zhan, M.; Yang, L.; Wang, H. Molecular mechanisms and therapeutic strategies in overcoming chemotherapy resistance in cancer. Mol. Biomed. 2025, 6, 2. DOI: 10.1186/s43556-024-00239-2. [↩]
- Roszkowska, M. Multilevel mechanisms of cancer drug resistance. Int. J. Mol. Sci. 2024, 25, 12402. DOI: 10.3390/ijms252212402. [↩]
- Eslami, M.; Memarsadeghi, O.; Davarpanah, A.; Arti, A.; Nayernia, K.; Behnam, B. Overcoming chemotherapy resistance in metastatic cancer: A comprehensive review. Biomedicines 2024, 12, 183. DOI: 10.3390/biomedicines12010183. [↩]
- Zhu, Y.; Li, X.; Wang, L.; Hong, X.; Yang, J. Metabolic reprogramming and crosstalk of cancer-related fibroblasts and immune cells in the tumor microenvironment. Frontiers in Endocrinology 2022, 13, 988295. DOI: 10.3389/fendo.2022.988295. [↩]
- Chang, Y.; Lee, J. W. N.; Holle, A. W. The mechanobiology of fibroblast activation in disease. APL Bioeng. 2025, 9, 021505. DOI: 10.1063/5.0272393. [↩]
- N. Biffi, D. Tuveson. Diversity and biology of cancer-associated fibroblasts. Physiological Reviews 2021, 101, 147–176. DOI: 10.1152/physrev.00048.2019. [↩]
- L. W. Sumner, A. Amberg, D. Barrett, M. H. Beale, R. Beger, C. A. Daykin, T. W.-M. Fan, O. Fiehn, R. Goodacre, J. L. Griffin, T. Hankemeier, N. Hardy, J. Harnly, R. Higashi, J. Kopka, A. N. Lane, J. C. Lindon, P. Marriott, A. W. Nicholls, M. D. Reily, J. J. Thaden, M. R. Viant. Proposed minimum reporting standards for chemical analysis: Chemical Analysis Working Group (CAWG) Metabolomics Standards Initiative (MSI). Metabolomics 2007, 3, 211–221. DOI: 10.1007/s11306-007-0082-2. [↩]
- Mosley, J. D.; Dunn, W. B.; Kuligowski, J.; Lewis, M. R.; Monge, M. E.; Ulmer Holland, C.; Vuckovic, D.; Zanetti, K. A.; Schock, T. B. Metabolomics 2023 workshop report: moving toward consensus on best QA/QC practices in LC–MS-based untargeted metabolomics. Metabolomics 2024, 20, 75. DOI: 10.1007/s11306-024-02135-w. [↩]
- T. Lanišnik Rižner, M. Gjorgoska. Steroid sulfatase and sulfotransferases in the estrogen and androgen action of gynecological cancers: current status and perspectives. Essays in Biochemistry 2024, 68, 411–422. DOI: 10.1042/EBC20230096. [↩]
- W. Zhou, T. Yan, Z. Hu, J. Wu, Y. Zhou, L. Xie, J. Yu, W. Zhang, X. Liu. Causal relationships between immune cells, plasma metabolites and lung adenocarcinoma: A two-step, two-sample Mendelian randomization study. Journal of Cancer 2024, 15, 6698–6709. DOI: 10.7150/jca.102760. [↩]
- J. Wang, J. Zhang, M. Xiao, S. Wang, J. Wang, Y. Guo, Y. Tang, J. Gu. Molecular mechanisms of doxorubicin-induced cardiotoxicity: novel roles of sirtuin 1-mediated signaling pathways. Cell & Molecular Life Sciences 2021, 78, 3105–3125. DOI: 10.1007/s00018-020-03729-y [↩]
- S. Gorini, A. De Angelis, L. Berrino, N. Malara, G. Rosano, E. Ferraro. Chemotherapeutic drugs and mitochondrial dysfunction: Focus on doxorubicin, trastuzumab, and sunitinib. Oxidative Medicine and Cellular Longevity 2018, 2018, 1–15. DOI: 10.1155/2018/7582730. [↩]
- M. L. Sweat, B. I. Grosser, D. L. Berliner, H. E. Swim, C. J. Nabors, T. F. Dougherty. The metabolism of cortisol and progesterone by cultured uterine fibroblasts, strain U12-705. Biochimica et Biophysica Acta 1958, 28, 591–596. DOI: 10.1016/0006-3002(58)90527-3. [↩]
- Q. He, J. Chen, Z. Xie, Z. Chen. Wild-type isocitrate dehydrogenase-dependent oxidative decarboxylation and reductive carboxylation in cancer and their clinical significance. Cancers (Basel) 2022, 14, 1–14. DOI: 10.3390/cancers14235779. [↩]
- K. Kolczynska, A. Loza-Valdes, I. Hawro, G. Sumara. Diacylglycerol-evoked activation of PKC and PKD isoforms in regulation of glucose and lipid metabolism: A review. Lipids in Health and Disease 2020, 19, 1–15. DOI: 10.1186/s12944-020-01286-8. [↩]
- Holbert, C. E.; Cullen, M. T.; Casero, R. A., Jr.; Murray Stewart, T. Polyamines in cancer: integrating organismal metabolism and antitumour immunity. Nature Reviews Cancer 2022, 22, 467–480. DOI: 10.1038/s41568-022-00473-2. [↩]
- E. T. Alexander, A. Minton, M. C. Peters, O. Phanstiel, IV, S. K. Gilmour. A novel polyamine blockade therapy activates an anti-tumor immune response. Oncotarget 2017, 8, 84140–84152. [↩]