Abstract
Background/Objectives: The rapid expansion of artificial intelligence (AI) workloads is increasing the power density and thermal-management burden of data centers. This study evaluates whether a hybrid small modular reactor (SMR), solar photovoltaic (PV), battery-storage, and advanced-cooling configuration can internally balance high-density AI demand under clearly stated modelling assumptions.
Methods: A deterministic, scenario-based model was developed using rack-level demand estimation, a full 24-hour hourly dispatch simulation, solar-output assumptions, battery sizing, reliability-aware SMR capacity sizing, cooling-linked power usage effectiveness (PUE), and a weighted multi-criteria decision analysis. The model is explicitly conceptual: it explores supply-demand consistency and parameter sensitivity, but it does not validate commercial or regulatory feasibility.
Results: Under the baseline scenario, the SMR provides a constant 70 MW baseload and solar PV contributes up to 58 MW during midday. The hourly dispatch identifies a maximum shortfall of 9 MW and a total daily deficit of 19 MWh, implying an indicative battery requirement of approximately 24.3 MWh after round-trip efficiency and reserve adjustment. Rack-density sensitivity shows that demand rises from 16.8 MW to 56.0 MW for a 500-rack facility when density increases from 30 to 100 kW/rack. Immersion cooling yields the highest assumed useful IT share across the tested density range.
Conclusions: The model suggests that hybrid SMR-renewable systems may be promising for high-density AI data centers, but the findings are assumption-dependent and require validation using measured load traces, location-specific solar data, reactor availability data, lifecycle emissions, licensing analysis, and cost modelling.
Keywords: artificial intelligence data centers; small modular reactors; SMR; hybrid energy systems; immersion cooling; power usage effectiveness; battery storage; lifecycle carbon.
Introduction
Artificial intelligence (AI) is transforming the computing infrastructure with training and inference workloads more and more shifting to dense GPU- and accelerator-based clusters. Large-scale AI workloads can be run continuously, generate peaks of heat in the training and inference phases, and focus heat in a compact physical space, unlike many traditional enterprise workloads. Energy analyses have recently shown that the demand for electricity in data centers is projected to increase significantly until 2030, and AI workloads will be one of the factors behind the increase1,2.
The energy conundrum is all about power density. AI and high-performance computing clusters may require rack densities significantly higher than what is typically found in conventional data-center racks, which are often designed based on relatively low average loads. This paper does not overgeneralise from one assumption, as there are still a lot of “stress cases” with very high-density racks that are not evenly distributed across real installations, and as such introduces sensitivity cases for 30 and 60 kW/rack as well as the 100 kW/rack stress case3,4.
While renewable energy can help cut down on operating emissions, solar and wind power are intermittent and can’t always provide a reliable critical load for high density data centers without battery storage, back-up power or the grid. Nuclear power is thus being considered as a potential firm low-operational-carbon source for data centers, including small modular reactors (SMRs). But there is also the uncertainty of cost, licensing process, public acceptability, waste management, and risks associated with the first-of-a-kind projects5,6,7,8 for SMR deployment.
This paper therefore revisits the original study as a modelling-based assessment rather than a validated deployment framework. This analysis does not purport to be a proof of concept, economic or regulatory for SMR-powered AI data centres. Rather, it poses the question of whether a clear deterministic model can be used to uncover assumptions, sensitivities, and compromises that need to be addressed before it can be deemed feasible to have such systems.
Research Questions and Hypothesis
Research Question 1: Under stated deterministic assumptions, how does a hybrid SMR-solar-battery configuration balance hourly AI data-center demand across a 24-hour operating cycle?
Research Question 2: How sensitive is estimated facility demand to rack power density when moderate, high, and extreme AI-density scenarios are compared?
Research Question 3: How do reliability weighting, cooling technology, battery sizing, lifecycle-carbon considerations, and regulatory risk affect the comparative interpretation of SMR-based configurations?
Hypothesis: Under high rack-density assumptions, a hybrid SMR-renewable configuration will produce a higher modelled composite score than standalone grid/fossil or solar-storage configurations; however, the ranking will remain assumption-dependent and should not be interpreted as empirical proof of feasibility.
Methodology
Research Design and Modelling Boundary
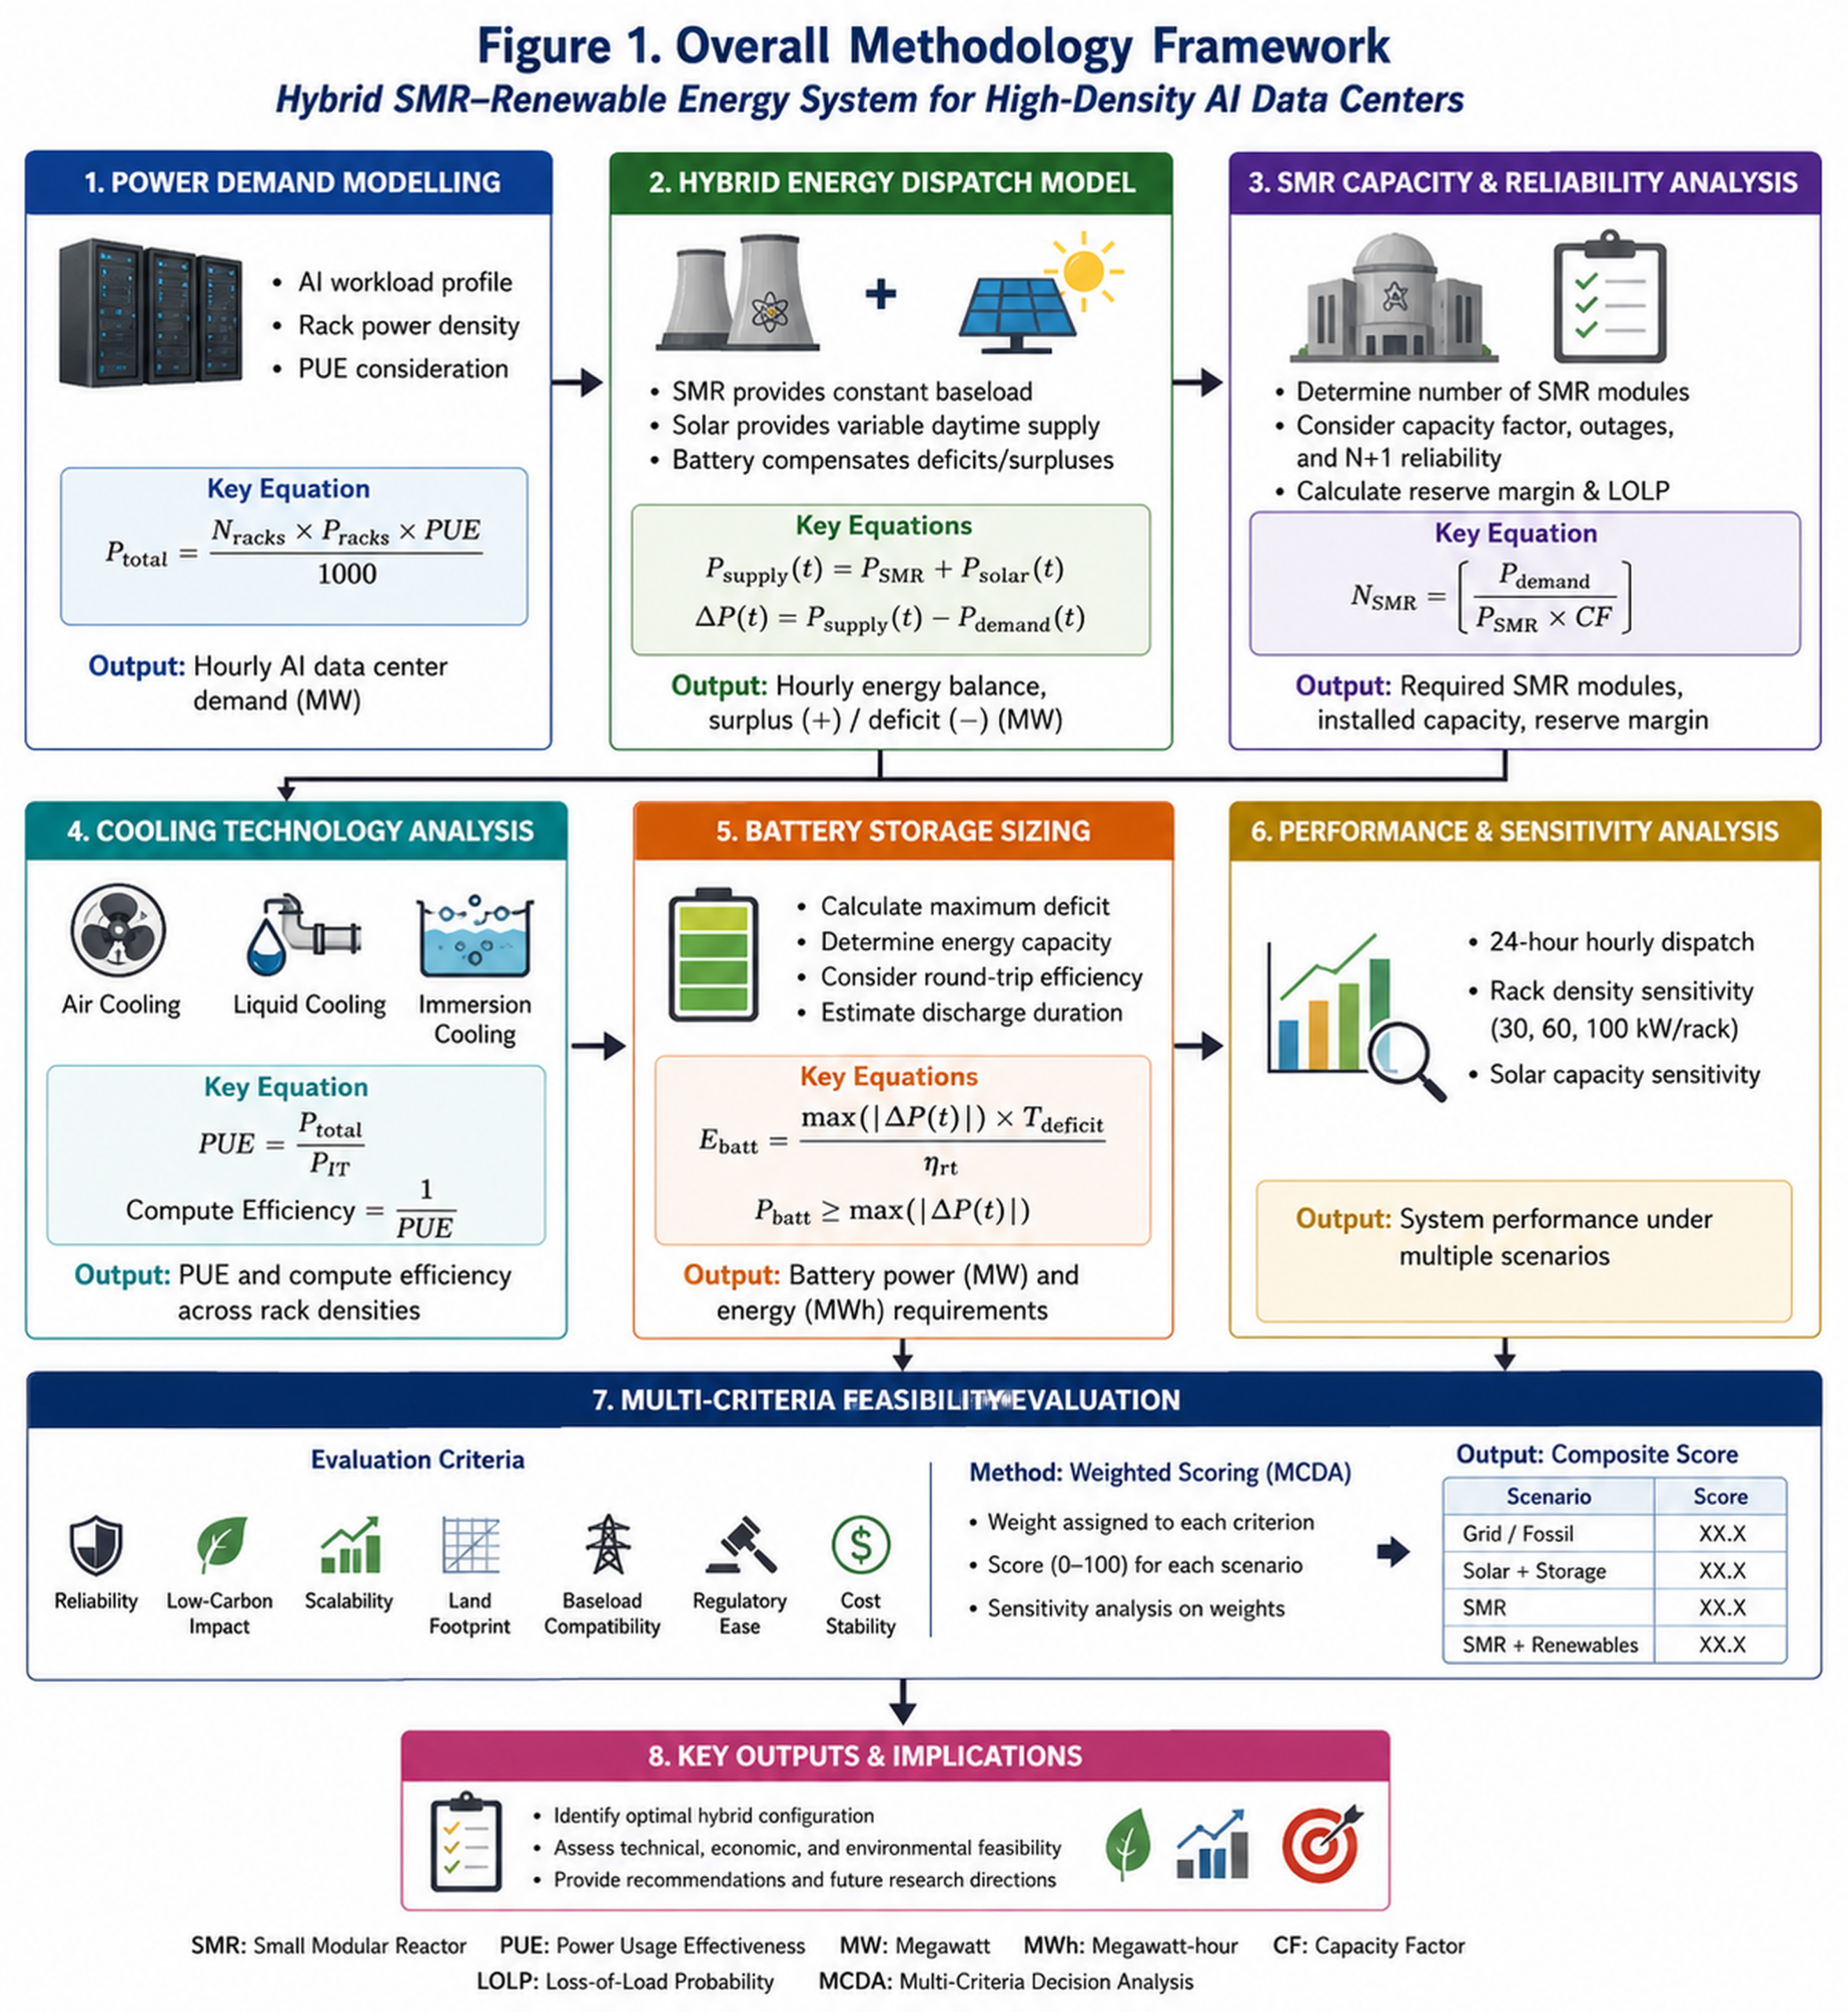
This study is based on a deterministic system level scenario model. The outputs are created from declared inputs, thus the model can test the internal consistency, identify gaps, and compare the model sensitivity for its parameters. It can’t prove in isolation real world reliability, economic superiority, licensing approval, or public acceptance. Empirical load traces, site-specific solar resource data, vendor-specific reactor performance, probabilistic reliability modelling, lifecycle emissions analysis and site-specific cost estimates (Table 1-Figure 1) would be needed to support such claims.
| Input category | Assumed value | Purpose / limitation |
| Rack density scenarios | 30, 60 and 100 kW/rack | Sensitivity cases rather than a single fixed assumption |
| Facility PUE baseline | 1.12 | Represents high-efficiency liquid/immersion-enabled facility design; PUE remains a multiplier in demand calculation |
| SMR baseload | 70 MW in dispatch model | Assumed constant output for exploratory dispatch only |
| SMR module size | 77 MW nameplate | Used for modular capacity-sizing examples |
| Availability derating | 90% firm-capacity derating | Illustrative derating to avoid treating nameplate power as always available |
| Solar profile | 58 MW peak; sinusoidal daylight curve | Hourly assumed PV output; must be replaced by site-specific irradiance data in future work |
| Battery round-trip efficiency | 90% | Used to convert modelled deficit into indicative installed energy requirement |
| Battery reserve factor | 15% | Added contingency allowance for the daily deficit |
AI Data Center Power Demand Model
Facility demand is estimated from rack count, rack density, and PUE. In this equation, PUE is a multiplier: a higher PUE represents less efficient overhead and therefore increases total facility demand9,10,11,12,13. The division by 1000 converts kilowatts to megawatts.
(1)
where is total facility demand in MW, N_racks is the number of racks, is rack power in kW/rack, and PUE is the ratio of total facility power to IT power.
Solar and Dispatch Model
To improve reproducibility, the model defines a simple hourly solar profile rather than using selected point estimates only14,15,16,17. The exploratory PV profile follows a daylight sinusoidal approximation and is capped at a 58 MW peak output. This is not a substitute for location-specific irradiance modelling; future validation should use tools such as PVWatts or measured solar-resource data18,19,20,21,22.
(2)
(3)
(4)
A positive Delta P(t) is surplus supply that could be curtailed, stored, or redirected. A negative Delta P(t) is an hourly deficit that must be served by battery storage, grid import, demand response, or another firm backup source23,24,25.
Battery Backup Sizing
Battery sizing is estimated from the hourly deficits rather than only reporting a single backup power value. The indicative installed energy capacity is calculated as:
(5)
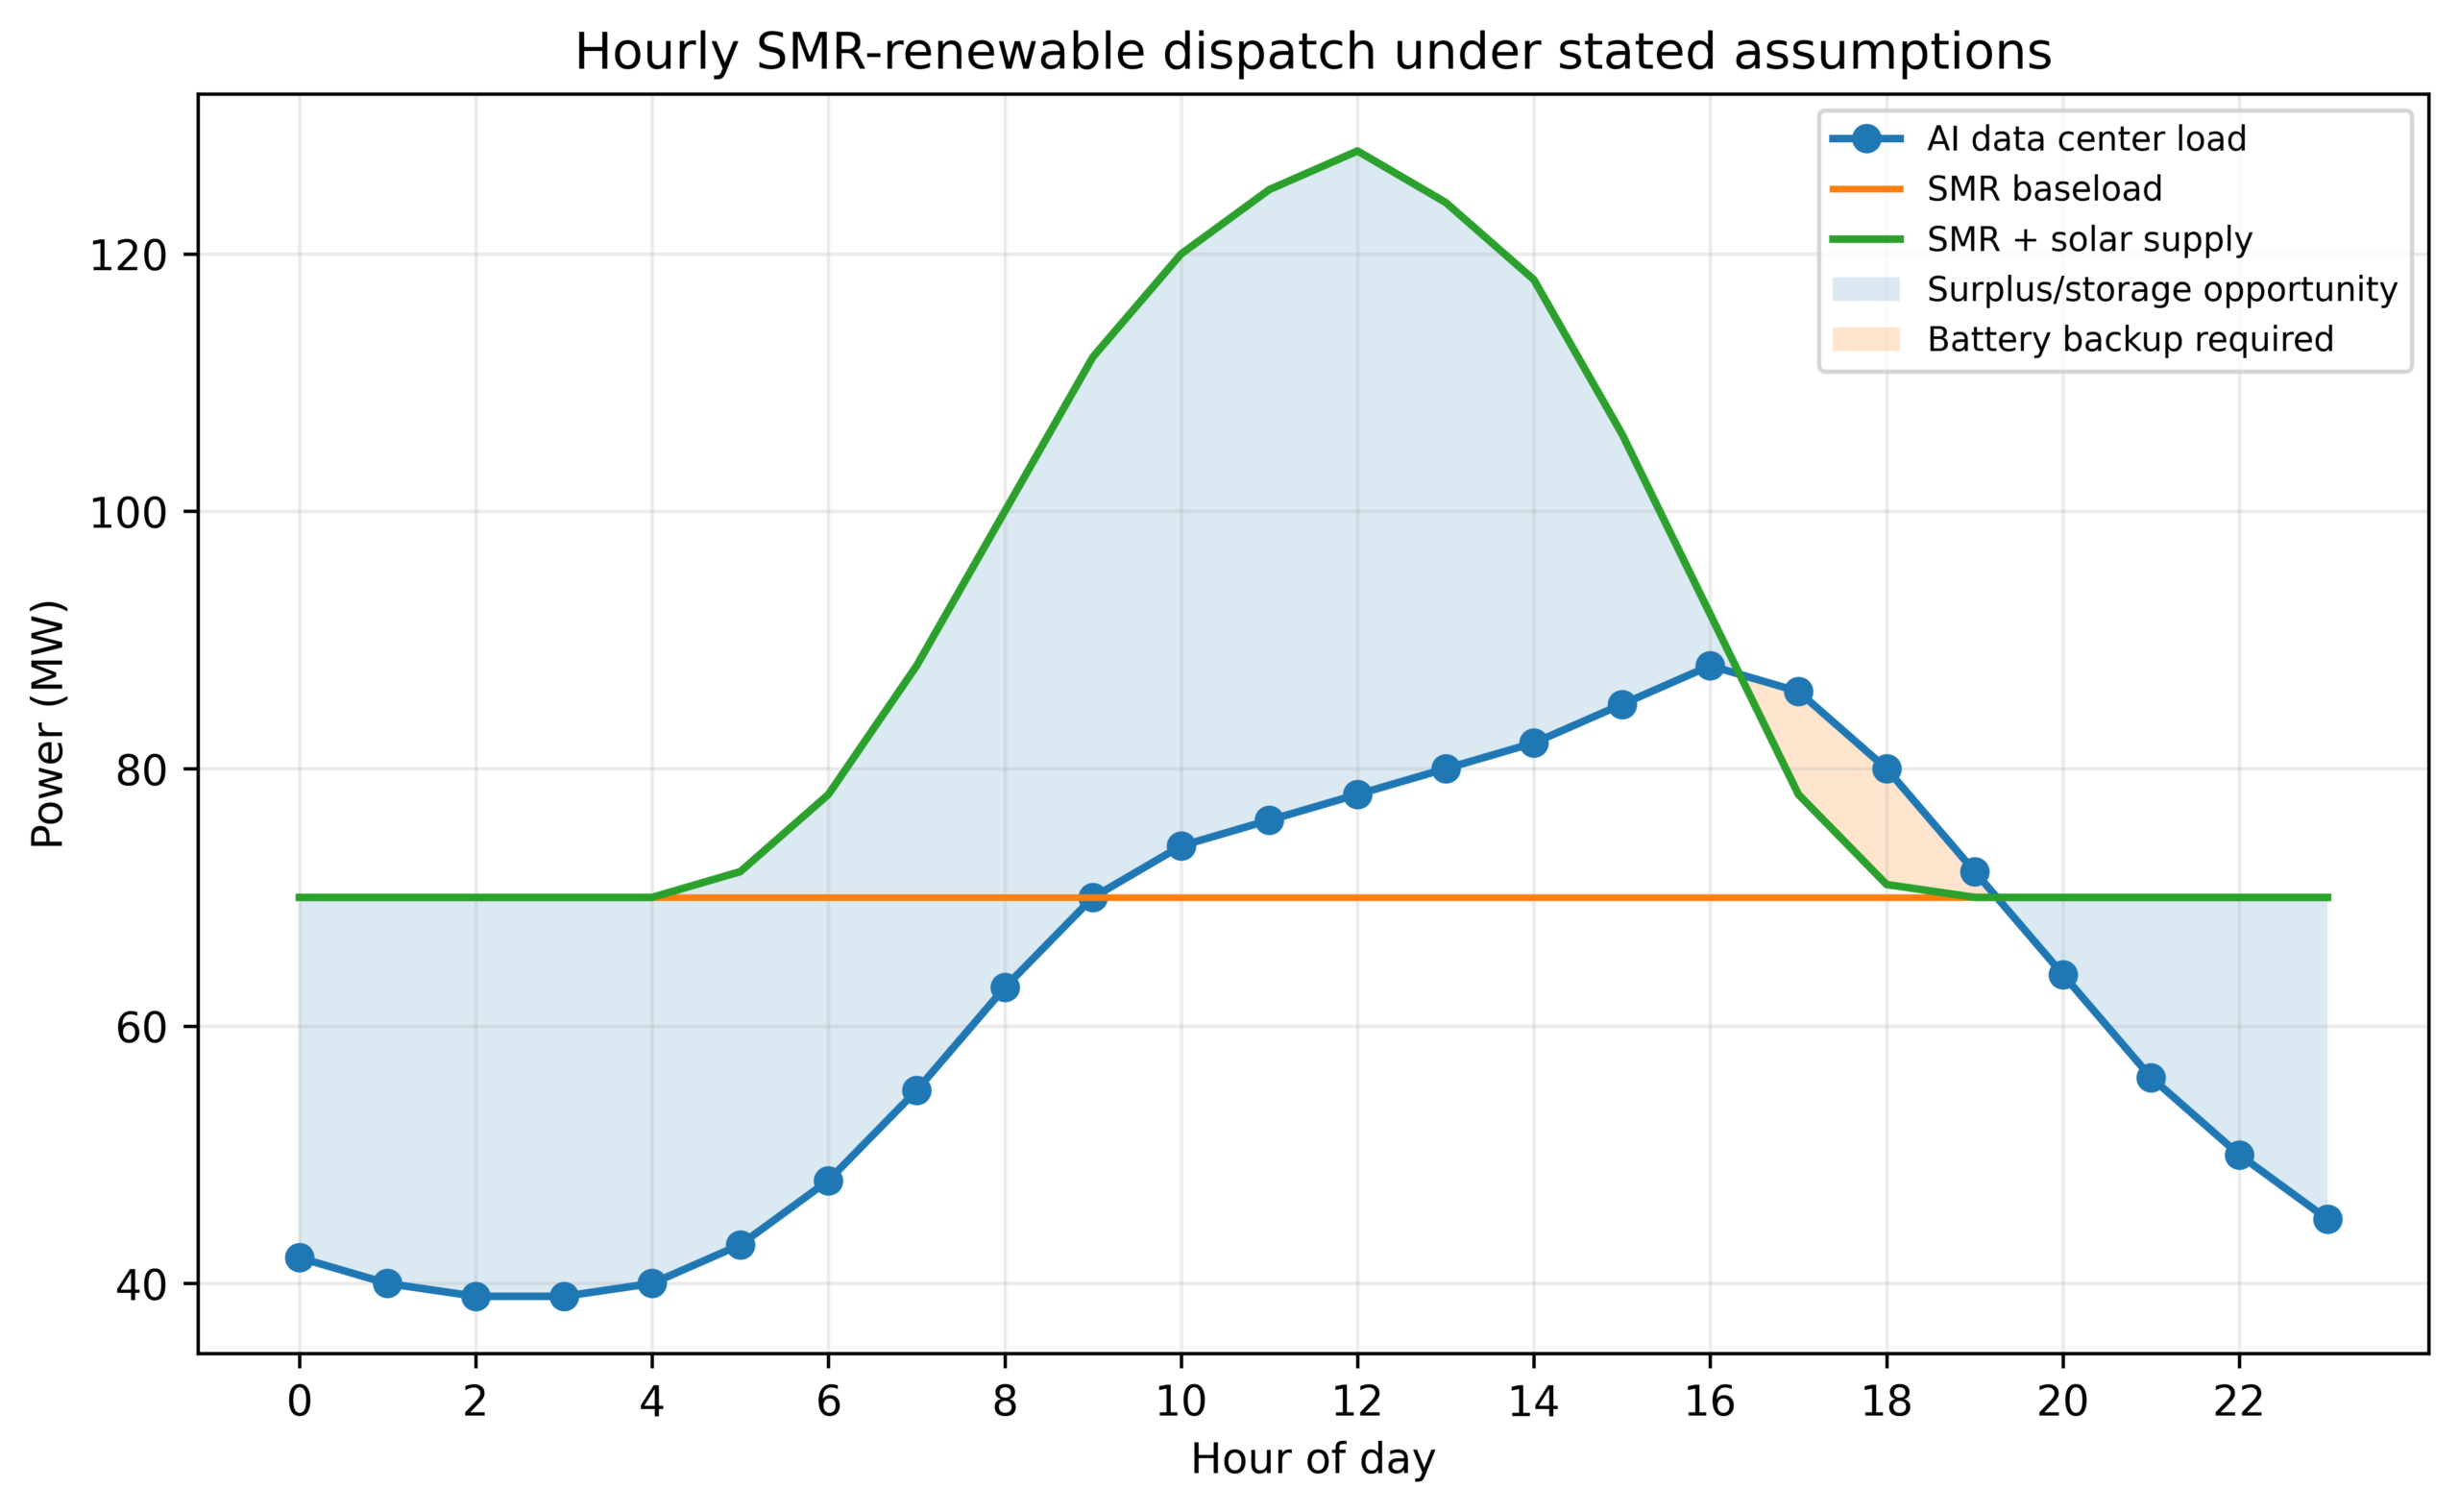
For the baseline hourly profile, the total raw deficit is 19.0 MWh, the maximum discharge power is 9.0 MW, and the indicative installed battery energy is 24.3 MWh after applying 90% round-trip efficiency and a 15% contingency reserve. This is an operational sizing approximation; it excludes degradation, replacement cycles, fire-safety design, land area, grid-service revenue, and detailed cost modelling.
Reliability-Aware SMR Capacity Sizing
The sizing model avoids treating nameplate SMR capacity as continuously available. A 90% firm-capacity derating is applied to each 77 MW module, and an N+1 criterion is added so that critical load can still be served after one module is unavailable. This does not replace probabilistic reliability metrics such as loss-of-load probability, but it is a more conservative screening method than nameplate-only sizing.
(6)
(7)
Cooling Efficiency Model
Cooling performance is represented through PUE-linked useful IT compute share. The values are scenario assumptions informed by the cooling literature and should be replaced with measured PUE data for a specific data-center design18,19,20,21,22,23,24,25.
(8)
Weighted Multi-Criteria Decision Analysis
The original equal-average feasibility score has been evaluating to a transparent weighted scoring approach. Scores remain semi-quantitative estimates rather than empirical measurements. Reliability and baseload fit receive higher weights because mission-critical AI data centers place strong value on power continuity. The analysis therefore reports the ranking as a modelled screening outcome, not as proof of superiority.
(9)
The scoring rubric is: 0-20 = very weak, 21-40 = weak, 41-60 = moderate, 61-80 = strong, and 81-100 = very strong. Sensitivity checks are used to show whether rankings change under alternative weights.
Results
Full 24-Hour Dispatch Results
The hourly dispatch replaces the previous ten-point snapshot. Under the baseline assumptions, most daylight hours produce surplus supply, while evening hours 17-19 produce the only deficits in this illustrative day. These results reflect the selected assumptions and should not be interpreted as measured system behaviour.
| Hour | AI load (MW) | SMR (MW) | Solar (MW) | Battery backup (MW) | Surplus/storage (MW) |
| 0 | 42 | 70 | 0 | 0 | 28 |
| 1 | 40 | 70 | 0 | 0 | 30 |
| 2 | 39 | 70 | 0 | 0 | 31 |
| 3 | 39 | 70 | 0 | 0 | 31 |
| 4 | 40 | 70 | 0 | 0 | 30 |
| 5 | 43 | 70 | 2 | 0 | 29 |
| 6 | 48 | 70 | 8 | 0 | 30 |
| 7 | 55 | 70 | 18 | 0 | 33 |
| 8 | 63 | 70 | 30 | 0 | 37 |
| 9 | 70 | 70 | 42 | 0 | 42 |
| 10 | 74 | 70 | 50 | 0 | 46 |
| 11 | 76 | 70 | 55 | 0 | 49 |
| 12 | 78 | 70 | 58 | 0 | 50 |
| 13 | 80 | 70 | 54 | 0 | 44 |
| 14 | 82 | 70 | 48 | 0 | 36 |
| 15 | 85 | 70 | 36 | 0 | 21 |
| 16 | 88 | 70 | 22 | 0 | 4 |
| 17 | 86 | 70 | 8 | 8 | 0 |
| 18 | 80 | 70 | 1 | 9 | 0 |
| 19 | 72 | 70 | 0 | 2 | 0 |
| 20 | 64 | 70 | 0 | 0 | 6 |
| 21 | 56 | 70 | 0 | 0 | 14 |
| 22 | 50 | 70 | 0 | 0 | 20 |
| 23 | 45 | 70 | 0 | 0 | 25 |
Rack-Density Sensitivity
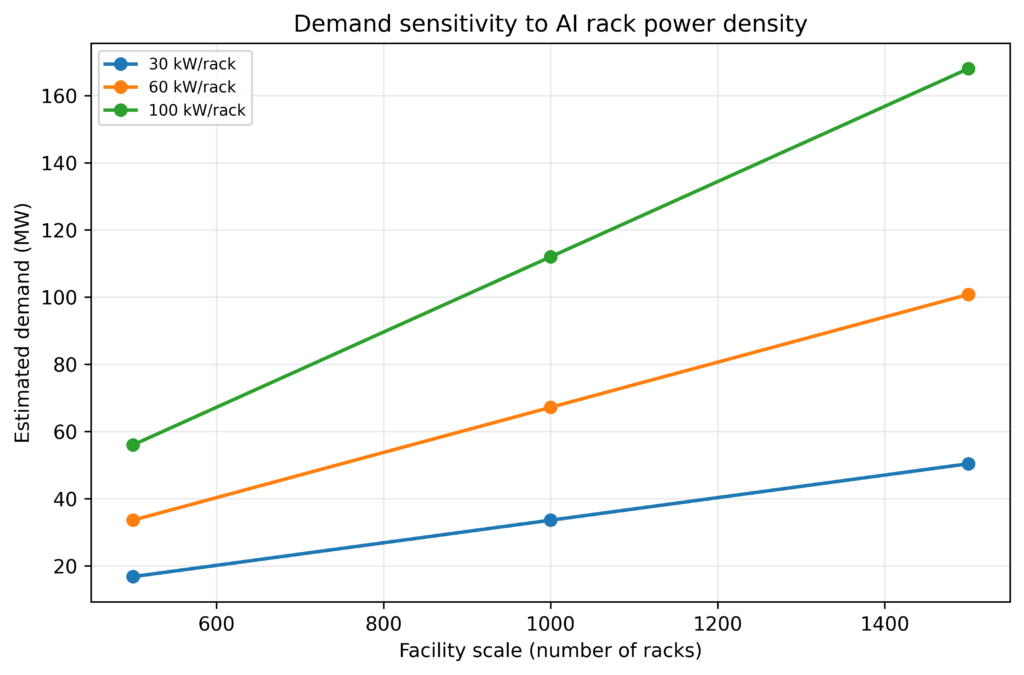
The analysis adds rack-density sensitivity to avoid relying only on the 100 kW/rack stress case. At PUE = 1.12, a 500-rack facility requires 16.8 MW at 30 kW/rack, 33.6 MW at 60 kW/rack, and 56.0 MW at 100 kW/rack. This demonstrates that siting and energy-supply conclusions depend strongly on the assumed density of AI hardware deployment.
| Facility scale | 30 kW/rack demand (MW) | 60 kW/rack demand (MW) | 100 kW/rack demand (MW) |
| 500 racks | 16.8 | 33.6 | 56.0 |
| 1000 racks | 33.6 | 67.2 | 112.0 |
| 1500 racks | 50.4 | 100.8 | 168.0 |
Reliability-Aware SMR Sizing
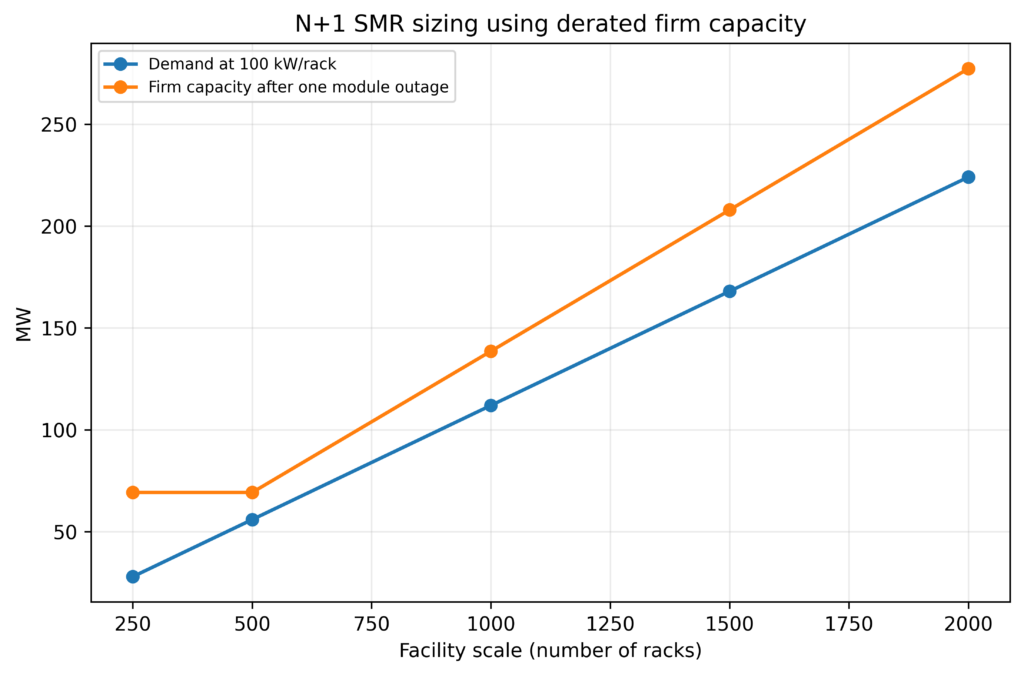
When firm capacity and N+1 reserve are considered, additional modules are required compared with a simple nameplate-capacity calculation. The 250-rack case remains heavily over-served, suggesting that SMR deployment may be more practical for campuses, multi-tenant energy parks, or facilities sharing power with the grid rather than isolated small data centers. At the 2000-rack scale, the N+1 approach avoids the previously weak 3.1% nameplate-only reserve margin.
| Racks | Demand (MW) | Normal modules | N+1 modules | Installed nameplate (MW) | Firm after one outage (MW) | Reserve after outage (%) |
| 250 | 28.0 | 1 | 2 | 154 | 69.3 | 147.5 |
| 500 | 56.0 | 1 | 2 | 154 | 69.3 | 23.7 |
| 1000 | 112.0 | 2 | 3 | 231 | 138.6 | 23.7 |
| 1500 | 168.0 | 3 | 4 | 308 | 207.9 | 23.7 |
| 2000 | 224.0 | 4 | 5 | 385 | 277.2 | 23.7 |
Cooling-Linked Compute Efficiency
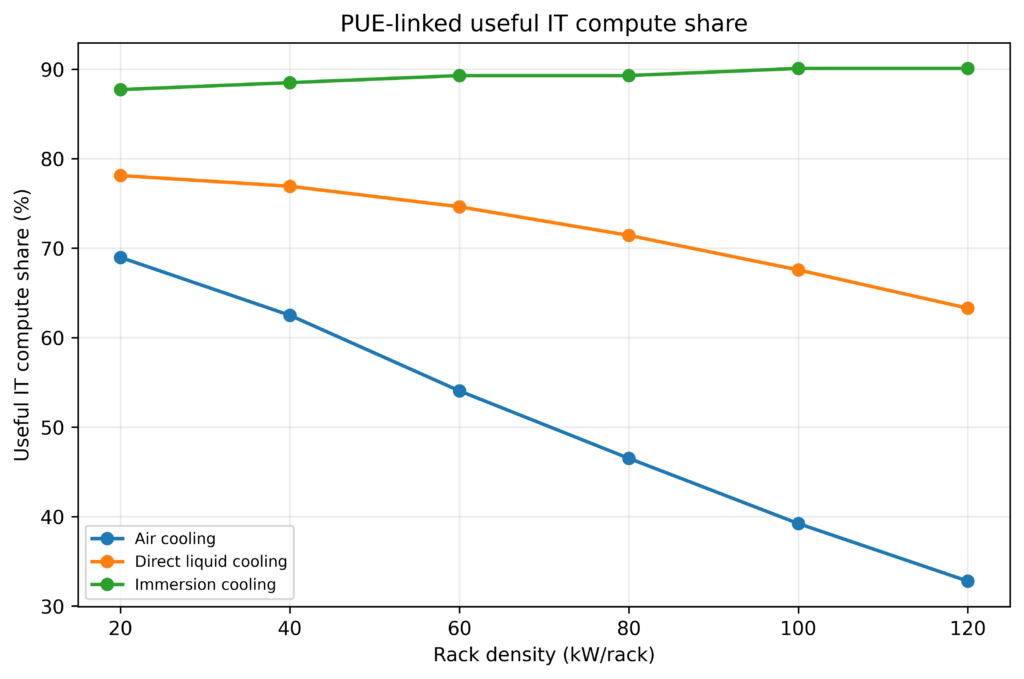
The cooling results should be read as a PUE-based scenario comparison, not a measured result. Air cooling becomes less favourable at high rack densities because rising airflow and temperature-gradient requirements increase overhead. Direct liquid cooling performs better, while immersion cooling has the highest assumed useful IT share across the tested range. The claim is therefore softened from “immersion cooling proves superior” to “under the assumed PUE values, immersion cooling yields the highest useful IT share.”
| Rack density | Air PUE | Air IT % | Liquid PUE | Liquid IT % | Immersion PUE | Immersion IT % |
| 20 | 1.45 | 68.97 | 1.28 | 78.12 | 1.14 | 87.72 |
| 40 | 1.6 | 62.5 | 1.3 | 76.92 | 1.13 | 88.5 |
| 60 | 1.85 | 54.05 | 1.34 | 74.63 | 1.12 | 89.29 |
| 80 | 2.15 | 46.51 | 1.4 | 71.43 | 1.12 | 89.29 |
| 100 | 2.55 | 39.22 | 1.48 | 67.57 | 1.11 | 90.09 |
| 120 | 3.05 | 32.79 | 1.58 | 63.29 | 1.11 | 90.09 |
Weighted Feasibility Screening
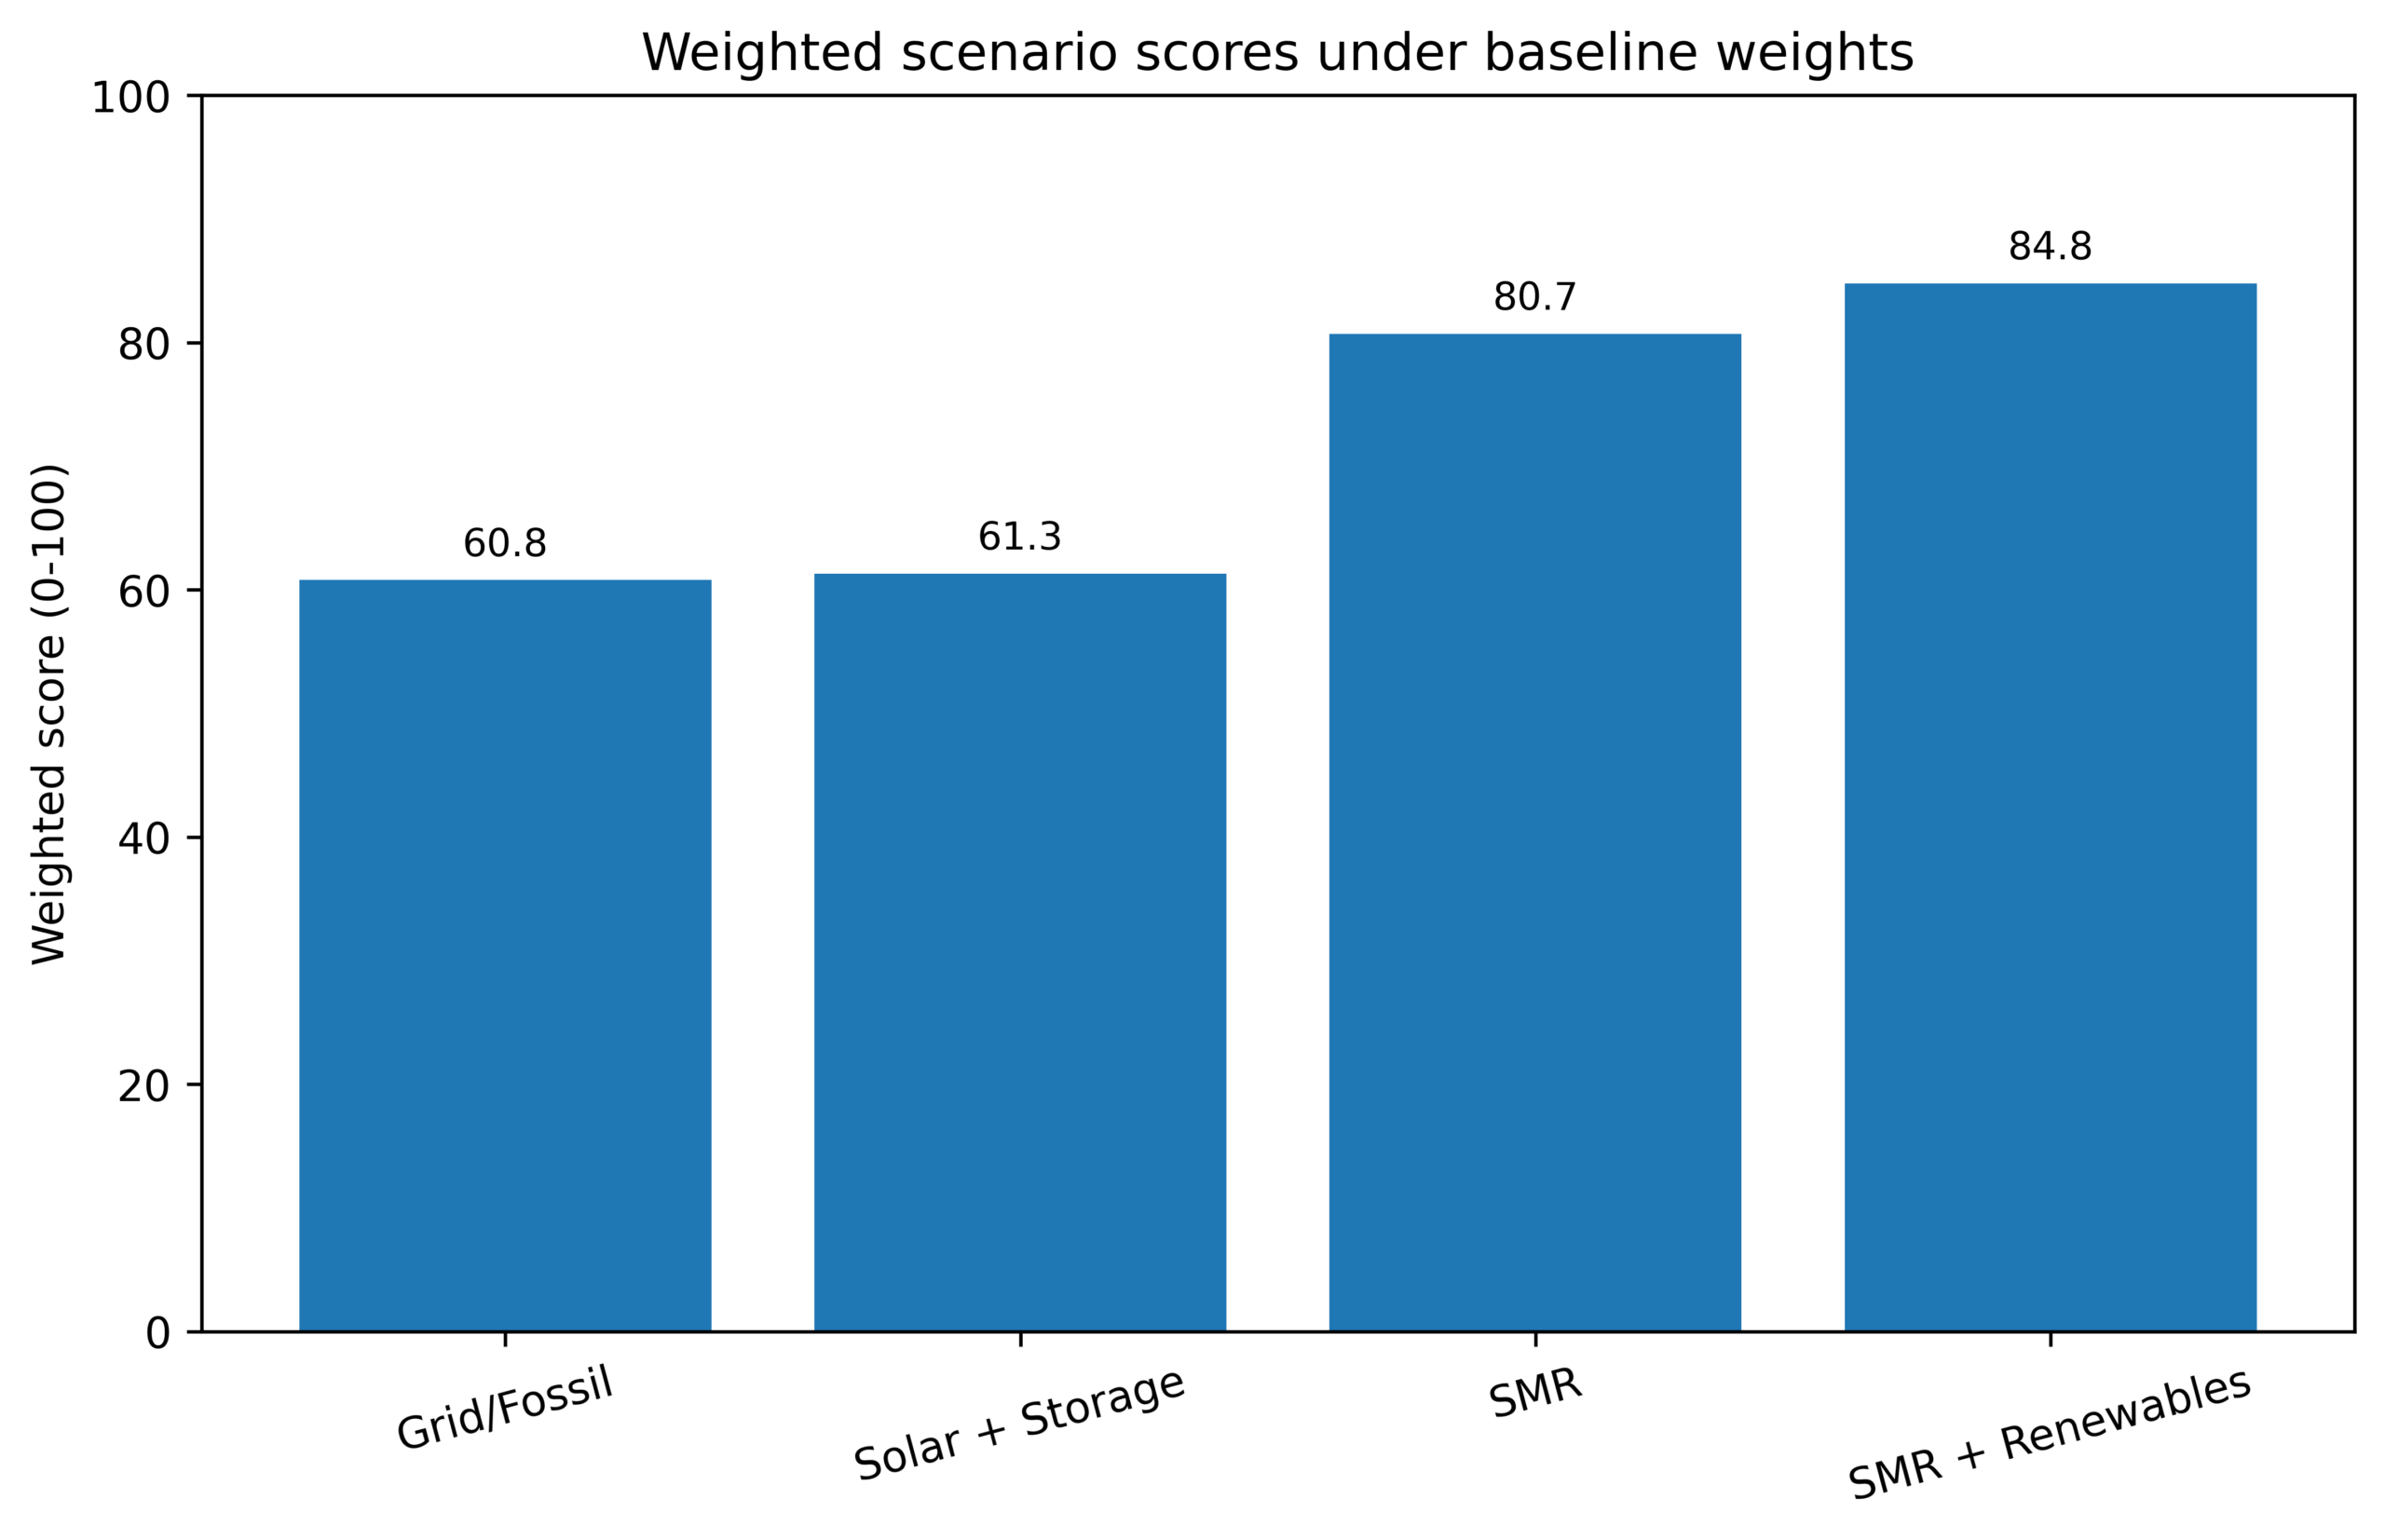
The feasibility analysis replaces the unqualified average score with a weighted MCDA screening. The hybrid SMR-renewable option obtains the highest baseline weighted score (84.8), followed by standalone SMR (80.7), solar + storage (61.3), and grid/fossil (60.8). Because the scores are semi-quantitative and uncertain, differences should be interpreted as screening indicators rather than statistically significant proof.
| Criterion | Weight | Grid/Fossil | Solar + Storage | SMR | SMR + Renewables |
| Reliability | 0.25 | 65 | 60 | 90 | 92 |
| Baseload fit | 0.2 | 75 | 45 | 95 | 94 |
| Low-carbon lifecycle | 0.15 | 25 | 85 | 80 | 90 |
| Scalability | 0.15 | 70 | 65 | 82 | 90 |
| Cost stability | 0.1 | 45 | 55 | 70 | 75 |
| Land footprint | 0.05 | 55 | 35 | 88 | 80 |
| Regulatory feasibility | 0.1 | 80 | 75 | 35 | 45 |
| Weighted total | 1.00 | 60.8 | 61.3 | 80.7 | 84.8 |
Weight Sensitivity and Cost Screening
The sensitivity analysis reveals that the hybrid configuration is still high ranking, both when assuming baseline conditions and when assuming a high level of reliability, but the difference between SMR and SMR + renewables is not sufficient to conclude on the superiority of the SMR without external validation. SMR-based scores are lowered by regulatory and cost assumptions, which represent deployment risk.
| Weighting case | Grid/Fossil | Solar + Storage | SMR | SMR + Renewables |
| Baseline weights | 60.8 | 61.3 | 80.7 | 84.8 |
| Reliability-heavy | 63.0 | 55.0 | 83.0 | 87.0 |
| Cost/regulatory-heavy | 66.0 | 66.5 | 71.0 | 75.0 |
| Carbon-heavy | 55.0 | 69.0 | 81.0 | 85.0 |
| Configuration | CAPEX risk | OPEX / fuel risk | LCOE uncertainty | Main cost limitation |
| Grid/Fossil | Low-medium | High fuel and carbon exposure | Medium | Emissions exposure and grid-capacity upgrades |
| Solar + Storage | Medium | Low fuel cost; battery replacement risk | Medium-high | Large storage requirement for firm 24/7 load |
| SMR | High | Low fuel volatility; high fixed cost | High | First-of-a-kind construction, licensing and financing risk |
| SMR + Renewables | Very high | Diversified but complex | High | Integration cost across nuclear, PV, battery and cooling systems |
Discussion
Interpretation of the Model
The results show that the hybrid SMR-solar-battery configuration can satisfy the illustrative daily load profile under the selected assumptions, but this is not the same as demonstrating operational feasibility. The constant SMR baseload, the solar curve, the PUE values and the feasibility scores are inputs or scenario assumptions. Therefore, the correct interpretation is that the model identifies the scale of balancing, backup and sensitivity issues that would need to be validated in a real project.
The 24-hour dispatch analysis improves transparency by showing all hourly surpluses and deficits. The key output is not that SMRs automatically guarantee uninterrupted power, but that a firm baseload source reduces the duration and scale of storage required compared with a solar-only design. The modelled battery requirement of about 24.3 MWh is modest relative to the critical load because the SMR assumption supplies most demand continuously; however, the cost, safety design, degradation and grid-service value of that battery are not modelled in detail.
The rack-density sensitivity results demonstrate that demand estimates are highly dependent on AI hardware assumptions. This is important because most facilities do not uniformly operate at extreme densities, and future data centers may combine conventional, high-performance and AI racks. Consequently, the 100 kW/rack case should be understood as a stress-test scenario rather than a universal description of all AI data centers26,27,28,29.
Counterarguments and Alternative Energy Pathways
A balanced assessment should also account for obstacles to SMR deployment. Subscription, cost and schedule problems can arise despite policy support even for SMR projects, as seen with the NuScale Carbon Free Power Project. Requirements for licensing review, emergency planning, radioactive-waste management, and supply-chain maturity and acceptance can lag behind the timelines that are needed by the rapidly expanding AI infrastructure.
There are also some areas where alternative routes might be competitive. These include grid interconnection upgrades, geothermal energy (where available), long duration storage, hybrid gas with carbon capture, demand response, workload shifting and oversized renewable portfolios. This paper does not rule out those possibilities; it simply places SMR-renewable integration as one potential pathway to compare with those options using site-specific data.
Lifecycle Carbon and Sustainability Interpretation
The sustainability claim has been changed from ‘low-carbon’, in a general sense, to ‘low operational carbon’, unless lifecycle evidence is referred to. Uranium mining, milling, enrichment, fuel fabrication, construction, operation, decommissioning and waste management are other direct lifecycle emissions associated with nuclear generation, other than direct operational emissions. The emissions associated with nuclear lifecycle are generally found to be significantly lower than the emissions from fossil electricity, but not zero, in LCA studies and are dependent on the technology, fuel cycle and methodological assumptions14,15,16,17.
For a data-center project, a credible sustainability assessment should also include embodied emissions from PV modules, battery production and replacement, cooling infrastructure, water use, construction materials and grid backup. The present model therefore provides an energy-balance screening only, not a complete lifecycle sustainability assessment.
Limitations
The most important limitation is that the study is conceptual and deterministic. It uses transparent assumptions to explore scenarios but does not use measured AI data-center load traces, site-specific solar-resource data, reactor vendor performance data, or real cost quotations. As a result, the model can show internal consistency but cannot establish real-world reliability or commercial feasibility.
The reliability analysis is also simplified. N+1 derating is a useful screening step, but mission-critical data centers require deeper analysis, including forced outage rates, planned refuelling schedules, common-mode failures, maintenance windows, grid backup, battery state-of-charge constraints, loss-of-load probability, and emergency power architecture.
The economic analysis is qualitative. A complete feasibility study would require capital expenditure, operating expenditure, financing assumptions, fuel-cycle cost, licensing cost, insurance, decommissioning provision, battery replacement, cooling retrofit cost, land cost, grid interconnection charges and LCOE/TCO comparison.
The regulatory and social dimensions are not site-specific. Future work should examine applicable nuclear licensing pathways, emergency planning zones, environmental impact assessment, community consultation, radioactive-waste arrangements and institutional responsibilities before any claim of deployability is made.
Conclusion
This manuscript suggests that hybrid SMR-renewable power systems could provide a viable conceptual route towards supporting high density AI data centers, subject to a set of assumptions that need external confirmation. The updated model shows that the size of the battery backup needed in an example 24-hour dispatch, with the new SMR baseload and profile, is less than the size of the battery backup needed if it had been designed for a pure solar profile. It also confirms that the assumptions for rack density significantly affect the demand for facilities, that the screening criteria for reliability while evaluating SMR requirements are different from the ones used for reliability screening while evaluating the IT compute share in immersive cooling, and that the PUE used in the assumed value also influences the IT compute share in immersive cooling. Although the weighted feasibility screening has shown that SMR + renewables is performing well in the baseline, the ranking is not definitive as the scores are semi-quantitative and dependent upon regulatory, cost and reliability assumptions. The results therefore should not be considered to be an example of real world feasibility but rather a modelling exercise that highlights some key design parameters. The framework should be validated in future research using measured traces of AI workloads, site-specific solar and grid data, SMR availability and outage assumptions from vendor, probabilistic reliability modelling, lifecycle carbon assessment and full techno-economic cost analysis.
Nomenclature and Abbreviations
| Symbol / Term | Meaning | Unit / Note |
| AI | Artificial intelligence | Computational workload context |
| SMR | Small modular reactor | Modular nuclear power source |
| PV | Photovoltaic solar generation | Renewable variable supply |
| PUE | Power usage effectiveness | Total facility power / IT power; lower is better |
| N_racks | Number of IT racks | Count |
| P_rack | Average power per rack | kW/rack |
| P_facility | Total facility demand including overhead | MW |
| P_solar(t) | Solar output at hour t | MW |
| Delta P(t) | Supply minus demand at hour t | MW |
| LCA | Life-cycle assessment | Includes construction, fuel cycle, operation and end-of-life |
| LCOE | Levelised cost of electricity | Cost comparison metric |
References
- Masanet E, Shehabi A, Lei N, Smith S, Koomey J (2020) Recalibrating global data center energy-use estimates. Science 367(6481):984–986. https://doi.org/10.1126/science.aba3758. [↩]
- Uptime Institute (2024) Global Data Center Survey 2024. https://datacenter.uptimeinstitute.com/rs/711-RIA-145/images/2024.GlobalDataCenterSurvey.Report.pdf. Accessed 9 July 2026. [↩]
- Shehabi A, Smith SJ, Sartor DA, Brown RE, Herrlin M, Koomey JG, Masanet ER, Horner N, Azevedo IL, Lintner W (2016) United States data center energy usage report. Lawrence Berkeley National Laboratory, Berkeley. [↩]
- Badakhshan S, Jacob RA, Rad AM, Pan C, Li Y, Zhang J (2026) Dynamic stability assessment of grid-connected data centers powered by small modular reactors. arXiv preprint. [↩]
- Asuega A, Limb BJ, Quinn JC (2023) Techno-economic analysis of advanced small modular nuclear reactors. Applied Energy 334:120669. [↩]
- Locatelli G, Bingham C, Mancini M (2014) Small modular reactors: A comprehensive overview of their economics and strategic aspects. Progress in Nuclear Energy 73:75–85. [↩]
- Ingersoll DT (2009) Deliberately small reactors and the second nuclear era. Progress in Nuclear Energy 51(4–5):589–603. [↩]
- Carelli MD, Garrone P, Locatelli G, Mancini M, Mycoff C, Trucco P, Ricotti ME (2010) Economic features of integral, modular, small-to-medium size reactors. Progress in Nuclear Energy 52(4):403–414. [↩]
- Alonso G (2025) Economic competitiveness of small modular reactors in a net zero policy. Energies 18(4):922. [↩]
- Josephs RE, Yap T, Alamooti M, Omojiba T, Benarbia A, Tomomewo O, Ouadi H (2025) Regulation of small modular reactors: Innovative strategies and economic insights. Eng 6(4):61. [↩]
- Bhowmik P, Anderson M, Yoshiura R, Sabharwall P, Whiting E, Sgambati M, Cafferty K, Smith B (2026) Accelerating nuclear-integrated data center pursuits in the USA: SWOT analysis, power-thermal management strategies and demonstration plan. Nuclear Engineering and Design 446:114579. [↩]
- Utah Associated Municipal Power Systems and NuScale Power (2023) UAMPS and NuScale Power agree to terminate the Carbon Free Power Project. https://www.nuscalepower.com/press-releases/2023/utah-associated-municipal-power-systems-and-nuscale-power-agree-to-terminate-the-carbon-free-power-project. Accessed 9 July 2026. [↩]
- Warner ES, Heath GA (2012) Life cycle greenhouse gas emissions of nuclear electricity generation. Journal of Industrial Ecology 16(S1):S73–S92. https://doi.org/10.1111/j.1530-9290.2012.00472.x. [↩]
- Gibon T, Hertwich EG, Arvesen A, Singh B, Verones F (2023) Parametric life cycle assessment of nuclear power for energy scenarios. Environmental Science & Technology. [↩] [↩]
- Pehl M, Arvesen A, Humpenöder F, Popp A, Hertwich EG, Luderer G (2017) Understanding future emissions from low-carbon power systems by integration of life-cycle assessment and integrated energy modelling. Nature Energy 2:939–945. [↩] [↩]
- Sovacool BK (2008) Valuing the greenhouse gas emissions from nuclear power: A critical survey. Energy Policy 36(8):2940–2953. [↩] [↩]
- Al Kez D, Foley AM, Wong FWBH, Dolfi A, Srinivasan G (2025) AI-driven cooling technologies for high-performance data centres: State-of-the-art review and future directions. Sustainable Energy Technologies and Assessments 82:104511. [↩] [↩]
- Zhou K, et al (2024) Immersion cooling technology development status of data center. Science and Technology for Energy Transition. [↩] [↩]
- Haghshenas K, Setz B, Bloch Y, Aiello M (2022) Enough hot air: The role of immersion cooling. arXiv preprint. [↩] [↩]
- Chang Q, et al (2024) Optimization control strategies and evaluation metrics of data center cooling systems. Sustainability 16(16):7222. [↩] [↩]
- Nadjahi C, Louahlia H, Lemasson S (2018) A review of thermal management and innovative cooling strategies for data center. Sustainable Computing: Informatics and Systems 19:14–28. [↩] [↩]
- Ebrahimi K, Jones GF, Fleischer AS (2014) A review of data center cooling technology, operating conditions and waste heat recovery opportunities. Renewable and Sustainable Energy Reviews 31:622–638. [↩] [↩]
- The Green Grid (2012) PUE: A comprehensive examination of the metric. https://datacenters.lbl.gov/sites/default/files/WP49-PUE%20A%20Comprehensive%20Examination%20of%20the%20Metric_v6.pdf. Accessed 9 July 2026. [↩] [↩]
- ASHRAE (2021) Thermal guidelines for data processing environments. American Society of Heating, Refrigerating and Air-Conditioning Engineers, Atlanta. [↩] [↩]
- National Renewable Energy Laboratory (2024) PVWatts calculator documentation. NREL. https://pvwatts.nlr.gov/. Accessed 9 July 2026. [↩] [↩]
- Duffie JA, Beckman WA (2013) Solar engineering of thermal processes. Wiley, Hoboken. [↩]
- Saaty TL (1980) The analytic hierarchy process. McGraw-Hill, New York. [↩]
- Triantaphyllou E (2000) Multi-criteria decision-making methods: A comparative study. Springer, Boston. [↩]
- Kebede AA, Kalogiannis T, Van Mierlo J, Berecibar M (2022) A comprehensive review of stationary energy storage devices for large-scale renewable energy sources grid integration. Journal of Energy Storage 48:103927. [↩]