Abstract
Dry eye disease (DED) is a chronic condition, affecting the tear film layers of the eye, that has a global prevalence of up to 50%. Currently, treatment focuses on managing symptoms and contributing factors, because there is no established cure. Scleral lenses are an effective but underused treatment for DED. Due to their high geometric sensitivity, scleral lenses can be difficult to manufacture and often require multiple iterations in the fitting process. Current research has explored the possibility of 3D printing contact lenses, but found limitations in geometric accuracy and did not include the 3D printing of scleral lenses. This study aims to address the geometric inaccuracies in enlarged 3D-printed scleral-lens models by altering the model before printing to account for the expected warping. To test the effectiveness of altering a model before printing, also known as pre-warping, three objectives were set: determining the baseline warping during printing, applying pre-warping, and then running statistical tests in order to validate the accuracy of pre-warping. The use of an Elegoo Neptune 4 Pro printer alongside Duramic PLA+ filament resulted in the following findings: pre-warping moved the mean sagittal height and diameters along the X- and Y-axes significantly closer to their target dimensions; however, there was no significant improvement in the edge thickness. Additional pre-warping iterations should be evaluated in future work to determine whether residual geometric error can be further reduced. Under the tested conditions, pre-warping reduced sagittal-height and X- and Y-axis diameter deviations in the printed models.
Keywords: Dry Eye Disease, Scleral Lenses, 3D Printing, Additive Manufacturing, Pre-warping (Pre-compensation), Geometric Distortion, CAD Compensation
Introduction
Dry eye disease (DED) is a multifactorial condition characterized by a loss of tear-film homeostasis associated with inadequate tear quantity and/or quality1. DED has a global prevalence of up to 50%, with other factors such as aging populations, increased screen usage, and environmental changes contributing to its burden1. Patients with moderate or severe DED often describe the burden on their quality of life as comparable to other diseases such as psoriasis and class III/IV angina2. Within DED, two primary subtypes are recognized, sometimes appearing in union: Evaporative dry eye disease (EDE), and aqueous deficient dry eye (ADDE). Each type affects a specific layer of the eye’s tear film. ADDE, which compromises the aqueous layer, arises from dysfunction of the lacrimal glands, leading to decreased tear output, and in severe cases, can be sight-threatening3. EDE affects the tear film’s lipid layer, responsible for protecting and slowing down evaporation of the aqueous layer. EDE commonly results from meibomian gland dysfunction, which can lead to reduced meibum production and destabilization of the tear-film lipid layer4.
Because DED is chronic and multifactorial, treatment generally requires long-term management tailored to its contributing etiologies1. Some examples for EDE associated with meibomian gland dysfunction include artificial tear supplementation, eyelid hygiene, warm compress therapy, and thermal-pulsation therapy5. In cases where these therapies fail, more advanced therapies are administered. For instance, scleral lenses (SCLs), while primarily used for ocular surface diseases, such as corneal irregularities and epithelial defects, have been considered as a potential tool to manage DED2. A scleral lens is a rigid gas-permeable lens that rests on the sclera and vaults over the cornea to create a reservoir, which is filled with a fluid to keep the surface continuously hydrated6. Although SCLs offer an elegant therapeutic solution for severe DED, their clinical success relies heavily on matching the lens to the individual’s asymmetric ocular geometry, making implementation far more complex than the concept itself7.
Unlike conventional soft contact lenses, SCLs are made from a rigid material to hold fluid6. Because appropriate corneal clearance and landing-zone alignment are important to scleral-lens performance8, manufacturing-induced dimensional inaccuracies could compromise lens fit. Because of this, fitting often requires multiple appointments and lens refinements. Schornack et al. reported a mean of 2.4 lenses over 3.8 visits during the fitting process9. Nunziata et al. noted, citing expert opinion, that customized production may require approximately 15 days compared with 3 days for preformed lenses2. Lenses are evaluated through multiple measurements, including central, mid-peripheral, and limbal reservoir thickness, conjunctival landing, and edge profile8.
Recent studies have shown the ability to 3D print soft contact lenses. This enabled microchannel geometries to be produced through computer-aided design (CAD)-based fabrication10. The literature reviewed for this study did not identify reports of fully 3D-printed SCLs. If similar methods could be applied, the manufacturing process could potentially be shortened, although this has not yet been tested. For FDM specifically, an important drawback is thermally induced warping11. Because SCLs are rigid and depend on appropriate corneal clearance and landing-zone alignment, geometric errors may compromise their fit8. In modern 3D printing, pre-warping is occasionally applied to models before being sent to print. The main goal of this is to alter the model so that when the predicted warping occurs, it conforms to the desired model12.
This leads to the research question: can pre-warping reduce geometric distortions in the 3D printing of scleral lenses? The goal of this research paper is to develop a stronger understanding of how pre-warping affects the 3D printing of SCL models. Therefore, this study hypothesizes that digital pre-warping will significantly reduce fabrication-induced distortion and improve the dimensional accuracy of 3D-printed scleral-lens models.
Literature Review
The difficulty in identifying a curative therapy for DED arises from the heterogeneity of its underlying pathophysiologic mechanisms. As a result, existing treatments vary widely in their targets and effectiveness, necessitating a critical evaluation of current therapeutic approaches, advanced interventions such as SCLs, and emerging manufacturing technologies. In a review by Sheppard et al., the authors report that effective DED management should focus on addressing underlying etiologies and restoring tear-film homeostasis1. This indicates that DED treatments should be individualized and may require long-term application to address the diverse underlying causes of DED. Adding on to this, Wu et al. note that current ADDE treatments mainly manage symptoms without addressing underlying lacrimal-gland dysfunction and may provide only temporary relief13. These findings emphasize the need for a long-term, sustainable DED solution.
In the search for such a treatment, Qiu et al. reviewed the available evidence for using SCLs in DED. They explain that the SCL design protects the corneal surface by reducing tear evaporation while keeping it continuously hydrated6. These properties provide a rationale for using SCLs to protect and hydrate the ocular surface, although Qiu et al. emphasize that high-quality evidence remains limited. Further supporting this claim, Qiu et al. report that studies of SCL use found significant improvements in Ocular Surface Disease Index (OSDI) scores, reduced tear osmolarity, and improvements in corneal and conjunctival staining in selected DED populations6. Taken together, these findings support the use of SCLs as a treatment option for DED.
Despite their clinical utility, SCLs remain constrained by their demanding manufacturing and high geometric sensitivity. In a comprehensive review, Barone et al. note that SCL fitting remains complex and requires precise alignment14. Further, in a survey study, Shorter et al. found that fewer SCL wearers than corneal gas-permeable lens wearers reported annual out-of-pocket costs below $1,000 (41% versus 60%)15. In a separate survey of patients with DED, Shorter et al. found that SCL wearers reported a median annual dry-eye expenditure of $1,500, and only 38% considered it easy to locate a dry-eye specialist16. Together, these findings highlight the financial and access-to-care burden associated with SCL treatment. Moreover, Nunziata et al.’s case series reported initial fitting difficulties; the authors also noted, citing expert opinion, that customized production may take longer than production of preformed lenses2. This further highlights the restricted nature of SCLs and raises the question if SCLs can realistically be applied more freely to DED cases.
Recent clinical studies have further evaluated the effectiveness of SCLs and the importance of their fit. Moon et al. reported improvements in visual acuity, ocular-surface staining, and patient-reported symptoms after 12 weeks of large-diameter SCL wear in patients with intractable ocular surface diseases17. Similarly, Lu et al. found that one month of SCL treatment reduced OSDI and corneal staining scores in patients with severe DED18. However, the lens must still be fitted correctly. Kumar et al. evaluated central clearance, limbal clearance, haptic compression, and edge alignment as separate parts of SCL fit19. Villa et al. found that increasing central clearance affected refraction and higher-order aberrations20. In a randomized study, Litvin et al. found no clinically significant change in intraocular pressure during five hours of wear with two well-fitted lens diameters in young, healthy participants21. Schornack et al. also found that practitioners use several lens diameters and landing-zone designs when fitting SCLs22.
Additional studies have further shown the clinical value of SCLs and the importance of fitting. Lee et al. found that best lens-corrected visual acuity was significantly better than habitually corrected visual acuity across 62 eyes with various corneal disorders23. Hadimani et al. also found improvements in high- and low-contrast visual acuity and vision-related quality of life after three months of SCL wear in patients with keratoconus24. Together, these findings demonstrate that the benefits of SCLs extend beyond DED but still depend on achieving an appropriate lens fit. Yoon et al. evaluated corneoscleral profilometry for free-form SCL fitting and reported that an average of 2.1 lenses and 2.9 follow-up visits were required to complete fitting25. This suggests that even when patient-specific surface data are used, fitting may still require multiple adjustments. Wang et al. measured fluid-reservoir thickness across 17 corneal regions and found that it decreased during four hours of wear, with the greatest asymmetry along the vertical meridian26. These results further demonstrate that the relationship between the lens and ocular surface can change across both location and wear time.
Three-dimensional (3D) printing has emerged as a powerful enabling technology, allowing rapid, patient-specific fabrication of ophthalmic devices. Debellemanière et al. demonstrated that a 3D-printed biconvex optical lens was feasible, although its surface quality remained far from clinical standards27. For example, in a review discussing the extent of 3D printing in ophthalmology, Fakhoury et al. described its use in orbital implants, ocular prostheses, surgical guides, and even eye models28. Collectively, these applications set a strong foundation for 3D printing and its potential expansion into other ophthalmic areas. Further testing the scope of 3D printing, Alam et al. showcased a proof-of-concept study demonstrating the ability to fabricate contact lenses using a specialized 3D printer10. With continued advancements, SCLs may represent the next ophthalmic device suitable for 3D printing. These studies suggest possible ways in which 3D printing might address manufacturing limitations associated with SCLs. Hisham et al. produced complete multimaterial contact lenses from CAD models and demonstrated that complex patterns could be created through CAD modification29. Hisham and Butt used a low-cost vat-photopolymerization method to print customizable functional structures onto commercial contact lenses30. Although neither study evaluated SCLs or demonstrated reductions in clinical costs, fabrication time, or access barriers, their findings show that contact-lens designs and features can be digitally customized using 3D-printing methods. A comparable CAD-based workflow could potentially support more direct modification of patient-specific SCL designs, but this possibility remains to be tested.
Research on 3D-printed contact lenses has also expanded beyond the initial proof-of-concept study by Alam et al. Hittini et al. used vat photopolymerization to print colored hydrogel contact lenses and then evaluated their optical, mechanical, and cytotoxic properties31. Goto et al. printed PEGDA contact lenses containing azithromycin and found that material composition and secondary curing affected lens thickness, mechanical strength, and drug release32. Using a different printing process, Mohamdeen et al. combined hot-melt extrusion with FDM to fabricate timolol-releasing contact lenses33. The measured diameters of these lenses were slightly smaller than the CAD dimensions because of thermoplastic shrinkage33. These studies produced functional contact-lens prototypes, but they also reported material and dimensional limitations that would have to be addressed before clinical use.
A major consideration in translating 3D printing to SCLs is the importance of dimensional accuracy for appropriate lens fit19. In a study similar to Alam et al., Garg et al. evaluated the shape fidelity of 3D-printed contact lenses using circularity, for which a value of 1 represents a perfect circle. The P-Gel-3% lenses had a circularity value of 0.872, indicating some departure from an ideal circular geometry34. Small geometric differences are particularly important for scleral-lens fitting because central clearance, limbal clearance, haptic compression, and edge alignment are evaluated as separate components of fit19. This underscores that, before 3D-printed SCLs are feasible, warping and dimensional inaccuracies during printing must be better controlled.
Geometric errors during 3D printing are not limited to ophthalmic devices. Pre-warping, also known as pre-compensation, is a method used to reduce these deformations. Pre-warping is the process of intentionally distorting the CAD model in the opposite direction of the expected process-induced error, so that, after shrinkage and warpage, the printed part ends up closer to the nominal geometry12. Marczis et al. found that, in selective laser sintering (SLS), geometric compensation improved the nominal dimensional difference by ~18% for distances between parallel planes35. Several manufacturing studies have tested methods for controlling these dimensional errors. Jadayel and Khameneifar used 3D scans of repeated FDM prints to calculate an average deviation field and then applied the inverse error to the CAD mesh36. The compensated print had deviations approximately three times smaller than the uncompensated prints. Haldar followed a similar concept by measuring X-, Y-, and Z-axis errors in low-cost fused filament fabrication (FFF) and stereolithography (SLA)- and digital light processing (DLP)-based printers and using the measured errors to adjust the next solid model37. Dong et al. reported distortion reductions of up to 82.5% for a lattice structure and 77.8% for a canonical part after data-driven pre-compensation38. Afazov et al. used optically scanned data to pre-distort an Inconel 718 component and reduced its distortion from approximately ±400 μm to ±100 μm12. Lechner et al. found that compensation should focus on repeatable deviations because compensating random print-to-print variation can increase manufacturing instability39. Ráž et al. also found that part position and build arrangement affected deformation during MJF printing40. These findings support the use of repeated baseline measurements before applying changes to the digital model. Applying this process to the 3D printing of SCLs could help bridge the technological gap currently limiting their fabrication. The literature reviewed for this study did not identify research applying pre-warping specifically to the fabrication of SCLs.
Research Gap
This analysis of the current academic discussion in the field of 3D-printed SCLs for DED did not identify research directly evaluating the impact of digital pre-warping on fabrication-induced distortion and dimensional accuracy in 3D-printed SCL models. Although prior research identifies warping as a major barrier to 3D-printed SCLs, the effectiveness of pre-warping strategies remains poorly understood. Thus, the goal of this study is to address this gap by analyzing geometric distortion and dimensional deviation in pre-warped versus non-pre-warped 3D-printed SCL models in relation to dimensional accuracy. Through this research, a comparative experimental method was used to apply digital pre-warping and quantitatively evaluate post-print accuracy, generating results that address the lack of empirical evidence on pre-warping effectiveness.
Methods
Method Justification
To ensure the effectiveness of pre-warping in 3D printing, there must first be a baseline warping measurement. This serves as a basis to quantify improvement as well as a starting point to generate the pre-warping needed for a print. Experimental work with acrylonitrile butadiene styrene (ABS) has shown that FDM warping is influenced by thermal conditions, including nozzle and bed temperature11. Under the ABS-cuboid printing conditions evaluated by Ramian et al., repeated prints demonstrated similar dimensional behavior11. Measuring deviation across multiple identical prints allowed estimation of systematic mean bias and within-batch variability.
In precision manufacturing, pre-warping has been implemented by applying the inverse of a measured deformation field to the digital model prior to fabrication35. In this study, that principle was simplified to global anisotropic axis scaling based on mean baseline dimensional errors. By applying the inverse of the measured baseline warping and keeping all other variables constant such as temperature, printer model, and parameters, we can effectively gauge the increased dimensional accuracy attributed to the pre-warping.
Although the fused deposition modeling (FDM) setup used here was intended only as a proof of concept and not for clinical lens production, geometric distortion and pre-compensation have also been reported in powder-bed fusion and SLS35,12. Accordingly, success with pre-warping using FDM printers would provide proof-of-concept evidence supporting further testing with specialized SLA- and DLP-based printers; however, similar levels of success cannot be assumed because the printing processes and materials differ.
Statistical analysis was selected to evaluate both dimensional accuracy and manufacturing consistency. Shapiro-Wilk tests were first used to assess normality and determine whether parametric testing was appropriate for each dataset; Khatun identified Shapiro–Wilk as one of the most powerful normality tests examined41. Histograms and Q–Q plots were examined alongside the formal tests because normality tests can be sensitive to sample size41. One-sample t-tests were then used to compare sagittal-height and X- and Y-axis diameter means from each printed-model group against the intended CAD dimensions because the reference values were fixed design targets rather than values from another group42. Edge thickness was analyzed using Wilcoxon signed-rank tests because its distributions departed from normality. Welch’s two-sample t-tests were used to compare sagittal height and X- and Y-axis diameter measurements between the baseline and pre-warped groups because they do not require equal variances, making them more appropriate than Student’s t-tests for manufacturing data with potentially unequal spread43. Edge thickness was compared between groups using a Mann-Whitney U test. The Mann–Whitney U test used a two-sided asymptotic calculation with corrections for tied values. Brown-Forsythe tests were additionally used to compare variability in the raw dimensional measurements between groups, since improved consistency was a key outcome alongside improved mean accuracy44.
Experimental Procedure
Objective 1 – Calculating Baseline Warping
A discarded commercial scleral lens, manufactured by ABB Optical Group (ICD FLEXFIT) and obtained from True Eye Experts of New Tampa, underwent 3D scanning using equipment provided by Micro-Epsilon to produce a digital STL mesh representing its geometry. The resulting mesh did not fully encapsulate the lens geometry because portions of the scan were cropped. Therefore, a complete radial profile from an intact portion of the mesh was extracted and revolved through 360 degrees to generate a rotationally symmetrical model based on the captured lens profile. The model was uniformly enlarged by a factor of 2.2288 before printing because the printer could not reliably reproduce the original lens at its clinical scale. The enlargement factor of 2.2288 was selected to produce target X- and Y-axis diameters of 36.6158 mm, allowing the model to be reliably reproduced by the printer. The STL file was then sliced and printed using fixed printing parameters on an Elegoo Neptune 4 Pro FDM printer with Duramic PLA+ filament and a 0.4 mm nozzle. Thirty identical prints were produced and labeled (B1-B30).
Four global dimensions, sagittal height, X-axis diameter, Y-axis diameter, and edge thickness, were measured at predefined landmarks using a Fisherbrand™ Traceable™ Digital Caliper (Catalog number, 06-664-16; measuring range, 0-203.2 mm [0-8 in]; resolution, 0.01 mm; accuracy, ±0.03 mm). The instrument was supplied with a serial-numbered certificate from an ISO 17025 calibration laboratory documenting traceability to National Institute of Standards and Technology (NIST) standards. Its measurement range encompassed all dimensions of the enlarged test models. The Y-axis diameter was measured across each printed model along the visible printed reference line, and the X-axis diameter was measured perpendicular to that line at 90 degrees. Edge thickness was measured at four circumferential locations (0, 90, 180, and 270 degrees) and the four readings were averaged to obtain one edge-thickness value for each printed model. Sagittal height was measured with each printed model supported in a custom 3D-printed base to maintain a consistent orientation, and the base height of 9.67 mm, measured using the same digital caliper, was subtracted from the combined measurement. Each measurement was compared with the corresponding target dimension of the enlarged reference model, and mean deviations were calculated to quantify global dimensional bias. All caliper measurements were performed by the same investigator to maintain consistency between the baseline and pre-warped printed models.
Objective 2 – Testing Pre-Warping Effectiveness
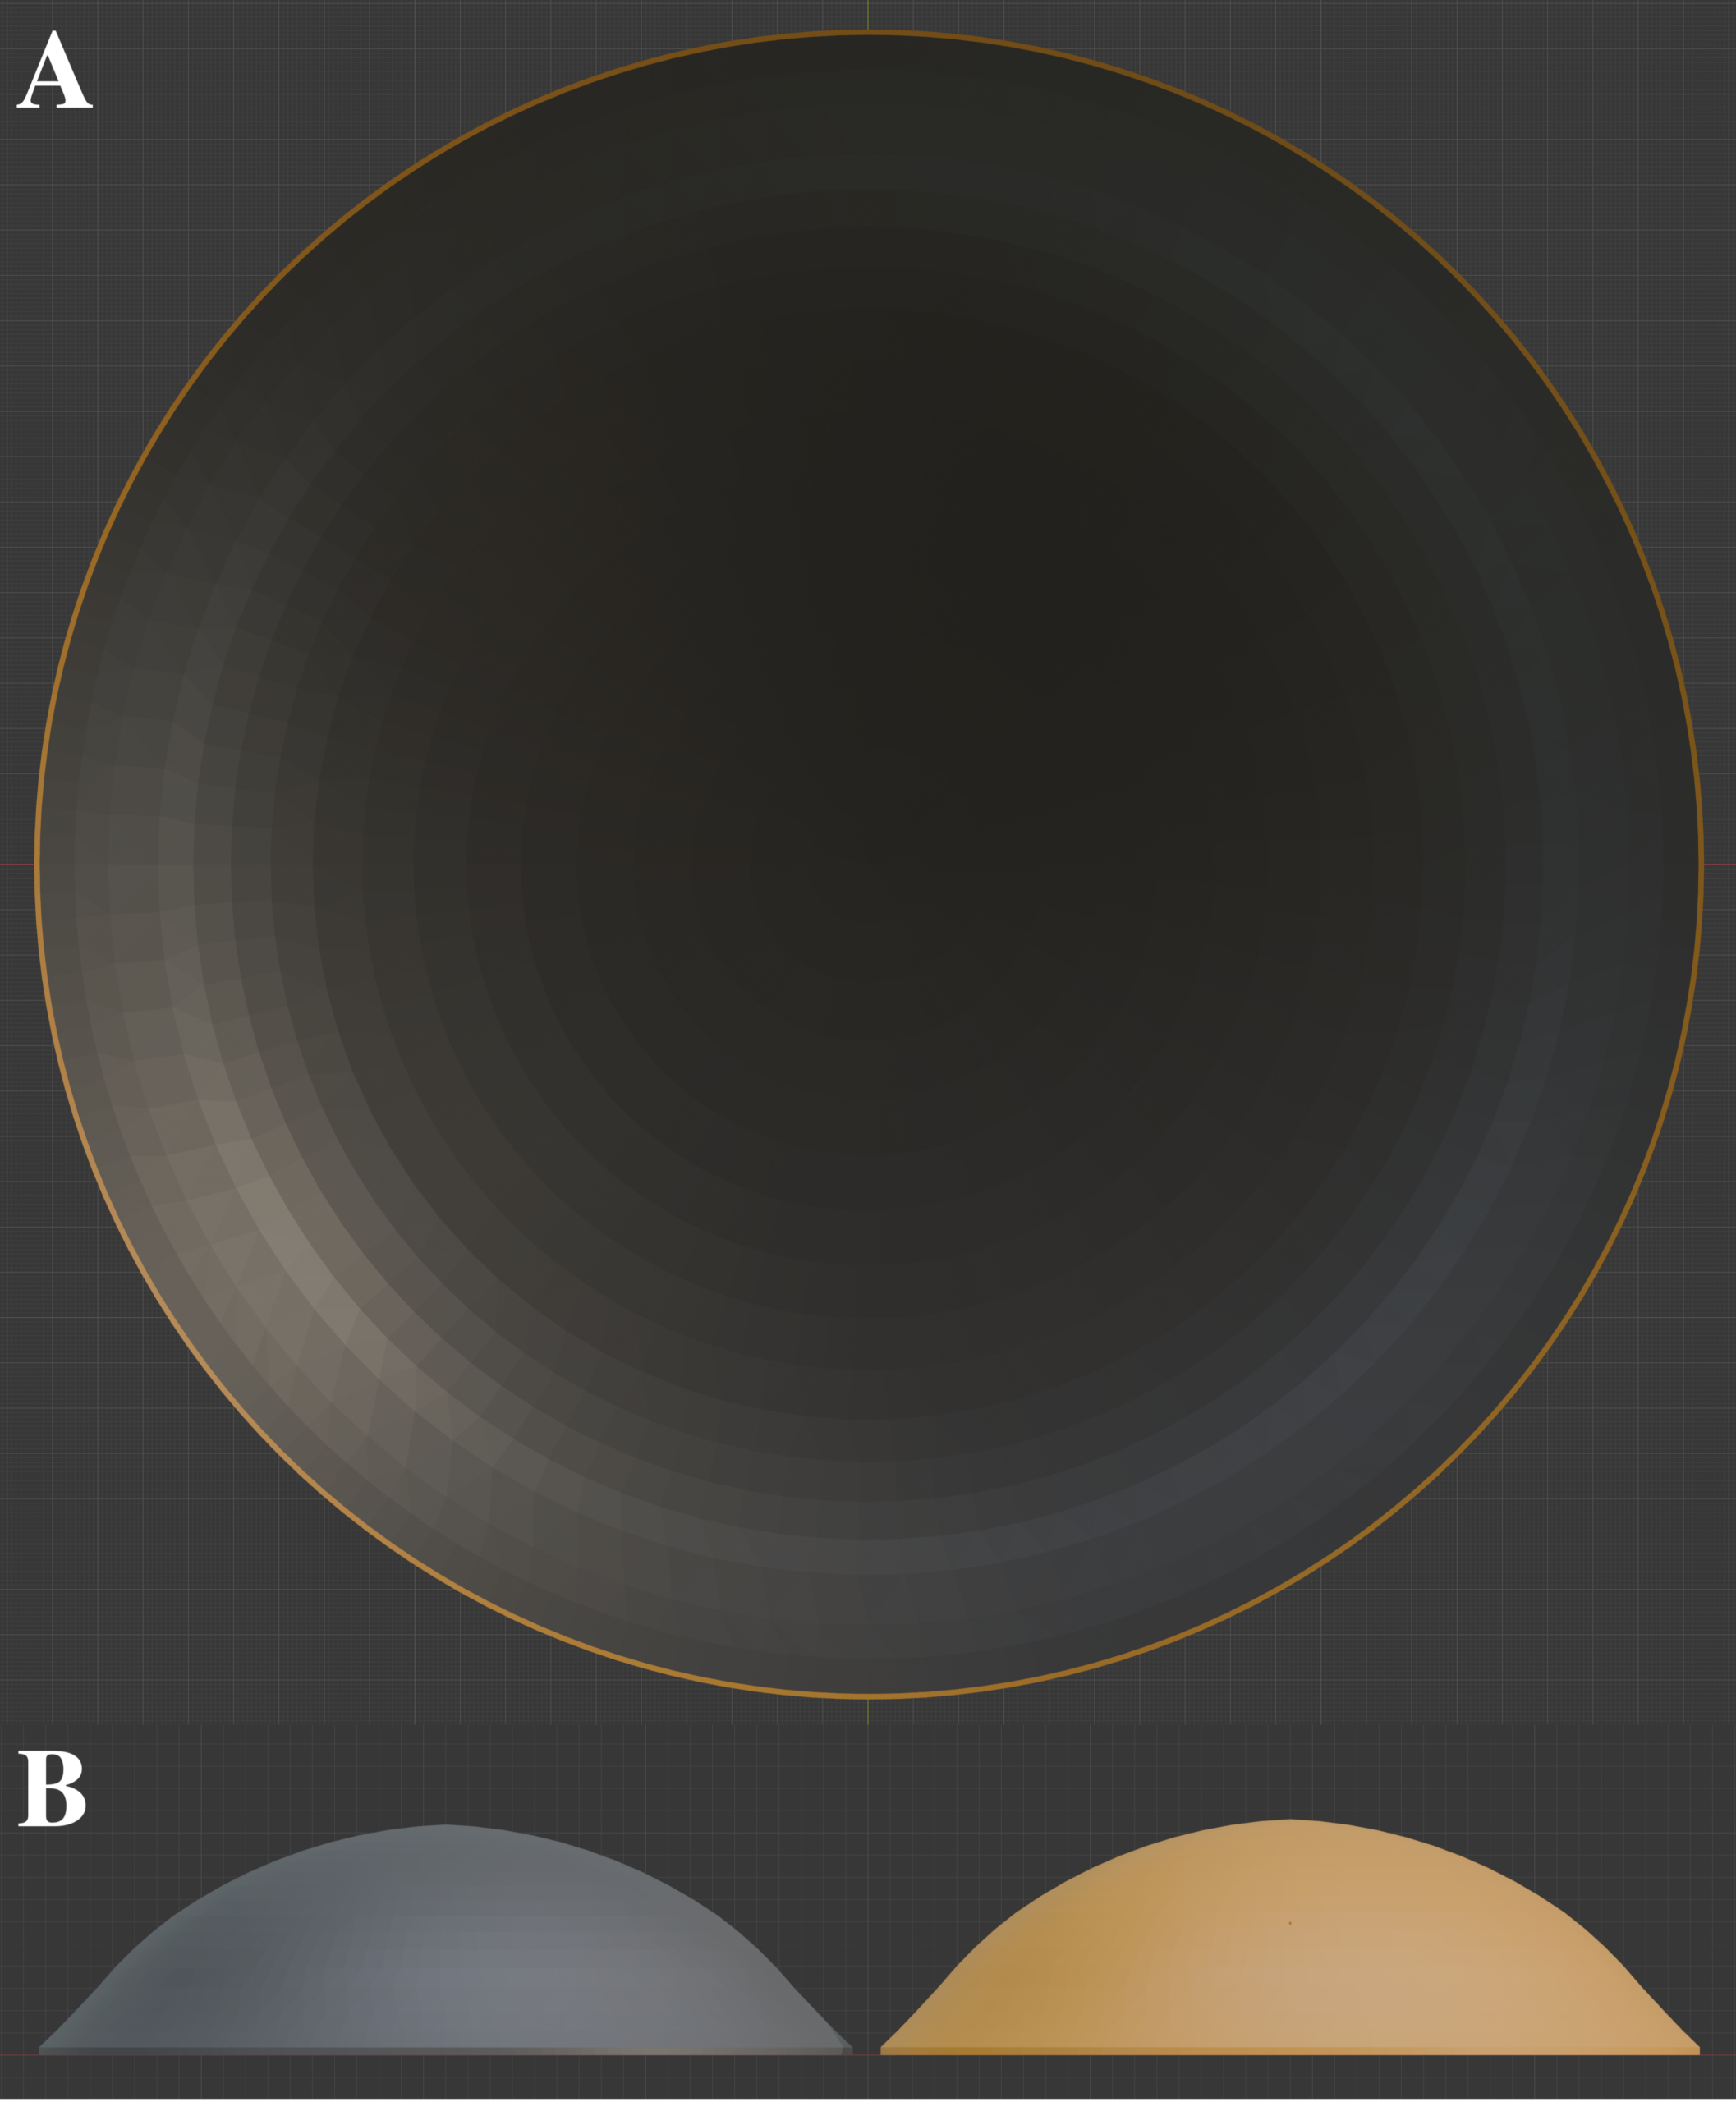
Previously obtained baseline deviation values were used to generate a compensated digital model. The compensated model was generated in Shapr3D using global anisotropic scaling rather than a local deformation-field correction. For each dimension j, where j represents X, Y, or Z, Tj represented the target CAD dimension and Bj represented the mean baseline printed dimension. The measured undersizing was calculated as dj = Tj − Bj. The compensated CAD dimension was calculated as Cj = Tj + dj, and the scale factor was calculated as sj = Cj ÷ Tj. The measured undersizing was 0.2395 mm for X, 0.2401 mm for Y, and 0.2401 mm for Z. The resulting scale factors entered in Shapr3D were 1.0065409 for X, 1.0065573 for Y, and 1.0230 for Z, with the Z axis corresponding to sagittal height. Uniform scaling was disabled during this compensation step. No axis translation or local displacement of mesh vertices was performed, and edge thickness was not independently compensated. Because of the anisotropic scaling, the nominal edge thickness of the compensated model was approximately 0.255 mm. The resulting compensated standard tessellation language (STL) dimensions were 36.8553 mm along the X-axis, 36.8559 mm along the Y-axis, and 10.6992 mm along the Z axis. The original enlarged and compensated STL files are provided as Supplementary Files S1 (Supplementary_File_S1_Original_Enlarged_Model.stl) and S2 (Supplementary_File_S2_PreWarped_Compensated_Model.stl), respectively. Figure 1 shows the resulting spatial difference between the original enlarged model and the compensated model.
After compensation, the mesh was visually reviewed for obvious surface discontinuities. Slicing of the compensated STL file was performed using the same fixed parameters applied in the baseline stage. A new set of thirty prints was fabricated under the same conditions as Objective 1 and then labeled (W1-W30). Each compensated printed model was measured at the same landmarks as Objective 1. Collected measurements were compared directly to the intended dimensions defined by the original reference model. Mean deviation values across all compensated samples were computed to assess remaining distortion after pre-warping. Comparison between compensated and baseline deviations was performed to evaluate whether systematic error had been reduced.
Objective 3 – Evaluating CAD Fidelity
Measurement data from both baseline and pre-warped samples were organized for each geometric parameter, including sagittal height and outer diameter along X and Y axes. Deviation values were calculated relative to each sample’s corresponding digital model, with baseline prints referenced to the original CAD model and pre-warped prints to the compensated model. Absolute deviation values were used to represent the magnitude of geometric error for each printed model. Distribution characteristics were assessed using Shapiro–Wilk tests alongside histogram and Q–Q plot visualization to evaluate normality. A two-sample Welch’s t-test was applied to compare absolute deviations between baseline and pre-warped groups for each parameter. Statistical significance was determined using an alpha threshold of 0.05.
Method Limitations
While effective in assessing the effectiveness of pre-warping, there are several limitations to this methodology. Firstly, FDM printing was used as opposed to a custom SLA-based printer or a DLP-based printer. If the pre-warping outcomes for FDM-based printing of SCL models are shown to be beneficial, future research would still be needed to confirm similar effectiveness in SLA-based printers and other systems specialized for ophthalmic devices such as SCLs. Because only one enlarged reference geometry was evaluated, the findings cannot be generalized to all scleral-lens shapes, sizes, or patient-specific geometries. The single model provided a controlled proof-of-concept for evaluating pre-warping under one set of printing conditions. Additional geometries should be evaluated in future studies. Because the scan did not fully encapsulate the lens, the reconstructed model was based on one intact radial profile rather than the complete three-dimensional geometry of the source lens. Furthermore, non-clinical thermoplastics were used in the creation of the prints rather than clinical-grade materials that enable oxygen permeability and other essential properties of a scleral lens. Again, like the use of FDM printers, these findings may indicate the potential for applying pre-warping in future developments; however, without further testing, they cannot confirm translational applicability. Because edge thickness was not independently compensated, conclusions regarding the effectiveness of pre-warping are primarily limited to the X, Y, and Z dimensions. The influence of nozzle diameter was not experimentally isolated, and measurement uncertainty may have been introduced through caliper placement and use of the custom measurement base. Additionally, only one baseline batch and one pre-warped batch were evaluated under a single printing condition; therefore, the repeatability of the observed improvements across independent printing batches was not assessed. Finally, the four landmark measurements provided information about selected global dimensions but did not capture full-field surface error, local warping, asymmetry, surface waviness, or haptic-zone deviations. Full-field scanning and registration of the printed models to the nominal CAD model were not performed because repeat access to suitable three-dimensional scanning equipment was unavailable. Consequently, the findings are limited to sagittal height, X- and Y-axis diameter, and edge thickness at the predefined measurement locations and should not be interpreted as a complete evaluation of overall surface fidelity or clinical scleral-lens fit.
Results
Baseline Prints
Before evaluating the accuracy of the printed models, the intended geometry of the digital scleral-lens model was first examined. The reference CAD model used for printing had the following measurements: a sagittal height of 10.4591 mm, an outer diameter of 36.6158 mm, and an edge thickness of 0.25 mm. These values represent the target geometric dimensions of the model. A perfect printing scenario would produce baseline printed models that closely match the target. A future clinical-scale lens made from an appropriate material would require further optical, safety, and patient-fit testing before clinical use.
Thirty SCL models were printed under identical conditions to characterize the baseline geometric distortion produced by the printing process. Each printed model was measured at the same four locations as the reference CAD model. These measurements were chosen as simplified global indicators of dimensions of printed-model geometry rather than as a complete clinical fitting assessment.
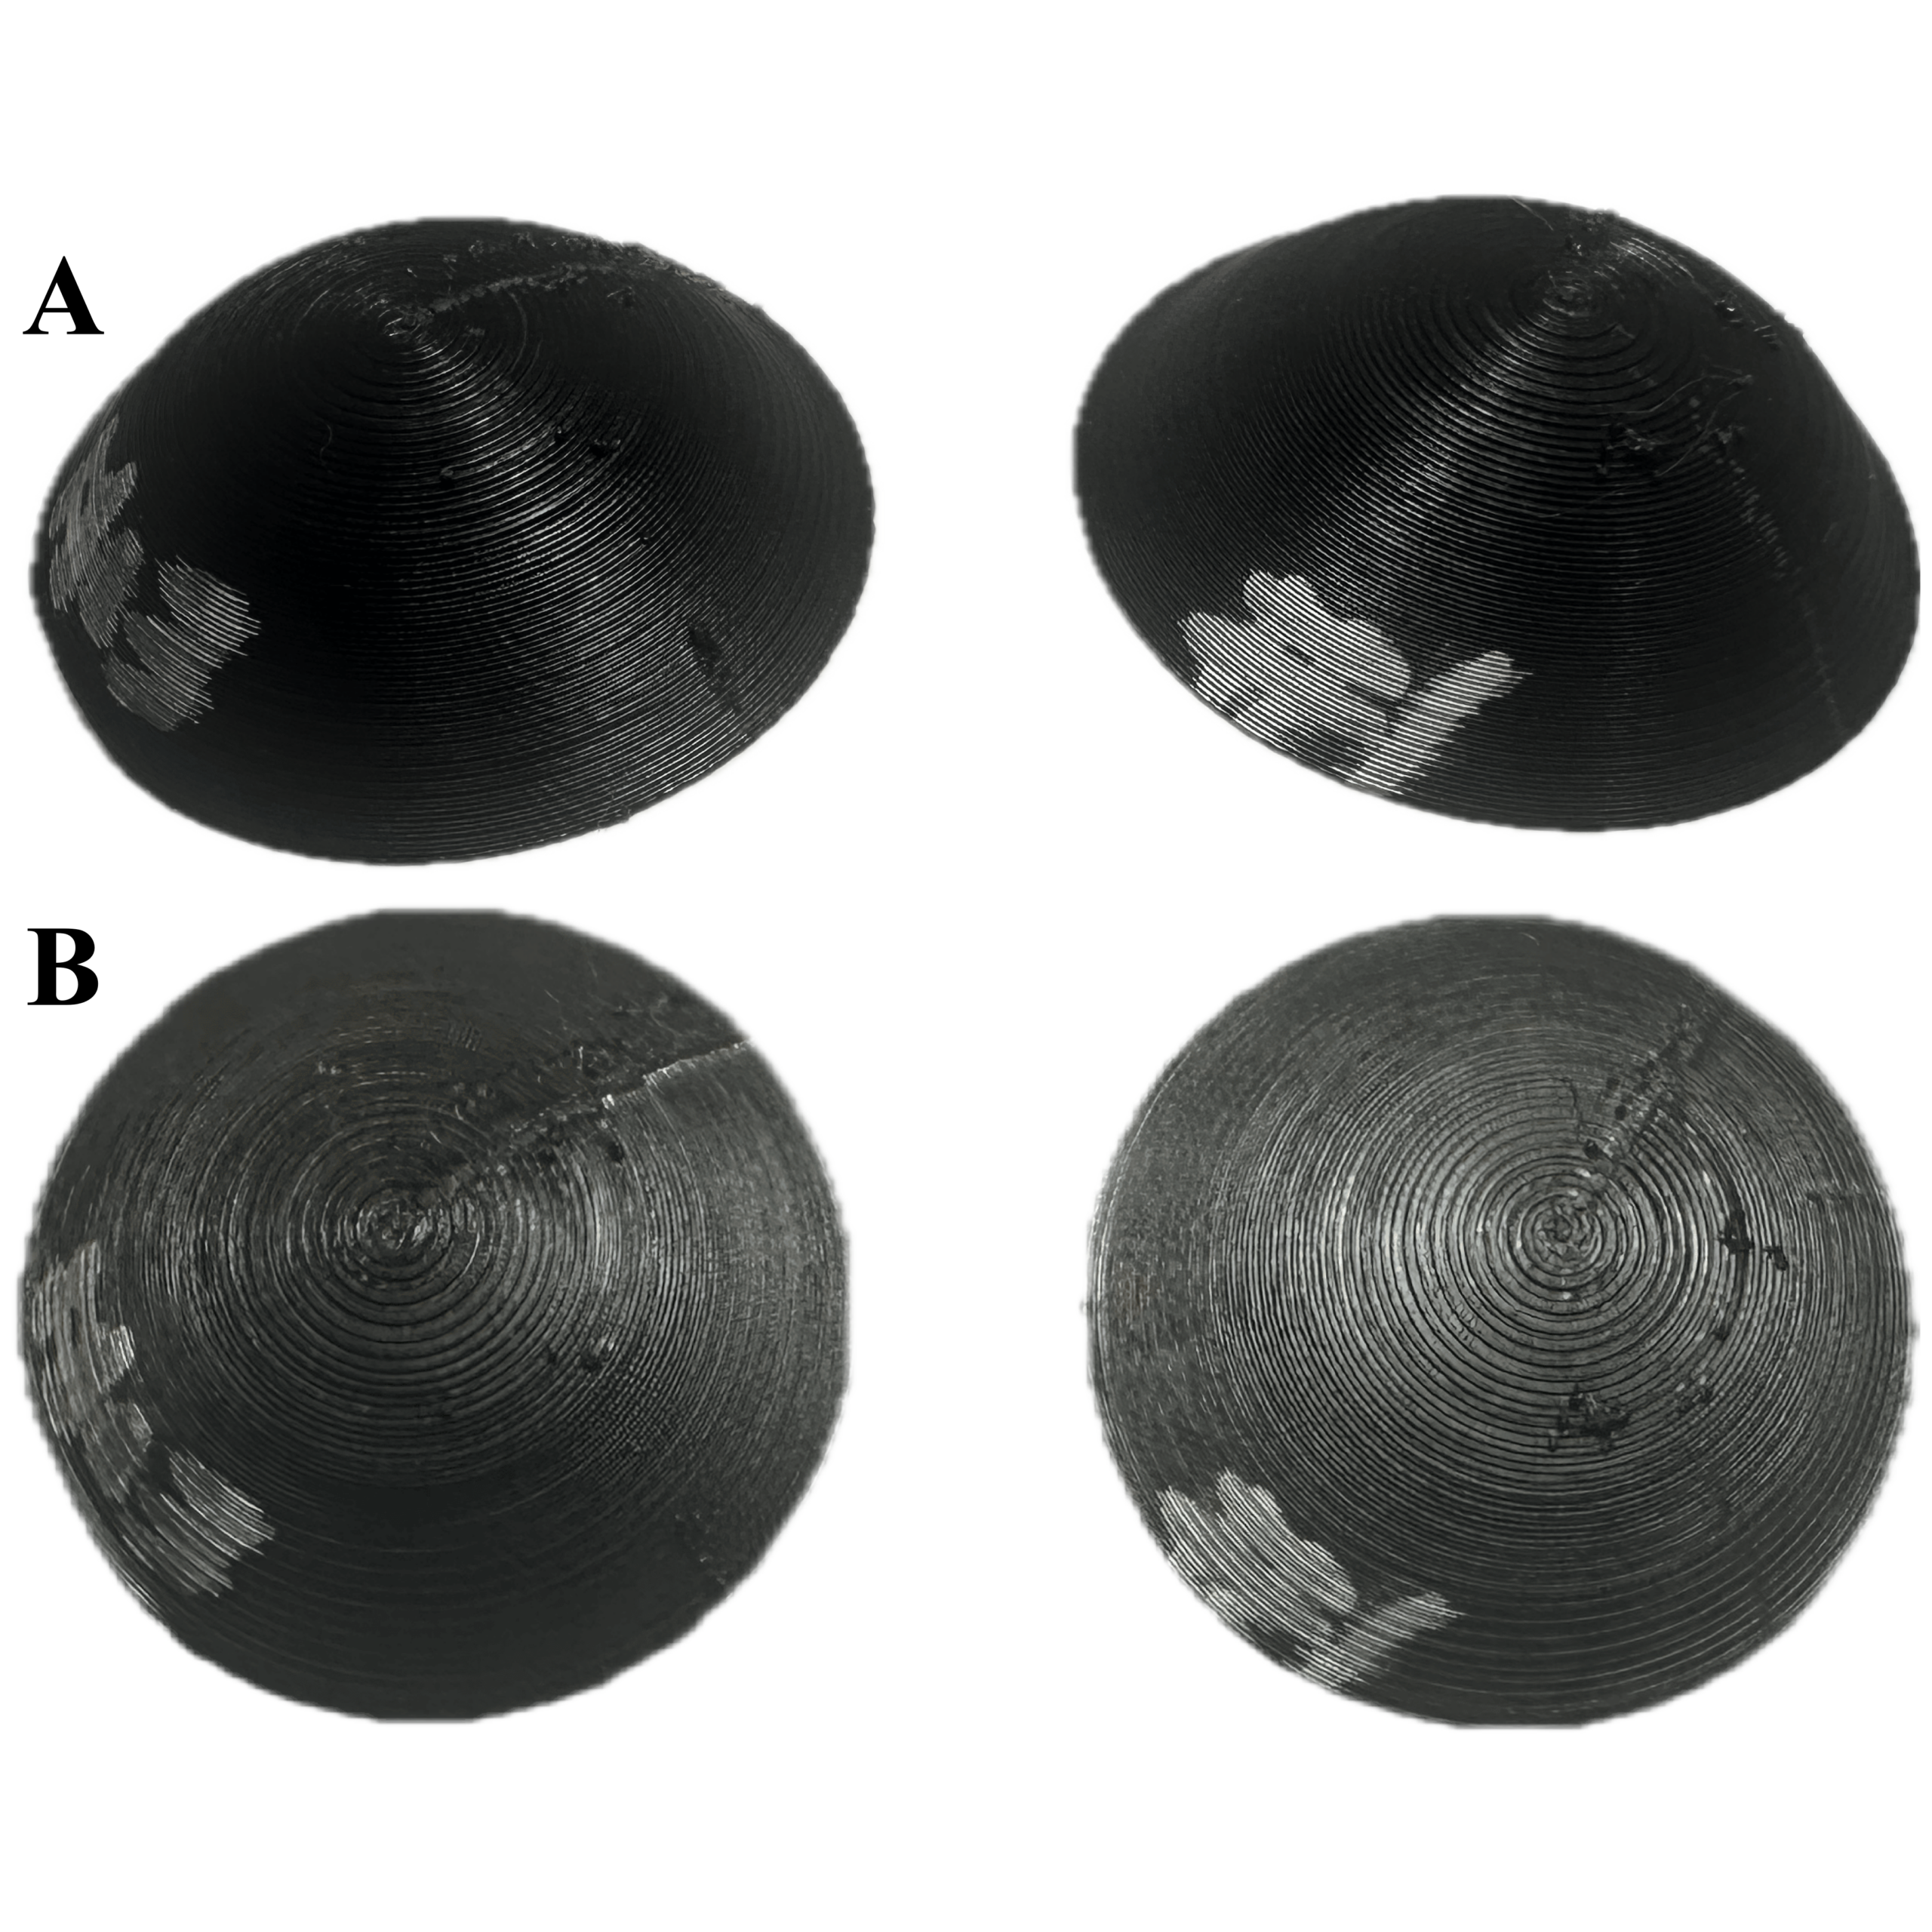
Inspection of the printed models revealed that print #13 had a major structural deformation (see Figure 2). This printed model showed a significant inward curve along the diameter instead of maintaining the expected dome-shaped geometry. It is unlikely to represent a systematic error in the printing process due to it only occurring once among the thirty prints. Instead, it likely reflects a sporadic printing failure, which can occasionally occur in FDM printing. Therefore, this deformation is not considered representative of the typical geometric distortion produced by the printing process. However, because the localized deformation did not intersect the predefined measurement landmarks, print #13 was retained in the analysis; its four recorded landmark measurements remained within the ranges of the other baseline prints.
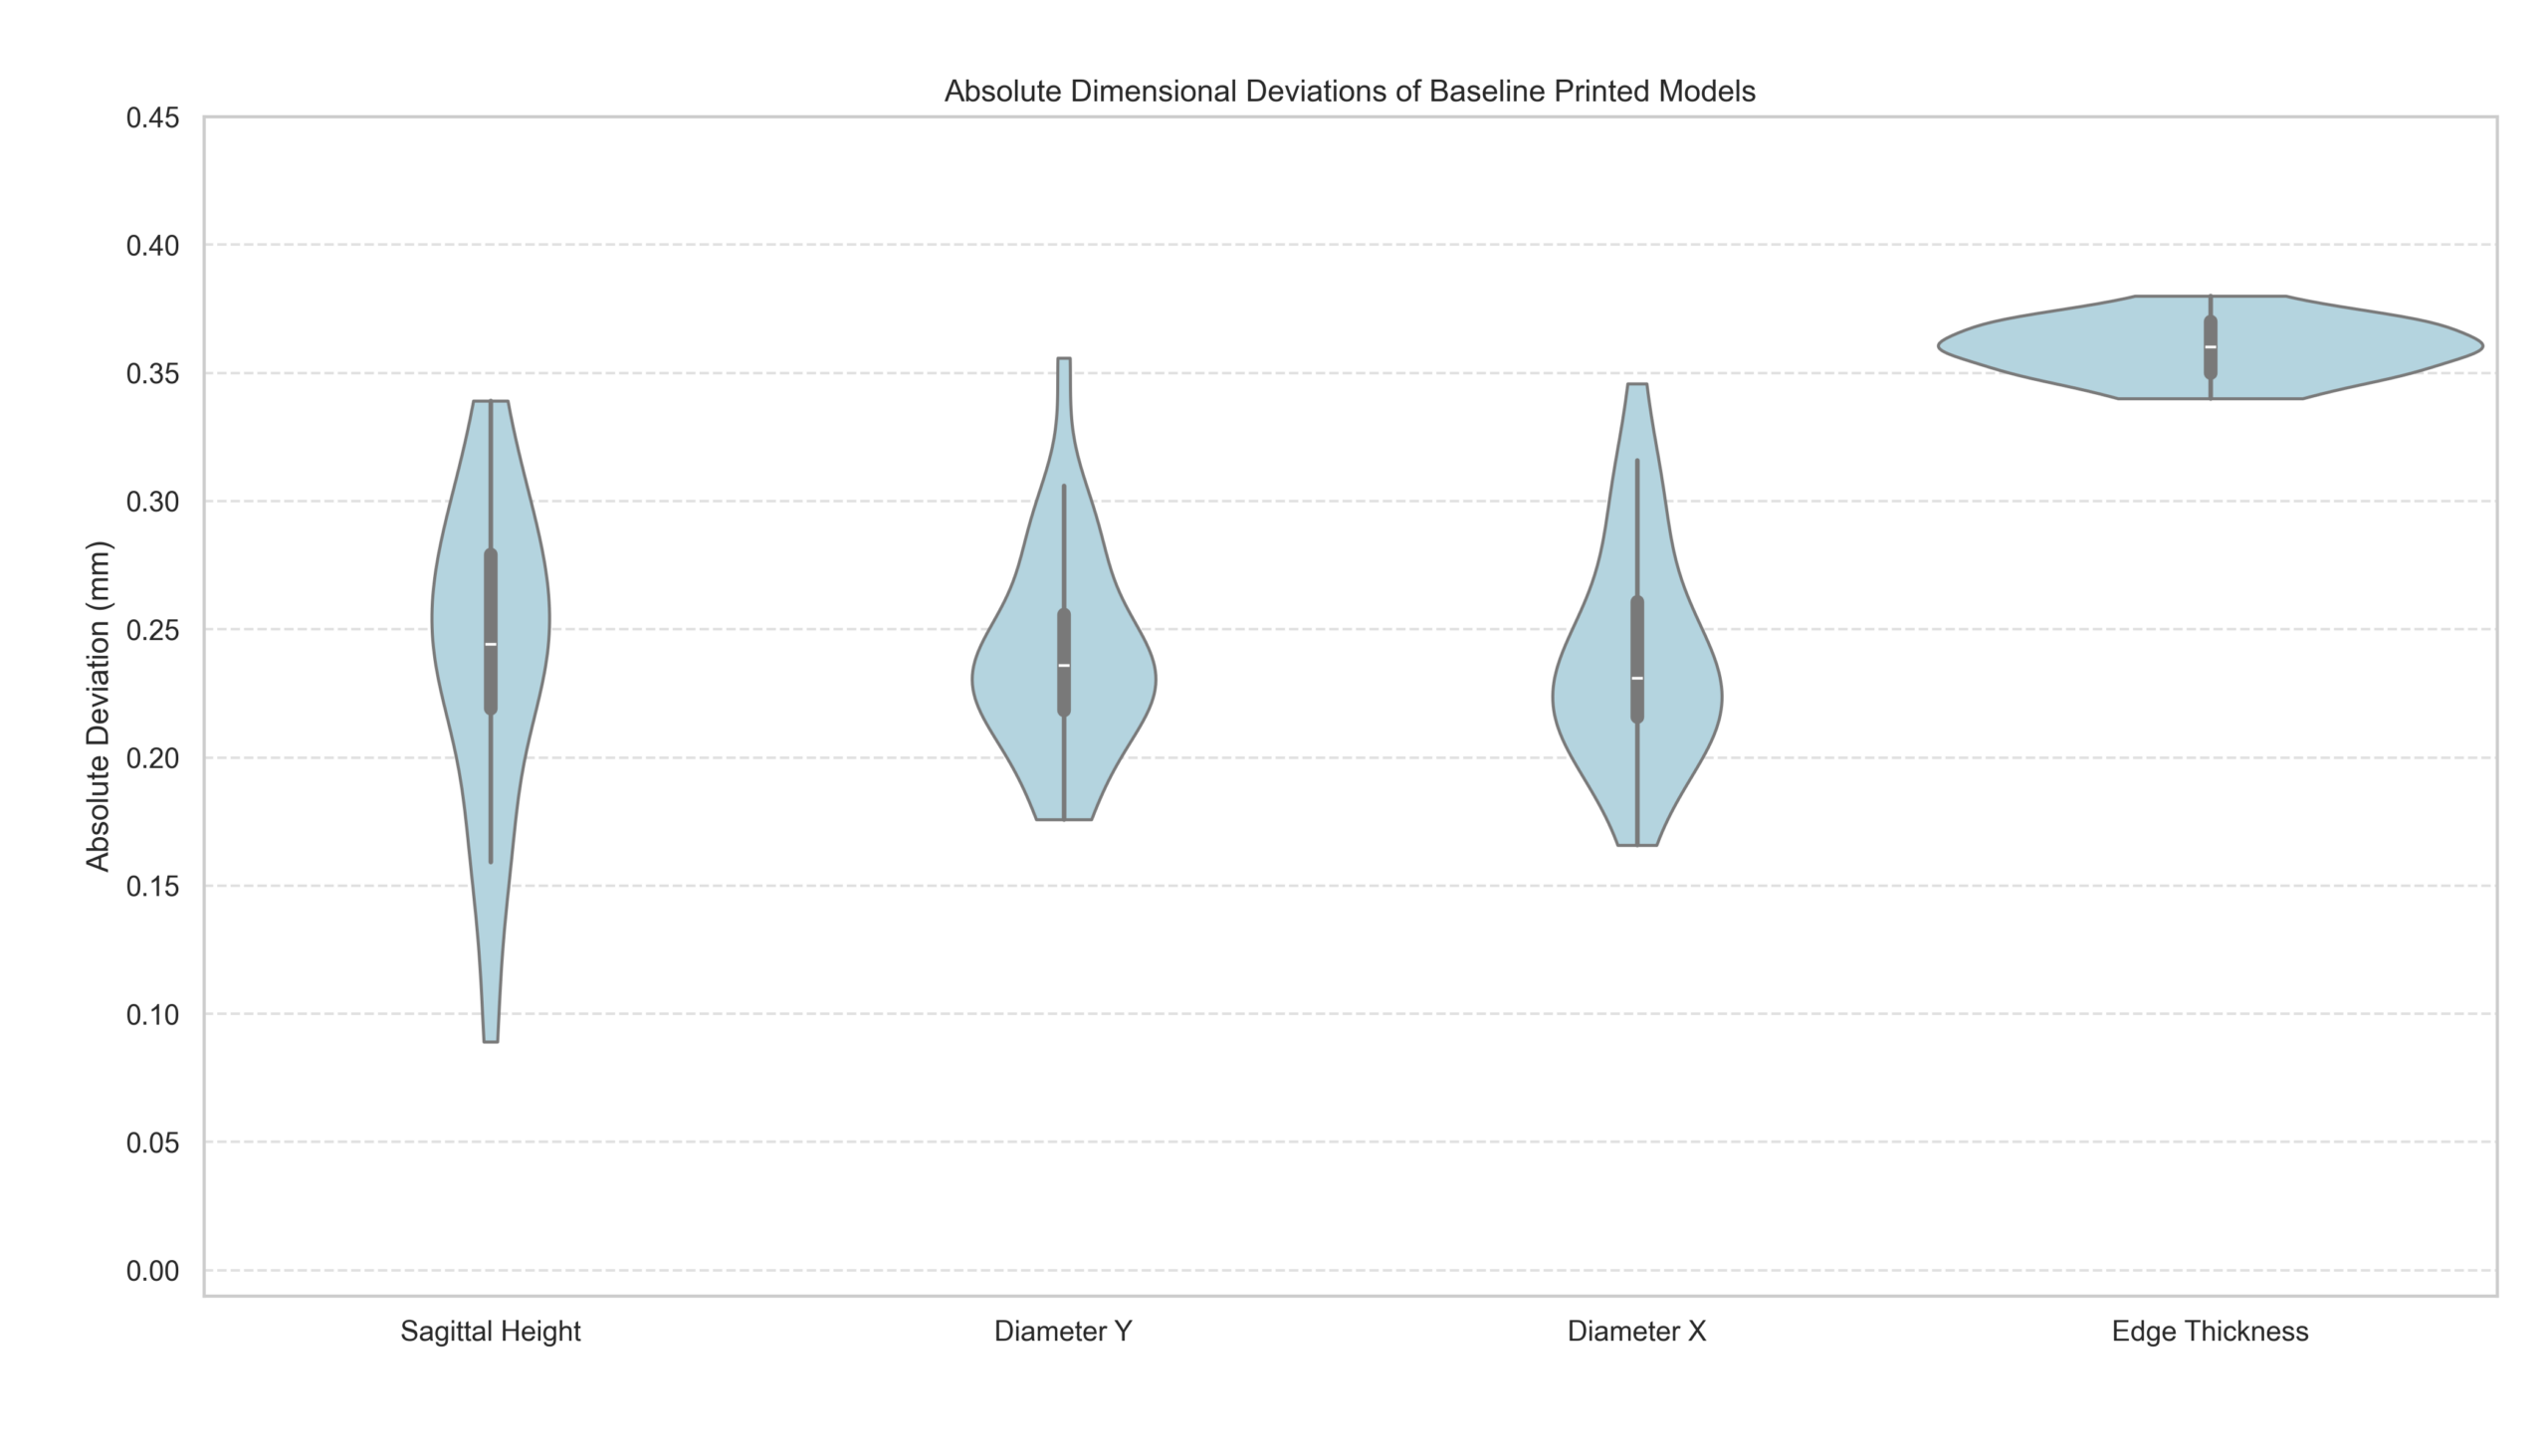
Aside from this isolated defect, the baseline printed models exhibited relatively consistent deviations from the reference model, summarized in Figure 3. The average sagittal height measured across the baseline prints was 10.2190 mm, meaning a deviation of 0.2401 mm. This represents a percent error of 2.30%. Similarly, the outer diameter measurements demonstrated consistent inward shrinking relative to the reference model. The average outer diameter was 36.3757 mm along the Y-axis, and 36.3763 mm along the X-axis. Interestingly, like the sagittal height, the outer diameter shrunk by 0.2401 mm on the Y-axis, and by 0.2395 mm on the X-axis.
Unlike the other measurements, the average edge thickness measured on the baseline prints was larger than the reference model, with the reference model having 0.25 mm in thickness and the prints having roughly 0.61 mm. This means the models grew in size as opposed to shrinking like in the other areas. This large deviation is consistent with a process-resolution limitation under the printer’s 0.4 mm nozzle condition; however, nozzle size was not experimentally varied. Nevertheless, the intended 0.25 mm edge thickness was not accurately reproduced under the printing conditions used in this study. As a result, this measurement was not used in the primary analysis and instead serves as a limitation of the current printing method. Future studies using higher-resolution printers may be able to reproduce this feature more accurately.
Pre-warped Prints
To compensate for the systematic deviations observed in the baseline dataset, the inverse of the measured deviations was applied to the reference digital model. This process produced a new pre-warped digital model designed to be intentionally distorted during printing with the goal of improving accuracy.
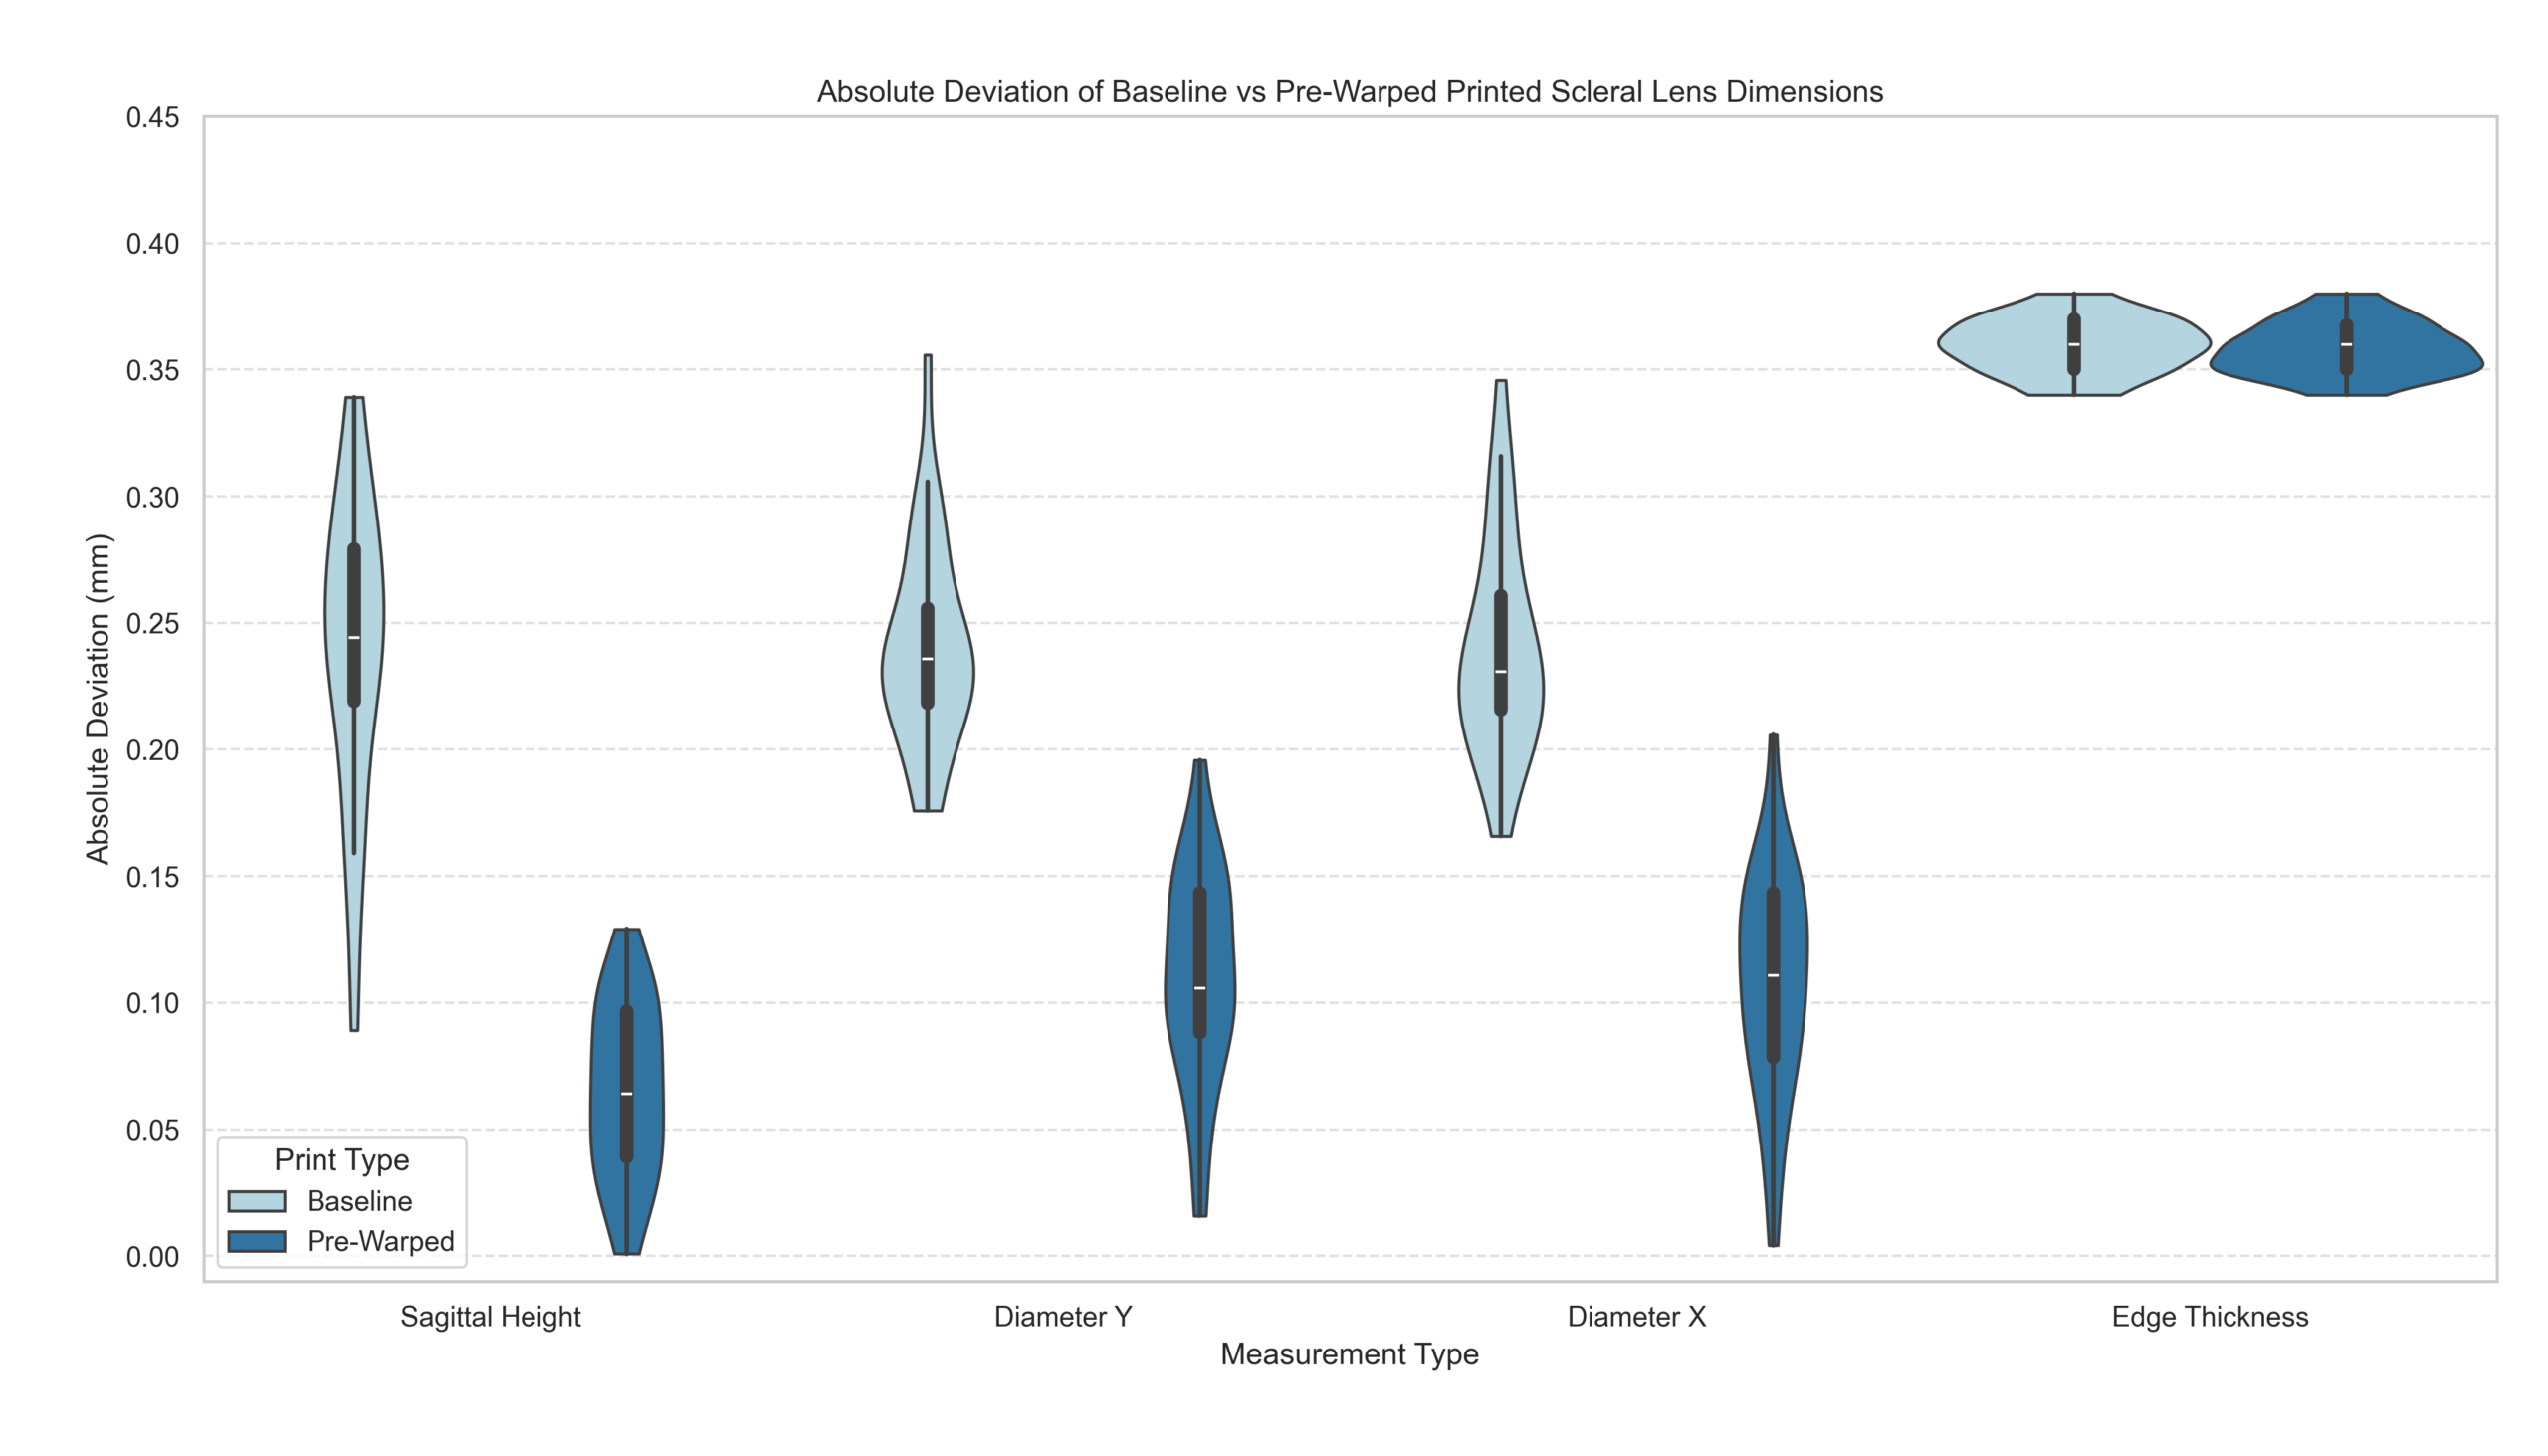
A second set of 30 printed models was produced under the same conditions as the baseline prints using this compensated digital model. The pre-warped printed models were then measured at the same four landmarks. The results of these measurements are summarized in Figure 4, which shows the absolute deviations for the baseline and pre-warped printed models. The average values for the pre-warped printed models were 10.3957 mm for the sagittal height, 36.5057 mm for the diameter on the Y-axis, and 36.5080 mm for the X-axis. These measurements corresponded to signed target-minus-mean deviations of 0.0634 mm for sagittal height, 0.1101 mm for the Y-axis diameter, and 0.1078 mm for the X-axis diameter. The mean edge thickness was 0.6083 mm, which was 0.3583 mm greater than the target; however, edge thickness was not independently compensated and was treated as a secondary outcome. These results indicate an overall reduction in geometric deviation to the original digital model, suggesting that pre-warping compensation improved dimensional accuracy. The corresponding mean absolute deviations for the pre-warped printed models plotted in Figure 4 were 0.0649 mm, 0.1101 mm, and 0.1081 mm, respectively.
Data Analysis
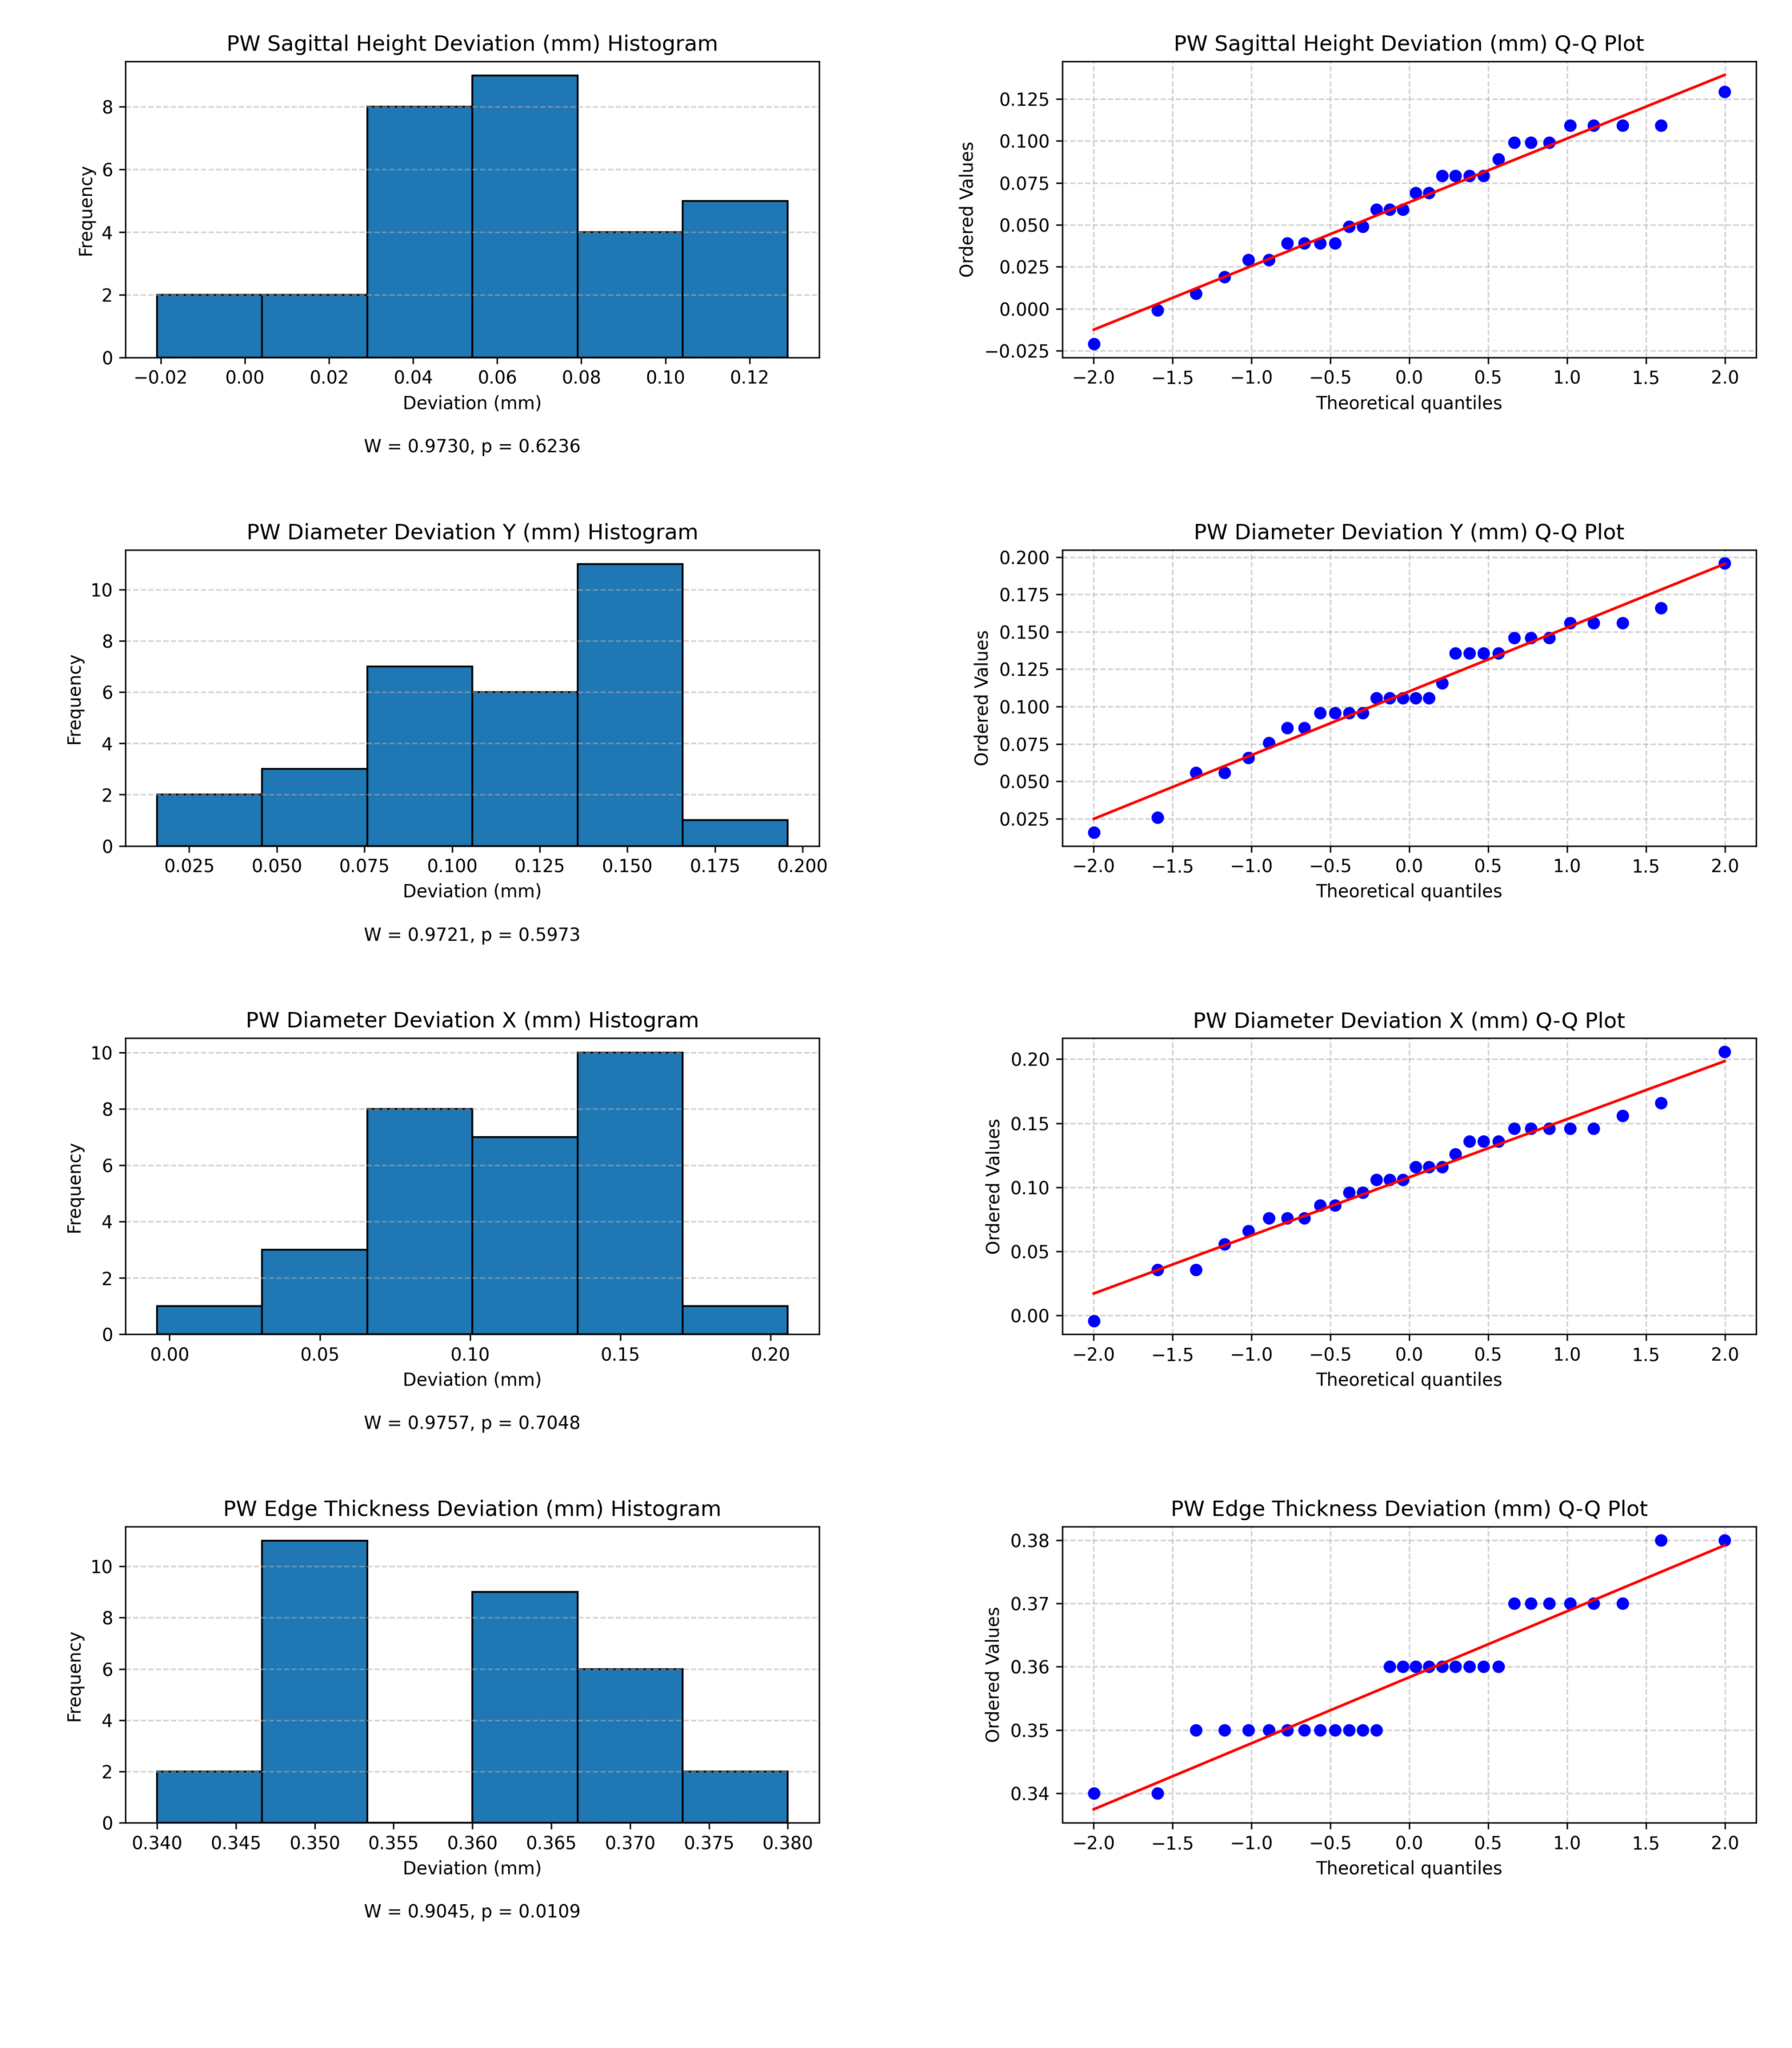
To determine the statistical properties of the collected measurements, normality tests were first performed on each dataset. Statistical analyses were performed in Python using the SciPy statistical-computing library. Shapiro-Wilk tests were used to assess whether the measurement distributions showed a statistically detectable departure from normality. The results indicated that sagittal height and diameter measurements produced p-values greater than 0.05, meaning that the tests did not detect statistically significant departures from normality. However, both edge-thickness datasets produced p-values below 0.05, indicating statistically detectable departures from normality. The Shapiro–Wilk normality results for the baseline and pre-warped measurements are shown in Figures 5 and 6, respectively.
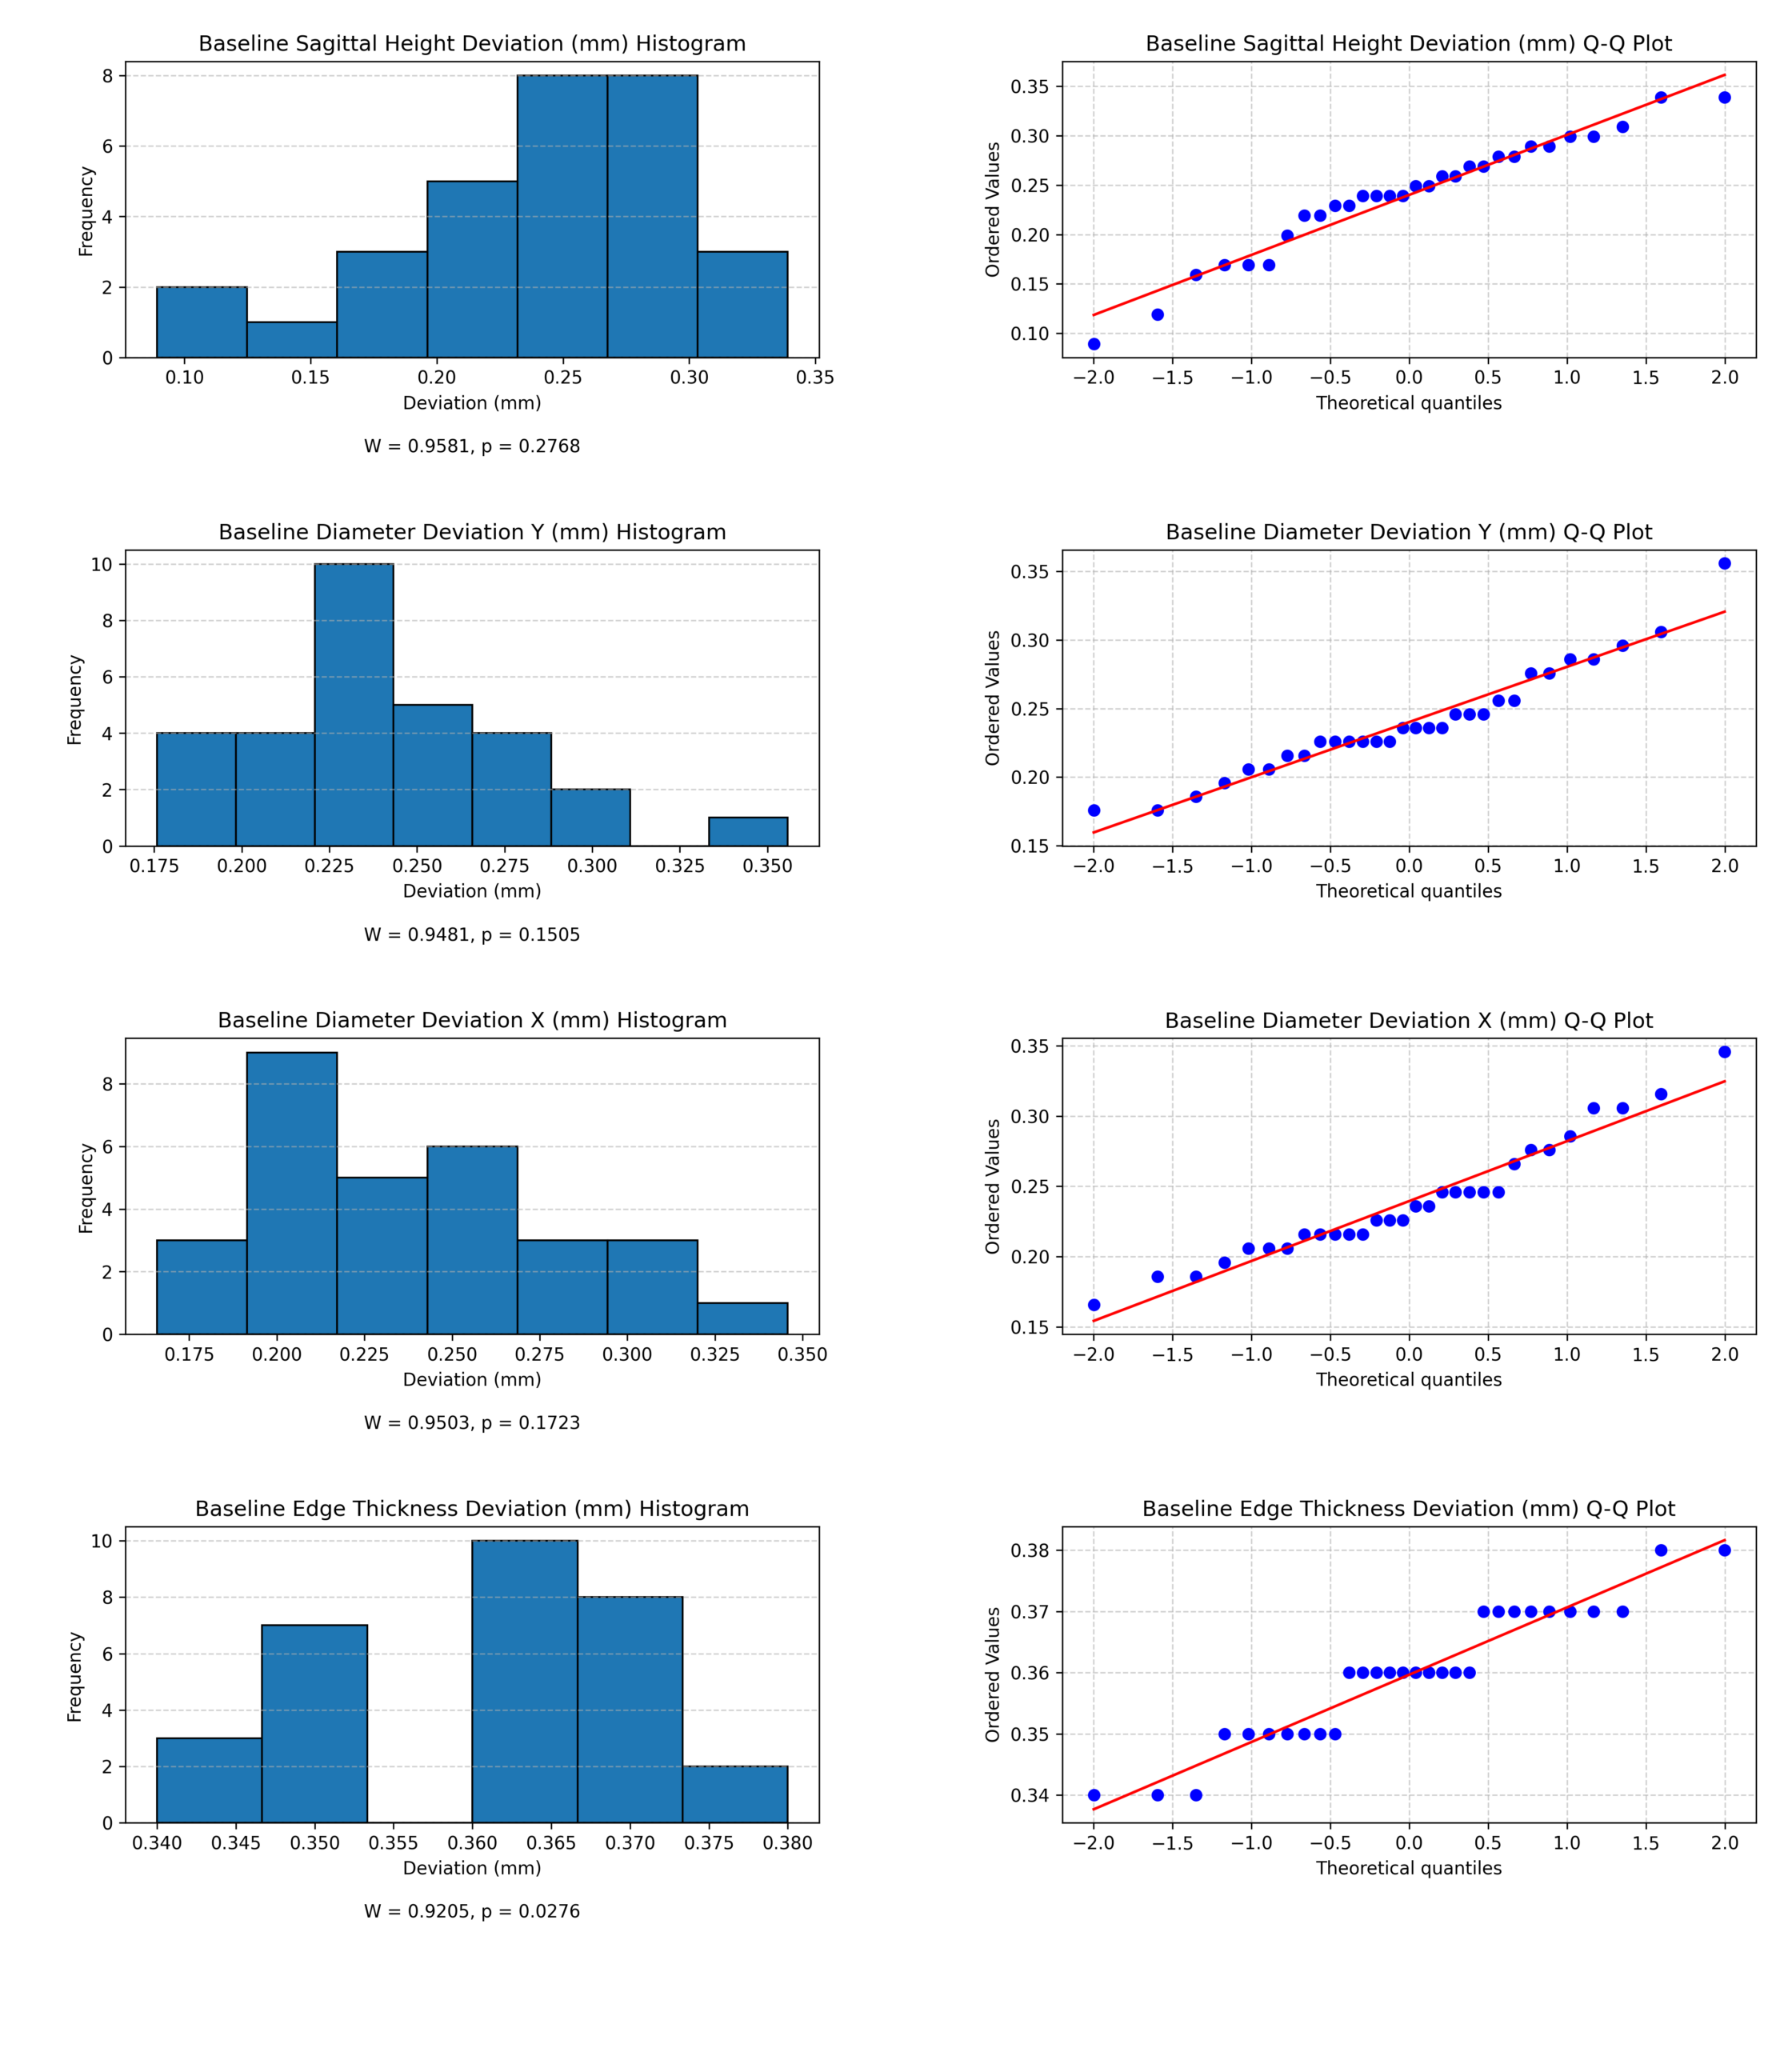
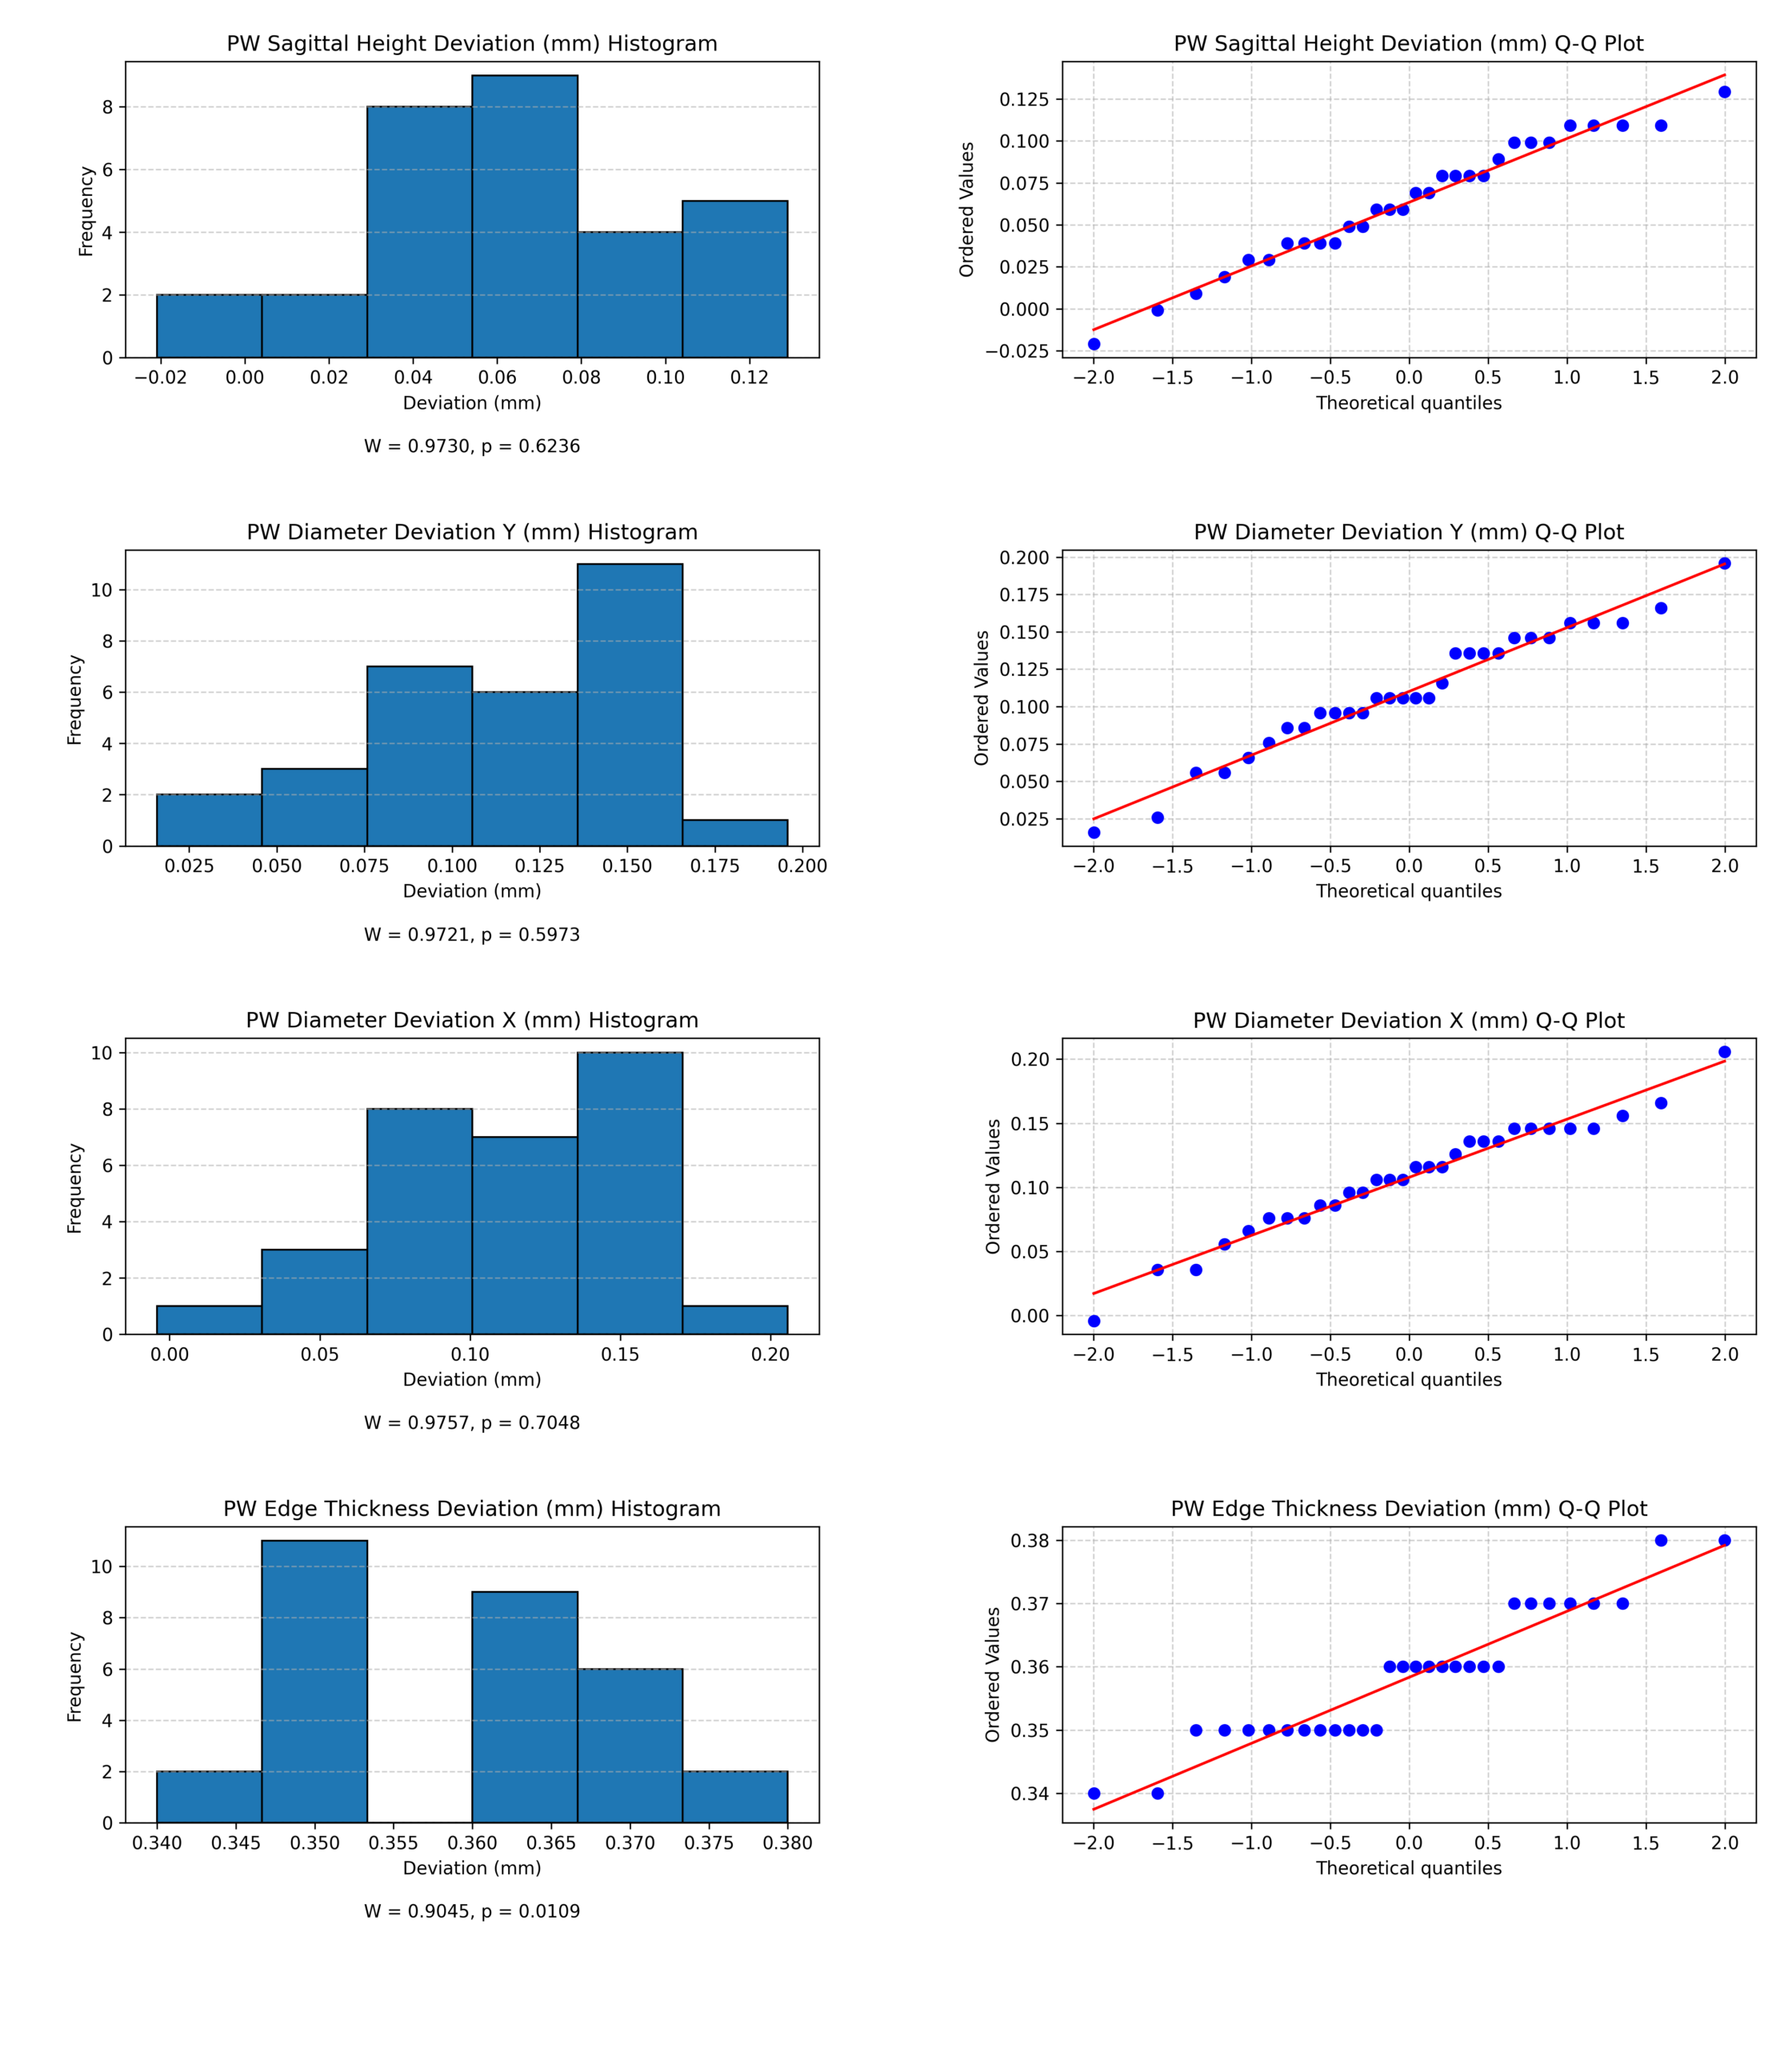
Following evaluation of the distributional assumptions, inferential statistical tests were conducted to identify any significant differences between the printed models and the reference digital model.
First, baseline printed-model measurements were compared to the intended geometric values of the digital model through one-sample t-tests, except for edge thickness, which was analyzed using a Wilcoxon signed-rank test because it was not normally distributed. All statistical tests were two-sided. Wilcoxon signed-rank tests used an asymptotic approximation without a continuity correction. The test results identified that there was a significant difference between the baseline prints and the original design as shown by the following test statistics:
Sagittal height: t(29) = -21.9951, p = 1.22896 x 10⁻¹⁹
Outer diameter (Y): t(29) = -32.9753, p = 1.52716 x 10⁻²⁴
Outer diameter (X): t(29) = -31.1254, p = 7.79253 x 10⁻²⁴
Edge thickness: W = 0, p = 1.42250 x 10⁻⁶
The test outcome confirmed that measurable geometric distortion relative to the intended design is introduced by the printing process.
Repeating the testing process using pre-warped printed models, with a Wilcoxon signed-rank test again used for edge thickness, also produced statistically significant differences between the pre-warped printed measurements and the original reference CAD model as shown below:
Sagittal height: t(29) = -9.4097, p = 2.57606 x 10⁻¹⁰
Outer diameter (Y): t(29) = -14.4789, p = 8.33165 x 10⁻¹⁵
Outer diameter (X): t(29) = -13.3087, p = 7.04079 x 10⁻¹⁴
Edge thickness: W = 0, p = 1.36168 x 10⁻⁶
The magnitude of the deviations was, however, reduced from those detected in the baseline dataset, reinforcing the notion that the dimensional accuracy of the printed models could be improved through pre-warping compensation.
Welch’s two-sample t-tests were conducted to directly compare the mean dimensions of the baseline and pre-warped printed models. Because edge thickness was not normally distributed, it was compared using a Mann–Whitney U test instead of Welch’s t-test. A two-sample Welch’s t-test was used to provide a direct comparison between the two manufacturing approaches to counter the possibility of unequal variance between the independent samples represented by the datasets. The test results identified a statistically significant difference between the baseline and pre-warped prints as shown by the following test statistics:
Sagittal height: t(48.3108) = -13.7700, p = 2.39764 x 10⁻¹⁸
Outer diameter (Y): t(57.8903) = -12.3452, p = 7.41680 x 10⁻¹⁸
Outer diameter (X): t(57.8470) = -11.7860, p = 5.18042 x 10⁻¹⁷
Edge thickness: U = 488.5, p = 0.559746
These Welch tests compared raw mean dimensions rather than absolute error magnitudes. The test results identified statistically significant shifts in sagittal height and X- and Y-axis diameter toward the original target dimensions when pre-warping was applied. No statistically significant difference was identified in edge thickness between baseline and pre-warped prints (p = 0.559746); however, edge thickness was not independently compensated.
Manufacturing behavior was further gauged by conducting a two-sample Welch’s t-test to compare the absolute deviations of the baseline and pre-warped prints against their respective CAD models. For this analysis, baseline deviations were calculated relative to the original CAD model, while pre-warped deviations were calculated relative to the compensated CAD model. It was determined that significantly greater deviation was present in the pre-warped prints across all primary geometric parameters:
Sagittal height: t(48.3108) = -4.9442, p = 9.62528 x 10⁻⁶
Outer diameter (Y): t(57.8903) = -10.4555, p = 5.93936 × 10⁻¹⁵
Outer diameter (X): t(57.8470) = -9.6526, p = 1.16264 × 10⁻¹³
Despite improved alignment with the original reference target, the pre-warped printed models demonstrate greater mean absolute deviation from their own compensated CAD design during fabrication. This indicates lower process fidelity to the compensated input geometry rather than poorer accuracy relative to the original target. In turn, whether additional iterations of the pre-warping process can reduce residual geometric error should be evaluated.
Finally, the raw dimensional measurements were subjected to Brown-Forsythe tests to determine the difference in variability of the prints.
Sagittal height: F(1, 58) = 3.3814, p = 0.071059
Outer diameter (Y): F(1, 58) = 0.2357, p = 0.629133
Outer diameter (X): F(1, 58) = 0.1084, p = 0.743123
Edge thickness: F(1, 58) = 0.0000, p = 1.000000
The tests did not identify statistically significant differences between the variability in the two sets of prints; however, these nonsignificant results do not establish that their variability was equal.
Discussion
Conclusions
This study has identified that digital pre-warping techniques can be used to both evaluate and partially correct geometric distortions generated as a result of 3D printing. Analysis of the baseline dataset also demonstrated systematic mean undersizing between the printed models and the reference digital model within the tested batch, which provided the basis for the applied compensation.
Accordingly, applying the inverse of the identified distortions to the digital design before printing enabled a reduction in the degree of geometric error in subsequently produced printed models, with sagittal height deviation decreasing from 0.2401 mm in baseline prints to approximately 0.0634 mm in pre-warped prints, alongside similar reductions in outer diameter deviation. Whilst some deviation in the required geometry was observed after the correction was applied, the magnitude of the deviation was reduced when compared to the baseline prints made.
The proof-of-concept results indicate that digital compensation improved the dimensional accuracy of the printed models under the tested conditions, with reductions in sagittal-height and X- and Y-axis diameter deviations but no significant improvement in edge thickness. Although these findings support further investigation of digital compensation, whether this approach can reduce clinical fitting iterations or manufacturing time remains unknown because the study did not test clinical-scale lenses, patient fit, or manufacturing duration.
Limitations of Research
This research focused directly on the geometric accuracy of the printed models and did not take into consideration the overall functional design. Dimensional accuracy is essential for the effective performance of SCLs; however, factors such as optical clarity, surface smoothness, oxygen permeability, and material biocompatibility must also be considered to render SCLs suitable for clinical use.
Although the study was successful in identifying that improvements in geometric accuracy can be achieved through digital pre-warping, research would need to continue in order to determine whether the degree of improvement achieved would be of a high enough standard to be applied to real-world clinical applications.
Implications of Research
The key finding of the research is that additive manufacturing combined with digital compensation techniques may provide a new approach to improving the dimensional accuracy of printed SCL models. A closer match to the intended CAD design may support future research investigating whether pre-warping can reduce iterative adjustments during manufacturing. However, clinical fitting, manufacturing time, production costs, and patient access were not evaluated in this study and remain subjects for future testing.
Future Work
Having observed that pre-warping partially improved dimensional accuracy under the tested conditions, further research in this area should be directed towards the use and impact of higher-precision additive manufacturing systems, such as SLA and digital light processing, to address geometric distortion. Future studies should evaluate whether SLA and DLP printers can produce the fine geometric detail and smooth surfaces required for SCLs. In addition to the technology used, expansion of this research should also consider the baseline materials used for testing. To that end, biocompatible oxygen-permeable materials should be introduced into the research as these materials are currently used to manufacture commercial SCLs. A further expansion of the research could also be to include patient-specific ocular surface scans into the design process. Combining patient-specific scans with predicted geometric distortions of the lens material could further improve the efficiency of 3D printing as a means of manufacturing SCLs. The evaluation of the impact of improving geometric accuracy on clinical outcomes including comfort, visual acuity, and tear reservoir stability, could provide important markers on the path to real-world application of this technology.
Contributions to Literature
Awareness of DED has risen in recent years, and, consequently, the ability to assist with the management of this growing disorder is vitally important. This research contributed to an increasing body of literature covering the exploration of the use of additive manufacturing in ophthalmic device production. Previous studies have demonstrated the potential for additive manufacturing within ophthalmology, while also highlighting limitations in surface finish and post-processing10,28. However, there has been relatively little research focusing on the challenge of dimensional accuracy involved in the production of rigid SCLs. Through the quantification of baseline geometric distortion and subsequent testing incorporating digital pre-warping compensation, this study has provided a framework for evaluating dimensional compensation in 3D-printed scleral-lens models. In addition, the findings of this paper could provide a foundation for future research investigating computationally optimized manufacturing techniques for other ophthalmic devices that require precise, patient-specific production.
Acknowledgments
The author thanks Branden Anglin for his guidance throughout the research project, Dr. Samuel J. Teske of True Eye Experts for providing the discarded commercial scleral lens, and Tim Prentice and Kenedi Curtis of Micro-Epsilon for their initial assistance with three-dimensional scanning.
Supplementary Information
References
- J. Sheppard, B. S. Lee, L. M. Periman. Dry eye disease: identification and therapeutic strategies for primary care clinicians and clinical specialists. Annals of Medicine. Vol. 55, pg. 241–252, 2023, https://doi.org/10.1080/07853890.2022.2157477. [↩] [↩] [↩] [↩]
- S. Nunziata, D. Petrini, S. Dell’Anno, V. Barone, M. Coassin, A. Di Zazzo. Customized scleral lenses: an alternative tool for severe dry eye disease—a case series. Journal of Clinical Medicine. Vol. 13, pg. 3935, 2024, https://doi.org/10.3390/jcm13133935. [↩] [↩] [↩] [↩]
- M. B. Doctor, S. Basu. Lacrimal gland insufficiency in aqueous deficiency dry eye disease: recent advances in pathogenesis, diagnosis, and treatment. Seminars in Ophthalmology. Vol. 37, pg. 801–812, 2022, https://doi.org/10.1080/08820538.2022.2075706. [↩]
- S. D. Mathebula. Latest developments on meibomian gland dysfunction: diagnosis, treatment and management. African Vision and Eye Health. Vol. 81, pg. a713, 2022, https://doi.org/10.4102/aveh.v81i1.713. [↩]
- P. Narang, P. R. Donthineni, S. D’Souza, S. Basu. Evaporative dry eye disease due to meibomian gland dysfunction: preferred practice pattern guidelines for diagnosis and treatment. Indian Journal of Ophthalmology. Vol. 71, pg. 1348–1356, 2023, https://doi.org/10.4103/ijo.ijo_2841_22. [↩]
- S. X. Qiu, D. Fadel, A. Hui. Scleral lenses for managing dry eye disease in the absence of corneal irregularities: what is the current evidence? Journal of Clinical Medicine. Vol. 13, pg. 3838, 2024, https://doi.org/10.3390/jcm13133838. [↩] [↩] [↩] [↩]
- R. G. Mabaso, H. L. Sithole. Scleral topography and its usefulness in scleral lens fitting. African Vision and Eye Health. Vol. 80, pg. a622, 2021, https://doi.org/10.4102/aveh.v80i1.622. [↩]
- R. J. Macedo-de-Araújo, D. Fadel, M. Barnett. How can we best measure the performance of scleral lenses? Current insights. Clinical Optometry. Vol. 14, pg. 47–65, 2022, https://doi.org/10.2147/OPTO.S284632. [↩] [↩] [↩]
- M. M. Schornack, J. Fogt, A. Nau, C. B. Nau, J. S. Harthan, D. Cao, E. Shorter. Scleral lens prescription and management practices: emerging consensus. Contact Lens and Anterior Eye. Vol. 46, pg. 101501, 2023, https://doi.org/10.1016/j.clae.2021.101501. [↩]
- F. Alam, M. Elsherif, B. AlQattan, A. Salih, S. M. Lee, A. K. Yetisen, S. Park, H. Butt. 3D printed contact lenses. ACS Biomaterials Science & Engineering. Vol. 7, pg. 794–803, 2021, https://doi.org/10.1021/acsbiomaterials.0c01470. [↩] [↩] [↩]
- J. Ramian, J. Ramian, D. Dziob. Thermal deformations of thermoplast during 3D printing: warping in the case of ABS. Materials. Vol. 14, pg. 7070, 2021, https://doi.org/10.3390/ma14227070. [↩] [↩] [↩]
- S. Afazov, E. Semerdzhieva, D. Scrimieri, A. Serjouei, B. Kairoshev, F. Derguti. An improved distortion compensation approach for additive manufacturing using optically scanned data. Virtual and Physical Prototyping. Vol. 16, pg. 1–13, 2021, https://doi.org/10.1080/17452759.2021.1881702. [↩] [↩] [↩] [↩]
- K. Y. Wu, A. Dave, P. Daigle, S. D. Tran. Advanced biomaterials for lacrimal tissue engineering: a review. Materials. Vol. 17, pg. 5425, 2024, https://doi.org/10.3390/ma17225425. [↩]
- V. Barone, D. Petrini, S. Nunziata, P. L. Surico, C. Scarani, F. Offi, V. Villani, M. Coassin, A. Di Zazzo. Impact of scleral lenses on visual acuity and ocular aberrations in corneal ectasia: a comprehensive review. Journal of Personalized Medicine. Vol. 14, pg. 1051, 2024, https://doi.org/10.3390/jpm14101051. [↩]
- E. Shorter, M. Schornack, J. Harthan, A. Nau, J. S. Fogt, D. Cao, C. B. Nau. Keratoconus patient satisfaction and care burden with corneal gas-permeable and scleral lenses. Optometry and Vision Science. Vol. 97, pg. 790–796, 2020, https://doi.org/10.1097/OPX.0000000000001565. [↩]
- E. Shorter, C. B. Nau, J. S. Fogt, A. Nau, M. Schornack, J. Harthan. Patient experiences with therapeutic contact lenses and dry eye disease. Eye & Contact Lens: Science & Clinical Practice. Vol. 50, pg. 59–64, 2024, https://doi.org/10.1097/ICL.0000000000001051. [↩]
- J. Moon, S.-M. Lee, J. Y. Hyon, M. K. Kim, J. Y. Oh, H. J. Choi. Large diameter scleral lens benefits for Asians with intractable ocular surface diseases: a prospective, single-arm clinical trial. Scientific Reports. Vol. 11, pg. 2288, 2021, https://doi.org/10.1038/s41598-021-82010-z. [↩]
- C. Lu, D. Han, L. Zeng, J. Hong, D. Fadel, X. Zhou, Z. Chen, Q. Le. Short-term efficacy and safety of scleral lenses in the management of severe dry eye in a Chinese population. Journal of Clinical Medicine. Vol. 14, pg. 658, 2025, https://doi.org/10.3390/jcm14030658. [↩]
- P. Kumar, K. G. Carrasquillo, S. Chaudhary, S. Basu. A multi-parameter grading system for optimal fitting of scleral contact lenses. F1000Research. Vol. 11, pg. 6, 2022, https://doi.org/10.12688/f1000research.74638.2. [↩] [↩] [↩]
- M. Villa, F. Cavas, D. P. Piñero. Optical impact of corneal clearance in healthy eyes fitted with scleral contact lenses: a pilot study. Journal of Clinical Medicine. Vol. 11, pg. 3424, 2022, https://doi.org/10.3390/jcm11123424. [↩]
- T. V. Litvin, V. Tse, L. Chung, Y. Zhou, B. Tan, Y. Han, M. C. Lin. Effect of scleral contact lens size and duration of wear on intraocular pressure. Eye & Contact Lens: Science & Clinical Practice. Vol. 49, pg. e357–e363, 2023, https://doi.org/10.1097/ICL.0000000000001012. [↩]
- M. M. Schornack, C. B. Nau, J. Harthan, E. Shorter, A. Nau, J. Fogt. Current trends in scleral lens prescription, management, and evaluation. Eye & Contact Lens: Science & Clinical Practice. Vol. 49, pg. 56–62, 2023, https://doi.org/10.1097/ICL.0000000000000957. [↩]
- K. E. Lee, S. Y. Moon, S. Nam, J. H. Jang, J. Y. Kim, H. Tchah, H. Lee. Scleral lens applications focused on Korean patients with various corneal disorders. Korean Journal of Ophthalmology. Vol. 37, pg. 157–165, 2023, https://doi.org/10.3341/kjo.2022.0164. [↩]
- S. R. Hadimani, H. Kaur, A. J. Shinde, T. Chottopadhyay. Quality of life and vision assessment with scleral lenses in keratoconus. Saudi Journal of Ophthalmology. Vol. 38, pg. 173–178, 2024, https://doi.org/10.4103/sjopt.sjopt_157_23. [↩]
- H. Yoon, J. S. Harthan, W. Skoog, J. S. Fogt, A. Nau, C. B. Nau, M. Schornack, E. Shorter. Process and outcomes of fitting corneoscleral profilometry-driven scleral lenses for patients with ocular surface disease. Eye & Contact Lens: Science & Clinical Practice. Vol. 50, pg. 132–137, 2024, https://doi.org/10.1097/ICL.0000000000001064. [↩]
- F. Wang, S. J. Vincent, P. Cho, Y. Shen, Z. Sheng, M. Shen, J. Jiang. Wide-angle fluid reservoir thickness changes during short-term scleral lens wear. Eye and Vision. Vol. 12, pg. 27, 2025, https://doi.org/10.1186/s40662-025-00443-3. [↩]
- G. Debellemanière, M. Flores, M. Montard, B. Delbosc, M. Saleh. Three-dimensional printing of optical lenses and ophthalmic surgery: challenges and perspectives. Journal of Refractive Surgery. Vol. 32, pg. 201–204, 2016, https://doi.org/10.3928/1081597X-20160121-05. [↩]
- Y. Fakhoury, A. A. Ellabban, U. Attia, A. Sallam, S. Elsherbiny. Three-dimensional printing in ophthalmology and eye care: current applications and future developments. Therapeutic Advances in Ophthalmology. Vol. 14, pg. 25158414221106682, 2022, https://doi.org/10.1177/25158414221106682. [↩] [↩]
- M. Hisham, A. E. Salih, H. Butt. 3D printing of multimaterial contact lenses. ACS Biomaterials Science & Engineering. Vol. 9, pg. 4381–4391, 2023, https://doi.org/10.1021/acsbiomaterials.3c00175. [↩]
- M. Hisham, H. Butt. Vat photopolymerization printing of functionalized hydrogels on commercial contact lenses. Scientific Reports. Vol. 14, pg. 13860, 2024, https://doi.org/10.1038/s41598-024-63846-7. [↩]
- S. Hittini, A. E. Salih, F. Alam, A. Shanti, S. Lee, K. Polychronopoulou, H. AlSafar, F. Almaskari, H. Butt. Fabrication of 3D-printed contact lenses and their potential as color blindness ocular aids. Macromolecular Materials and Engineering. Vol. 308, pg. 2200601, 2023, https://doi.org/10.1002/mame.202200601. [↩]
- E. Goto, T. Tagami, K. Ogawa, T. Ozeki. Fabrication of 3D-printed contact lens composed of polyethylene glycol diacrylate for controlled release of azithromycin. Biological & Pharmaceutical Bulletin. Vol. 46, pg. 1461–1467, 2023, https://doi.org/10.1248/bpb.b23-00443. [↩]
- Y. M. G. Mohamdeen, A. G. Tabriz, M. Tighsazzadeh, U. Nandi, R. Khalaj, I. Andreadis, J. S. Boateng, D. Douroumis. Development of 3D printed drug-eluting contact lenses. Journal of Pharmacy and Pharmacology. Vol. 74, pg. 1467–1476, 2022, https://doi.org/10.1093/jpp/rgab173. [↩] [↩]
- P. Garg, P. Shokrollahi, H. F. Darge, C.-M. Phan, L. Jones. 3D-printed contact lenses to release polyvinyl alcohol as a therapeutic agent for the treatment of dry eyes. Pharmaceutics. Vol. 17, pg. 219, 2025, https://doi.org/10.3390/pharmaceutics17020219. [↩]
- A. Marczis, M. Odrobina, Á. Drégelyi-Kiss. Computed tomography as distortion mitigation method for selective laser sintering mass production. The International Journal of Advanced Manufacturing Technology. Vol. 133, pg. 4845–4864, 2024, https://doi.org/10.1007/s00170-024-14018-4. [↩] [↩] [↩]
- M. Jadayel, F. Khameneifar. Improving geometric accuracy of 3D printed parts using 3D metrology feedback and mesh morphing. Journal of Manufacturing and Materials Processing. Vol. 4, pg. 112, 2020, https://doi.org/10.3390/jmmp4040112. [↩]
- B. Haldar. Enhancing dimensional accuracy in budget-friendly 3D printing through solid model geometry tuning and its use in rapid casting. Machines. Vol. 11, pg. 1020, 2023, https://doi.org/10.3390/machines11111020. [↩]
- W. Dong, B. J. Paudel, H. Deng, S. Garner, A. C. To. Data-driven distortion compensation for laser powder bed fusion process using Gaussian process regression and inherent strain method. Materials & Design. Vol. 243, pg. 113063, 2024, https://doi.org/10.1016/j.matdes.2024.113063. [↩]
- P. Lechner, C. Hartmann, D. Wolf, A. Habiba. Deviation compensation in LPBF series production via statistical predeformation and structural pattern analysis. Journal of Intelligent Manufacturing. Vol. 35, pg. 2645–2652, 2024, https://doi.org/10.1007/s10845-023-02166-5. [↩]
- K. Ráž, Z. Chval, S. Thomann. Minimizing deformations during HP MJF 3D printing. Materials. Vol. 16, pg. 7389, 2023, https://doi.org/10.3390/ma16237389. [↩]
- N. Khatun. Applications of normality test in statistical analysis. Open Journal of Statistics. Vol. 11, pg. 113–122, 2021, https://doi.org/10.4236/ojs.2021.111006. [↩] [↩]
- K. R. B. Jankowski, K. J. Flannelly, L. T. Flannelly. The t-test: an influential inferential tool in chaplaincy and other healthcare research. Journal of Health Care Chaplaincy. Vol. 24, pg. 30–39, 2018, https://doi.org/10.1080/08854726.2017.1335050. [↩]
- M. Delacre, D. Lakens, C. Leys. Why psychologists should by default use Welch’s t-test instead of Student’s t-test. International Review of Social Psychology. Vol. 30, pg. 92–101, 2017, https://doi.org/10.5334/irsp.82. [↩]
- Y. Zhou, Y. Zhu, W. K. Wong. Statistical tests for homogeneity of variance for clinical trials and recommendations. Contemporary Clinical Trials Communications. Vol. 33, pg. 101119, 2023, https://doi.org/10.1016/j.conctc.2023.101119. [↩]