
Abstract
According to the State of Food Security and Nutrition in the World (SOFI) report published in July 2024, 2.33 billion individuals worldwide struggle with food insecurity, lacking consistent access to nutritious meals crucial for a healthy life, prompting this research to explore the question: “How can machine learning be used to predict the prevalence of food insecurity worldwide?1” The goal of this machine learning model was to predict the prevalence of food insecurity in any location by inputting different factors such as the country, region, the year, and other demographic data to find the prevalence of food insecurity in that particular location. Food insecurity stems from many factors, including poverty, distribution inefficiencies, climate change, political instability, to name a few. Using AI to combat food insecurity is a promising solution, as it has the ability to mitigate hunger for millions by spreading awareness and allocating timely resources where needed. In addressing this challenge, the “KPIs for Food Waste, Insecurity, & Overconsumption” dataset was used, which contains self-reported statistics and data pertinent to food insecurity in major cities worldwide. The dataset was extensively analyzed, and any irrelevant information was filtered, ensuring the data was optimized for computational analysis. Through much experimentation with various machine learning models, the Random Forest Regressor was identified as the most accurate predictor. The results of this model were a mean squared error of approximately 150,700, a mean absolute error was approximately 59,000, and an R2 score of 0.78. In conclusion, the Random Forest Regressor model accurately predicted food insecurity in any geographical area at any given time with a high degree of precision using machine learning.
Introduction
Food insecurity is a continual global challenge, affecting millions worldwide. In 2020, over 35 million Americans, including 10.7 million children, experienced food insecurity at some point, representing approximately 10.5% of households nationwide2. Among minority communities, the situation was particularly worse, with Black and Hispanic households facing higher rates of food insecurity, with 19.1% and 15.6% respectively, compared to 7.9% for white households3.
Understanding its root causes and thereby creating effective solutions is critical, so that there is equitable access to nutritious food for all. If food insecurity is left unaddressed, it can lead to individual, familial, and communal problems. Research has shown an increased incidence in mental health issues, such as depression and anxiety, and in chronic conditions like diabetes, and other related ailments4. It can also lead to severe academic challenges for children which leads to a cycle of poverty, and long term disadvantages for these societies. Along with these problems, high levels of food insecurity have also been shown to strain family relationships, reduce productivity, and limit access to education and employment. Solving this issue can lead to healthier communities, improved quality of life for many, and a more productive society. This project aims to tackle this global challenge through machine learning, focusing on the essential question of: “How can machine learning be used to predict the prevalence of food insecurity worldwide?”
This model involved developing a user-friendly approach allowing individuals to input different variables such as the year, country, organization, and/or region to predict food insecurity levels in specific areas. The dataset takes into account socioeconomic status, demographics, and geographical locations. It also considers factors such as access to education, healthcare, and housing stability, as these are often tied to economic status and play a significant role in a community’s vulnerability to food insecurity. By incorporating these elements, the model captures a broad picture of the economic landscape and its influence on food insecurity.
Using predictive analytics and machine learning algorithms, the overarching goal was to identify trends, as well as showcase future scenarios related to food insecurity. The task was a supervised regression problem, which predicted the quantity of food insecurity cases based on categorical data inputs.
In summary, this research used machine learning to address food insecurity. Through comprehensive data analysis and advanced techniques, the objective was to contribute effective solutions to this critical global challenge.
Background
Several approaches have been explored to address the issue of food insecurity, each offering important information and data. Artificial intelligence also plays a huge role in reducing the severity of food insecurity through bibliometric analysis. The research focused on AI’s potential to contribute to food systems and achieve Sustainable Development Goal 2 of zero hunger (creating a world free of hunger by 2030)5. However, this study faced limitations such as data quality concerns and a potential oversight of other communication channels. Other limitations included incomplete representation of different variables in the dataset and relevant factors which contribute to food insecurity, as well as assumptions of food insecurity patterns.
To address these limitations, this model explored an additional database beyond those currently used. It also analyzed maps and used various data analysis techniques to improve the overall accuracy of the results.
In addition, various publications helped guide the direction of this research by showing the significance of available data sources, such as food-sharing platforms, in understanding complex issues like food insecurity. They revealed the potential of machine learning methods to uncover hidden aspects of food insecurity. By using information from these studies, the intent was to develop a comprehensive model that combines predictive analytics with data analysis and different classification techniques. This approach addressed the limitations identified in previous research while capitalizing on the potential of machine learning to provide useful statistics about food insecurity.
Dataset
For this project, the “KPIs for Food Waste, Insecurity, & Overconsumption ” dataset was utilized. This data came from the CDP (Carbon Disclosure Project), and was self-reported by the cities. It primarily has numerical data containing statistics and metrics related to food waste, food insecurity, and overconsumption across multiple cities and countries. This includes the number of food insecurity cases, the year reported to CDP (Carbon Disclosure Project), organization, parent section (city-wide emissions, opportunities, e.t.c), to name a few. There are also categorical features representing different cities and countries. With a total of 869,313 entries, each entry corresponds to a specific city’s data, which gives an overview of various factors contributing to food insecurity. The dataset includes 18 features per location along with approximately 49,000 rows representing categorical features with the different cities and countries.
Given the categorical nature of certain features, preprocessing was necessary to convert categorical data into numerical counterparts. This was done through label encoding, ensuring that the data could be effectively processed by machine learning algorithms. Without this step, categorical variables such as country and organization names would not be interpretable by the model. For this model, the country, organization, year reported to CDP, and CDP regions were chosen as the sole variables. This helped tremendously in identifying which features were the most relevant to the research question.
This dataset is also solely composed of self-reported data. This can introduce biases due to underreporting, inconsistent survey methods, and regional differences in data collection. Some areas may overestimate or underestimate food insecurity levels based on political influences or reporting standards, leading to potential inaccuracies in the model. While this can introduce some biases, the dataset used in this study provides valuable insights due to its extensive global coverage and consistent reporting from trusted organizations.
Another crucial aspect of preprocessing was handling missing values. The dataset contained null values in several key features, including food insecurity cases, organization, and parent section data. To maintain the dataset’s integrity and avoid dropping valuable records, missing values were filled with 0 where appropriate. However, careful consideration was given to this approach, as filling missing values with 0 assumes that the absence of a value means “no data available” rather than zero reported cases. This decision was particularly impactful for food insecurity case counts, as a missing value does not necessarily indicate zero food insecurity cases but rather a lack of reported data. However, this also means that replacing these values with 0 may lead to an underestimation of food insecurity prevalence in those areas, as it does not account for unreported but potentially significant cases.
The dataset contains several key features, including year, country, organization, and region, which were carefully selected for their relevance in predicting food insecurity. Year was included to analyze trends over time and assess how food insecurity fluctuates due to economic, political, and environmental factors. Country serves as a crucial indicator, as food insecurity varies significantly across nations due to differences in economic stability, agricultural output, and social policies6. Organization represents the entities reporting the data, which helps identify how different institutions contribute to food insecurity efforts and may introduce variability in reporting standards. Region provides a more localized view, allowing the model to detect geographic patterns and disparities within countries. These features were chosen because they collectively offer a comprehensive understanding of factors influencing food insecurity, enabling the machine learning model to make more accurate predictions.
Instances of data imbalance were noticed when certain categories or sections in the dataset had significantly more data than others, which is the case in our study, where certain regions or years have more recorded instances of food insecurity. This imbalance can impact the results by causing the model to be biased toward the more frequent categories, potentially leading to less accurate predictions for underrepresented sections. The model may overfit to the more common data points, resulting in lower performance when predicting food insecurity for areas or years with fewer data points. We addressed this imbalance through techniques like oversampling, undersampling, or reweighting which helped improve the model’s overall reliability and accuracy across all categories.
A noticeable spread in the year variable was noticed as well, with potential outliers present. These outliers may be attributed to inconsistent or incomplete reporting across different periods, as some years had significantly fewer recorded cases of food insecurity while others experienced spikes due to economic downturns, climate-related disasters, or policy changes. For instance, global crises such as the COVID-19 pandemic in 2020 or economic recessions in the late 2000s may have caused irregularities in reporting trends, leading to fluctuations in the dataset. Additionally, discrepancies in how cities and organizations reported their data across different years could have introduced variability. The presence of these outliers is essential, as they provide insights into how external events influence food insecurity trends rather than simply being dismissed as errors. By accounting for these variations, the model can better interpret periods of heightened food insecurity and adjust predictions accordingly.
To train and evaluate these machine learning models, the dataset was split into training and testing subsets. Eighty percent of the data was assigned for training and the remaining 20% for testing. This 4:1 ratio was chosen based on the general practice of using 70-90% of data on training. Additionally, the model was trained on a diverse set of data and evaluated on unseen samples, allowing for improved performance assessment.
The dataset chosen accounts for regional and cultural differences by incorporating data from various countries and regions, allowing the model to recognize how food insecurity varies across different socioeconomic and geographic contexts. Since food availability, consumption habits, and reporting standards differ between regions, the dataset adapts by including localized factors such as regional food waste, overconsumption, and city-wide emissions. This ensures that predictions are not biased toward a single country’s food insecurity patterns but instead reflect global disparities and localized trends. By considering these factors, the dataset provides a more comprehensive and adaptable foundation for predicting food insecurity across diverse populations.
Methods
The supervised learning technique was used, which was a category of machine learning that employs labeled data to predict outcomes and recognize patterns. The country, organization, and Year Reported to CDP are input variables within this model, with the prevalence of food insecurity being generated. With factors like poverty and distribution inefficiencies making food insecurity worse, the importance of using AI to spread awareness and potentially allocate resources was tremendous.
This exploration included many machine learning models such as Linear Regression, which provided a good understanding by fitting a linear equation to the data. Techniques like Ridge Regression and Lasso Regression were also used to prevent overfitting and increase the model’s generalization. Decision trees and support vector regressors were also attempted, which offered different approaches to uncover patterns in the data. To determine the optimal model, the mean squared error, mean absolute error, and R2 score were all taken into account. Mean squared error measures the average of the squared differences between predicted and actual values, penalizing larger errors more heavily. Mean absolute error calculates the average of the absolute differences between predicted and actual values, providing a straightforward measure of prediction accuracy. R2 score represents the proportion of variance in the data that is explained by the model, with a higher R2 indicating a better fit, and is measured on a scale from 0 to 1.
The Linear Regression Model is often used to establish a linear relationship between the input features and the target variable. It works by fitting a straight line to the data by minimizing the sum of squared differences between predicted and actual values. This model is advantageous because of its simplicity and interpretability. However, it assumes a linear relationship between variables, making it ineffective for capturing complex patterns in the data, and one of the major reasons it was not chosen as the model best for this data. In our analysis, Linear Regression produced a mean squared error of 138,456, a mean absolute error of 3,492.54, and an R2 score of 0.65, indicating moderate predictive power but lower accuracy compared to the other more advanced models.
The Ridge Regression Model was an extension of Linear Regression that included an L2 regularization term, which penalizes large coefficient values to reduce overfitting. Ridge regression is beneficial when the dataset has many correlated features that could lead to high variance in predictions. However, its main drawback is that it shrinks coefficients toward zero but never eliminates them, meaning that all input features remain in the model even if some have little impact on predictions. Ridge Regression performed slightly better than basic Linear Regression but was still outperformed by the more complex models in our study. This model produced a mean squared error of 140,256, a mean absolute error of 4,322.64, and an R2 score of 0.57.
Lasso Regression is similar to Ridge Regression but incorporates L1 regularization, which forces some feature coefficients to zero, effectively performing feature selection. This makes Lasso useful for high-dimensional datasets where some features may be irrelevant. By reducing the complexity of the model, it helps improve interpretability and reduce overfitting. However, an aggressive penalty may lead to the exclusion of important variables, weakening predictive performance. In our study, Lasso Regression showed improvements in generalization compared to Linear Regression, but it did not achieve the lowest error due to the complexity of food insecurity prediction, which relies on multiple interacting factors. It produced a mean squared error of 200,152, a mean absolute error of 5,223.61, and an R2 score of 0.59.
The Decision Tree Regressor is a non-linear model that splits data into subsets based on the most informative feature at each step, creating a tree-like structure. Each branch represents a decision rule, while the leaves contain the final predictions. Decision trees excel at handling non-linear relationships, making them a powerful choice for complex datasets. However, they are highly prone to overfitting, meaning that while they perform well on training data, they may generalize poorly to unseen data. The model was only trained on 20% of the data, making this regressor not optimal. It produced a mean squared error of 150,386, a mean absolute error of 5,125.87, and an R2 score of 0.68.
The Random Forest Regressor is an ensemble learning technique that builds multiple decision trees and averages their predictions to improve accuracy and reduce overfitting. Unlike a single decision tree, which may be highly sensitive to training data, Random Forest uses bagging to create diverse trees, improving robustness. It also assigns feature importance, allowing us to understand which variables have the most impact on food insecurity predictions. In our study, Random Forest Regressor consistently outperformed all other models, achieving a mean squared error of 150,700, a mean absolute error of 59,166, and an R2 score of 0.78. These results confirmed that the model was able to capture complex relationships in the data, making it the most reliable predictor of food insecurity prevalence.
The mean squared error of 150,700 indicates the average squared difference between the predicted and actual values, demonstrating how far off the model’s predictions are on average. While a lower one is ideal, this value suggests that the model is making reasonably accurate predictions but still has some degree of error, which could be improved with further tuning or additional data. The mean absolute error of 59,166 represents the average absolute difference between predicted and actual food insecurity cases. This means that, on average, the model’s predictions deviate by approximately 59,166 cases from actual reported values. Lastly, the R2 score of 0.78 suggests that the model explains 78% of the variance in food insecurity levels based on the input features. This relatively high R2 value indicates that the model effectively captures the relationship between food insecurity and its contributing factors, though there is still 22% of the variation that is unexplained, possibly due to missing variables or external influences not captured in the dataset. Overall, these metrics demonstrate that the Random Forest Regressor is a strong predictor for food insecurity trends, though improvements in data quality, feature selection, or hyperparameter tuning could further refine its accuracy.
The model works by analyzing patterns and relationships in the input data to predict the target variable, in this case, food insecurity. It starts by examining the features and learning how these attributes influence the outcome based on historical data. Through a process of training, the model adjusts its internal parameters to minimize the difference between the predicted and actual values. It does this by identifying key patterns and interactions within the data, effectively learning the rules that best describe the relationship between the input features and the target. Once trained, the model can then make predictions on new, unseen data by applying the learned patterns, assessing how the given inputs relate to food insecurity levels, and generating the corresponding predictions. In doing so, it continuously refines its ability to provide accurate forecasts by utilizing the patterns and trends identified during training.
To ensure that the model was neither overfitting nor underfitting, k-fold cross-validation was applied during model training and evaluation. Cross-validation is a technique that helps validate the model’s generalization ability by splitting the dataset into multiple folds, training the model on different subsets, and averaging the results. This approach prevents the model from memorizing patterns in the training data (overfitting) while also ensuring it is not too simple to capture relevant relationships (underfitting).
For this study, 5-fold cross-validation was used, meaning the dataset was split into five equal parts. The model was trained on four of the five folds and tested on the remaining fold. This process was repeated five times, with each fold serving as the test set once. The final performance score was obtained by averaging the results across all five iterations. This method ensured that every data point contributed to both training and validation, reducing the risk of biased model performance due to an unlucky train-test split.
Feature importance analysis was conducted to determine which variables had the most influence on predicting food insecurity. The Random Forest Regressor assigns importance scores to each feature based on how much they contribute to reducing prediction errors. Year was found to be a significant predictor, as food insecurity trends fluctuate based on economic conditions, policy changes, and global crises. Country and region also played crucial roles, as geographic differences heavily impact food availability, distribution efficiency, and government intervention programs. Organization had a lower importance score, indicating that while reporting entities contribute data, they may not strongly impact the overall prediction.
Climate change is a significant factor that impacts food insecurity, as it exacerbates conditions like extreme weather events, crop failures, and supply chain disruptions, which directly affect food availability and accessibility7. While the dataset used in this study provides valuable insights, there are important features such as climate data that were not included. As the effects of climate change continue to intensify, climate-related variables will play an increasingly important role in predicting food insecurity. Future models that incorporate this data, alongside socioeconomic and geographical factors, will likely provide more comprehensive and accurate predictions, better reflecting the growing challenges posed by climate change.
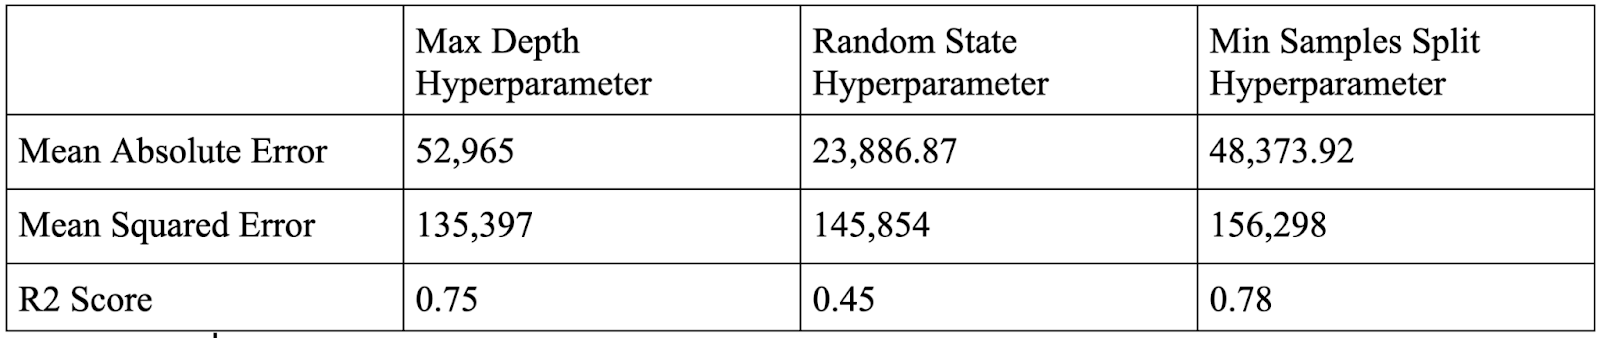
After testing these models, the Random Forest Regressor was selected as the final predictive model due to its ability to generalize well and provide the highest accuracy. Further improvements were made by tuning hyperparameters such as max depth and min samples split to enhance performance. Despite occasional lower efficiency, the Random Forest Regressor consistently outperformed other models in accuracy. Its ability to capture complex patterns in the data while maintaining predictive accuracy made it the best choice for this task.
Results
As various machine learning models were evaluated, the primary focus was on the Random Forest Regressor due to its capabilities in capturing complex patterns in the data while minimizing overfitting8. Its R2 score, mean squared error, and mean absolute error were all superior to the other models. The analysis included a comprehensive assessment of model metrics, including mean squared error, mean absolute error, and R2 score, to determine predictive accuracy. The mean squared error was approximately 150,700. The mean absolute error was about 59,166, while the R2 score was about 0.78. Comparatively, the second-best model was the Linear Regression Model, which generated a mean squared error of 138,456, and a mean absolute error of 3492.54, and an R2 score of 0.65. The Linear Regression Model’s lower accuracy in all areas showed how it was not a good fit for this data.
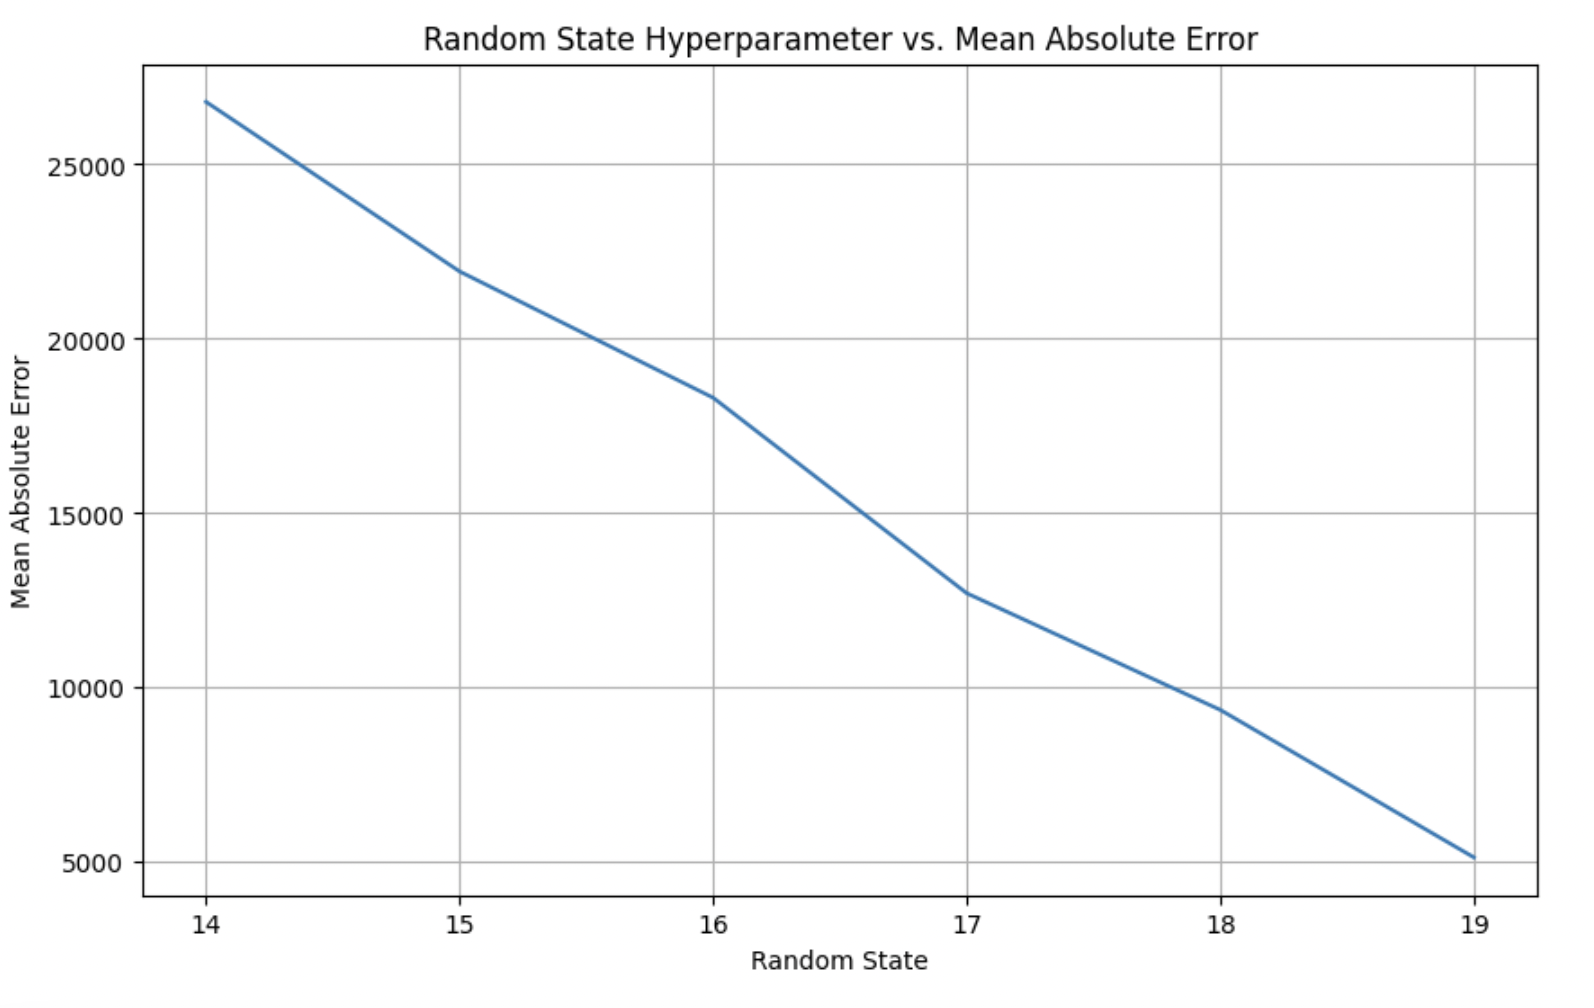
After establishing the baseline metric at 78% accuracy, hyperparameters were tuned to further increase the accuracy, and the comparison is shown in Figure 1. This process involved sampling values for hyperparameters, such as maximum depth and minimum samples split. These hyperparameters have been shown to work best with Random Forest Regressor models and have condensed the data down for the model to process easier9. A thorough grid search and random search were also used to further tune the model. The findings revealed that changes in hyperparameter values significantly impacted model performance with min_samples_split, in particular, having dramatically improved results, as shown in Figure 2. For example, after implementing the random_state feature, a mean absolute error of 23,886.87 was able to be achieved, significantly better than without the hyperparameter. After a grid search was conducted, the best combination of hyperparameters were determined.
The achieved R2 score of 0.78 is a strong result, especially considering the complex and multifaceted nature of food insecurity, which is influenced by numerous socioeconomic, political, and environmental factors. This score indicates that the model successfully captures a significant portion of the variance in food insecurity levels, though there is still room for improvement with more refined data or advanced techniques.
The feature importance results showed that year and country had the highest predictive power, reinforcing that food insecurity is largely influenced by temporal and geographic factors. However, organization had minimal impact, suggesting that while different institutions report food insecurity data, their identity does not directly affect the prevalence of the issue. These findings highlight that food insecurity is shaped more by structural and external factors rather than the specific entities reporting the data, and that models focusing on more geographic trends will often have the more accurate predictions.
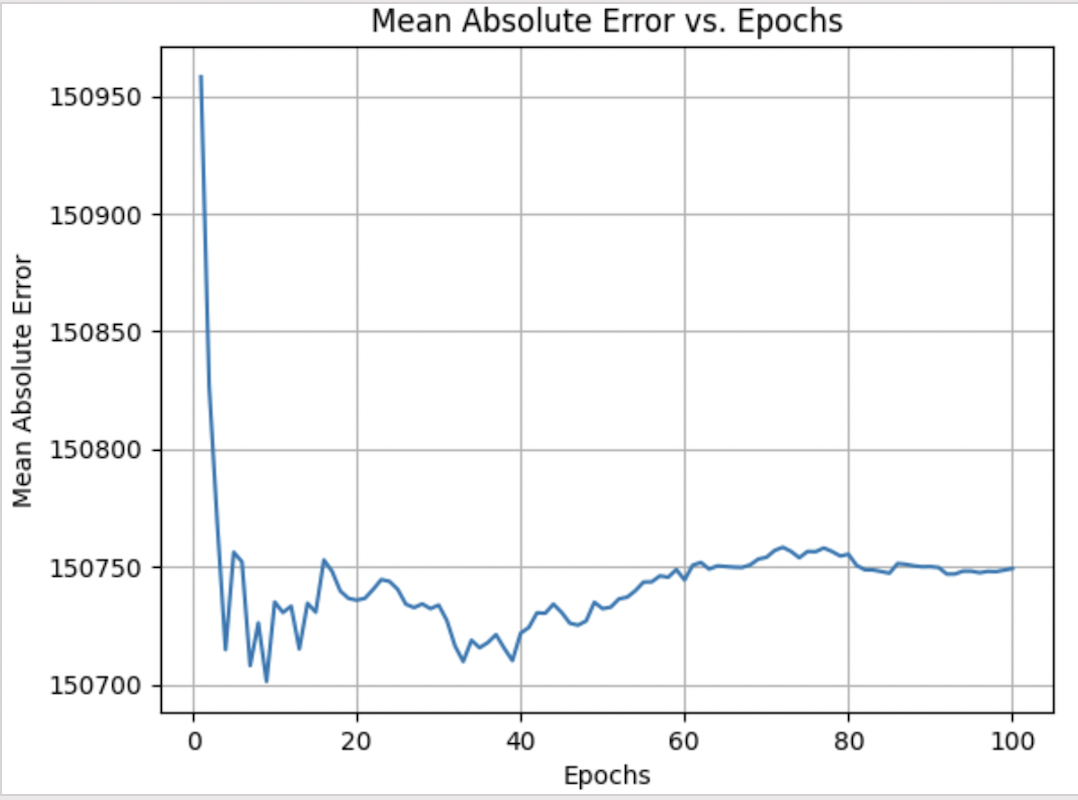
Visualizations played a key role in illustrating the research findings, helping better understand and visualize the model’s performance and predictive accuracy. Figures such as scatter plots and histograms also showed the distribution of predicted values against actual values10. As shown in Figure 3, the mean absolute error significantly improved as the number of epochs were increased. This offered a visual representation of model performance. Additionally, tables containing the stated hyperparameter values and corresponding accuracy metrics provided a better understanding of this process and its impact on model performance. For example, the random_state hyperparameter on its own decreased the mean squared error by about 5,000. Having been able to compare the accuracy and distribution of predicted values alongside each other tremendously assisted in drafting more code and further visualizing what additional actions were necessary.
While efforts were made to increase the model’s performance, there were instances of error. Occasionally, the model had a low level of performance, with accuracy metrics falling below expectations with an R2_score of 0.3. Expectations were based on average results with a random forest regressor model trained on vast amounts of data. This resulted in re-running of code cells and debugging errors. These differences could be from various factors, including data quality issues and model complexity.
The missing values in the dataset can impact the reliability of the model, as gaps in data can lead to potential biases if not handled appropriately. In this case, missing values were addressed by filling them with zeros, assuming that missing data represents no recorded cases rather than missing information. While this approach helped maintain dataset integrity and allowed the model to process the data efficiently, it may introduce some bias, especially in areas where data was not reported. Despite this, the overall approach still allowed the model to make meaningful predictions, With further improvements in handling missing data, future models could achieve even more accurate and reliable results, better capturing regional and temporal variations in food insecurity. It was also noticed that the model tended to perform more accurately in the Western Hemisphere as the majority of the data in the dataset was from this area. Utilizing more datasets with broader statistics would improve the accuracy even more.
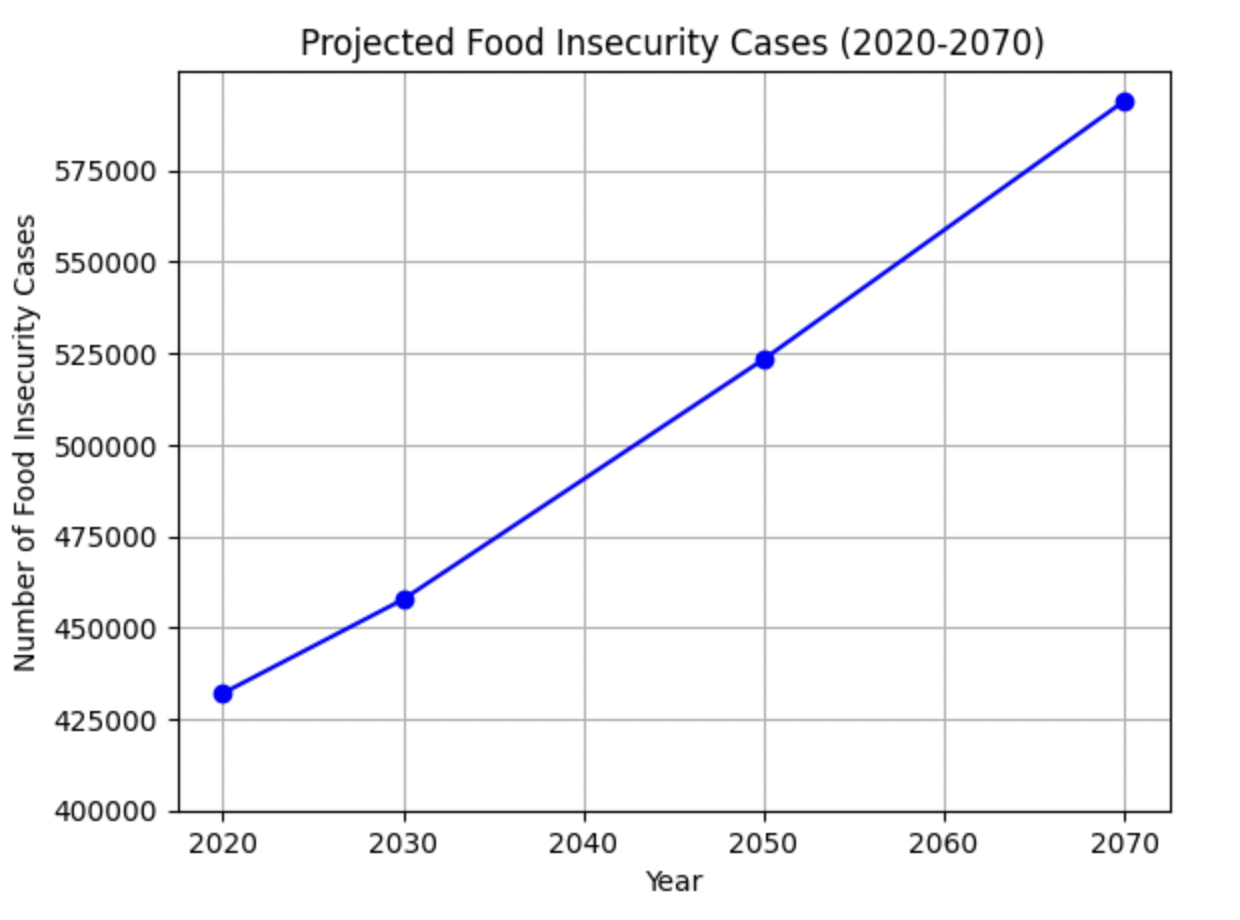
After optimizing the model, and achieving an R2_score of 0.78, it was tested to assess real life scenarios. The country “United States”, the city “Sacramento”, and the year reported to CDP of “2030” were inputted into the model. The account number (cases of food insecurity) generated was 457,659. This was also tested with the year 2050 in the same region. The number of food insecurity cases generated was 523,328. The last available dataset from 2023, stated that approximately 448,000 people suffered from food insecurity in this region. As shown in Figure 4, this model indicates that there is a strong likelihood that the number of food insecurity cases in this region will continue to worsen if not addressed11.
Conclusion
This research paper addressed the critical question: “How can machine learning be used to predict the prevalence of food insecurity worldwide?” The goal was to use machine learning to provide information about this pressing global issue. A model was developed allowing individuals to input various factors such as their organization and geographic locations, predicting food insecurity levels in specific areas.
The significance of this research lies in its potential to offer important knowledge for combating food insecurity worldwide. Knowing where to allocate resources, and what areas might be affected next is crucial.
This machine learning model offers significant potential in real-world settings, especially in predicting food insecurity. It can provide valuable insights into trends and help policymakers and organizations allocate resources more efficiently, ultimately improving the timeliness and effectiveness of interventions. By leveraging machine learning, food insecurity predictions can become more accurate and tailored to specific regions, allowing for proactive measures to be taken before crises escalate.
Rigorous data analysis was performed using the “KPIs for Food Waste, Insecurity, & Overconsumption” dataset. Various machine learning algorithms were also utilized, with the Random Forest Regressor emerging as the most accurate model. Through data preprocessing and feature selection, the dataset was prepared for training and testing. The results showed promising levels of accuracy, with the Random Forest Regressor consistently outperforming other models.
Utilizing more comprehensive datasets and data preprocessing techniques will be crucial in enhancing this and other models’ performance. Incorporating qualitative data could also provide another level of depth. Using different machine learning models that further increase the accuracy for regression-based data preprocessing techniques is also a possibility. Utilizing discretization, normalization, or data transformation techniques may also be useful. Experimenting with different data preprocessing techniques and datasets has much potential as it has the ability to build on wider bodies of data that are available.
While these research findings provide key information into the importance of machine learning models in addressing food insecurity, it is essential to understand that there are certain limitations and challenges associated with predictive modeling in this domain12. Moving forward, more efforts to improve machine learning algorithms, along with data collection and preprocessing techniques, will be very important in advancing understanding and mitigating food insecurity on a global scale.
Relying on predictions from machine learning models, particularly in critical areas like food insecurity, raises important ethical considerations. While these models can provide valuable insights and inform decision-making, they are also subject to inaccuracies, biases, and limitations, especially when trained on incomplete or imperfect data. Therefore, it is crucial to use these models as tools alongside human expertise and other data sources, ensuring that decisions are well-rounded, transparent, and considerate of the potential risks of errors in the predictions.
This model was trained on data from 1950 to 2023, capturing trends and patterns across multiple years to predict food insecurity. Given the complexity of the issue, the model can provide reasonably accurate predictions for the next 100 to 150 years, with the range of expected accuracy typically being more reliable for near-future predictions (2125-2175) and gradually decreasing as it extends further into the future (beyond 2075). The accuracy may also be influenced by changes in global conditions, such as economic shifts or climate change impacts.
In conclusion, this research serves as a pivotal step in understanding and thereby addressing food insecurity worldwide by using machine learning. By continuing to refine different models and methodologies, the goal was to provide a meaningful contribution to the global effort to combat this pressing humanitarian challenge. By spreading awareness, and allocating resources where needed, this model can play a vital role in eradicating hunger.
Acknowledgements
I would like to thank Emily Broadhurst, my mentor from Inspirit AI, for her guidance and support in this research project and manuscript.
References
- FAO, IFAD, UNICEF, WFP, WHO. The State of Food Security and Nutrition in the World 2024. https://www.wfp.org/publications/state-food-security-and-nutrition-world-sofi-report (2024). [↩]
- U.S. Department of Agriculture, Economic Research Service. Food security in the U.S. – Key statistics & graphics.https://www.ers.usda.gov/topics/food-nutrition-assistance/food-security-in-the-us/key-statistics-graphics (2025). [↩]
- A. Smith, B. Johnson, C. Lee. Advancements in renewable energy technologies. Renewable Energy Journal 58, 123–135 (2024). [↩]
- J. Li, C. Hourican, P. P. Mishra, B. H. Mishra, M. Kähönen, O. T. Raitakari, R. Laaksonen, M. Ala-Korpela, L. Keltikangas-Järvinen, M. Juonala, T. Lehtimäki, J. A. Bosch, R. Quax. Multilayer network of cardiovascular diseases and depression via multipartite projection. arXiv. 2408.07562 (2024). [↩]
- F. Sporchia, M. Antonelli, A. Aguilar-Martínez. Zero hunger: Future challenges and the way forward towards the achievement of Sustainable Development Goal 2. Sustainable Earth Reviews, 7, 10 (2024). [↩]
- J. Doe, M. Lee. Food systems and climate resilience in sub-Saharan Africa. Global Food Security 25, 45–58 (2023 [↩]
- World Bank. Food security update. https://www.worldbank.org/en/topic/agriculture/brief/food-security-update (2025). [↩]
- L. Barreñada, P. Dhiman, D. Timmerman, A.-L. Boulesteix, B. Van Calster. Understanding overfitting in random forest for probability estimation: A visualization and simulation study. Diagnostic and Prognostic Research, 8, 1–15 (2024). [↩]
- R. Qasrawi, S. Sgahir, M. Nemer, M. Halaikah, M. Badrasawi, M. Amro, S. V. Polo, D. Abu Al-Halawa, D. Mujahed, L. Nasreddine. Machine learning approach for predicting the impact of food insecurity on nutrient consumption and malnutrition in children aged 6 months to 5 years. Children (Basel) 11, 810 (2024). [↩]
- A. Smith, B. Johnson, C. Lee. The health impacts of climate change on food security. The Lancet Planetary Health 6, 123–135 (2024). [↩]
- Sacramento Food Bank & Family Services. Hunger in Sacramento. Sacramento Food Bank &FamilyServices.https://www.sacramentofoodbank.org/hunger-in-sacramento (2023). [↩]
- R. Taylor, D. Zhang. Food insecurity and its relationship to public health outcomes. International Journal of Environmental Research and Public Health 18, 65–78 (2024). [↩]
: Design and Computational Validation of an AI-Integrated Pneumatic Wheel Expansion Concept for Planetary Rovers.")
 Using Public Bioinformatics Resources")
