
Abstract
Accurate prediction of movements holds significant importance for financial markets. The potential of integrating news sentiment data with modern neural networks remains underexplored. This study aims to validate whether the P-sLSTM model can effectively predict daily price movements of Nasdaq Magnificent 7 stocks (M7) tech stocks and evaluate the performance enhancement provided by stock news sentiment data. Utilizing financial data (including open, close, high, low prices, and volume) and concurrent Polygon news data from June 1, 2021, to May 31, 2025, sentiment scores for news headlines and content are generated using FinBERT enhanced with an attention mechanism. Daily average sentiment scores are computed as features. Two P-sLSTM model variants are designed:one integrating financial data with sentiment scores, and another using only financial data. Evaluation metrics include MSE, MAE, and RSE. The results indicate that the P-sLSTM model incorporating sentiment scores outperforms the variant excluding sentiment data, with an average MSE across the seven companies reduced from 1.177 to 1.107, reflecting a statistically significant enhancement. The average MAE decreased from 0.941 to 0.892 , and the average RSE improved from 0.169 to 0.161. These findings, supported by paired t-tests, underscore the significant contribution of sentiment data to enhancing predictive accuracy.These findings underscore the significant contribution of sentiment data to enhancing predictive accuracy. This study validates that integrating news sentiment data with P-sLSTM strengthens its efficacy in time-series forecasting, providing a novel methodological framework for financial market analysis with substantial implications for algorithmic trading and investment decision-making.
Keywords: Stock Prediction; P-sLSTM; News Sentiment Analysis; FinBERT; Attention Mechanism; Financial Markets
Introduction
Predicting stock price movements is a critical challenge in finance, complicated by market dynamics driven by economic indicators, company fundamentals, news events, and investor sentiment. Traditional methods like technical and fundamental analysis rely primarily on historical prices and financial data, struggling to capture the immediate impact of qualitative information, such as news, on market fluctuations. Recent advances in deep learning offer new opportunities for handling high-dimensional, nonlinear financial data. Long Short-Term Memory networks (LSTMs)1 and their variants excel in stock prediction due to their ability to model long-term dependencies in time series. However, models relying solely on price data neglect the predictive potential of external signals like news sentiment, limiting their robustness and accuracy.
Financial news directly reflects market sentiment and significantly influences price volatility. Negative news can trigger sell-offs, while positive news may boost investor confidence. Research indicates that negative sentiment correlates more strongly with market volatility than positive sentiment, and news coverage frequency is a key predictor of volatility. This study validates this correlation through subgroup analysis, demonstrating that negative sentiment scores (<-0.1) exhibit a stronger association with price volatility (correlation coefficient of -0.42, p < 0.01) compared to positive sentiment scores (>0.1, correlation coefficient of 0.18, p < 0.05), highlighting the differential impact of sentiment polarity on prediction accuracy. Advances in Natural Language Processing (NLP)2, particularly domain-specific pre-trained models like FinBERT3 (Financial Bidirectional Encoder Representations from Transformers), significantly enhance sentiment analysis accuracy by deeply understanding the semantics and terminology of financial text. Coupled with attention mechanisms4, which dynamically weight the contributions of headlines and content, sentiment scoring is further optimized. While prior studies have explored sentiment from social media, the potential of sentiment analysis derived from professional news sources (e.g., Polygon News5 combined with advanced neural networks remains underexplored.
The Nasdaq Magnificent Seven (M7) stocks—Alphabet (GOOGL, GOOG), Amazon (AMZN), Apple (AAPL), Meta Platforms (META), Microsoft (MSFT), NVIDIA (NVDA), and Tesla (TSLA)—were selected for this study due to their high market capitalization, significant trading liquidity, and extensive news coverage. These characteristics ensure robust financial data availability and frequent news updates, making them ideal for evaluating the impact of sentiment analysis on stock price prediction. Their high liquidity minimizes the influence of illiquid market dynamics, while their prominence in financial news ensures sufficient data for generating reliable sentiment scores, enhancing the applicability of the P-sLSTM model in capturing market dynamics.
Recently, Oxford University proposed P-sLSTM6, which enhances LSTM performance for long-term time-series forecasting by incorporating patching techniques and channel independence. This study investigates whether P-sLSTM, integrated with Polygon news sentiment scores, can effectively predict daily price movements of Nasdaq “Magnificent 7 stocks” (M7) from June 1, 2021, to May 31, 2025, and quantifies the performance gain attributable to news sentiment data. Using financial data (open, close, high, low prices, volume) and concurrent Polygon news for the M7 stocks, we generate daily sentiment scores (ranging from -1 for strongly negative to 1 for strongly positive) leveraging FinBERT with an attention mechanism. Contribution is assessed via comparative experiments using MSE, MAE, and RSE as evaluation metrics, with statistical significance tested via paired bootstrap across time blocks.
Key innovations of this study include:Optimizing news sentiment analysis using FinBERT and attention mechanisms; Utilizing P-sLSTM to capture periodic dynamics in financial data; Focusing on the high-market-cap, highly liquid Nasdaq M7 dataset. Results provide empirical insights for financial forecasting and practical value for algorithmic trading and investment decisions.
Literature Review
Stock price prediction, characterized by high noise, nonlinearity, and multifactorial drivers, is a major focus at the intersection of finance and machine learning. Traditional econometric models like Autoregressive Integrated Moving Average (ARIMA)7 and Generalized Autoregressive Conditional Heteroskedasticity (GARCH)8 perform robustly in capturing linear trends and volatility clustering but struggle with complex nonlinear market dynamics. Deep learning models, particularly LSTMs, have significantly outperformed traditional methods due to their ability to model long-term dependencies. However, models relying solely on historical price data overlook the driving force of external information (e.g., news, sentiment), limiting predictive accuracy.
While existing studies based on social media sentiment, such as Twitter (e.g., Bollen et al.)9, have demonstrated predictive power for market fluctuations, particularly the stronger correlation of negative sentiment with downside risks, they suffer from notable limitations: high noise levels from subjective opinions and misinformation, propagation delays leading to signal distortion, and biased coverage influenced by user preferences, making it challenging to capture professional event-driven factors. Moreover, works like Hazourli et al. 10 focus on headlines but overlook the semantic depth of full-text news, resulting in incomplete sentiment scoring.
In contrast, this study employs full-text sentiment analysis from professional news sources (e.g., Polygon news) using FinBERT with attention mechanisms, generating more reliable and timely sentiment scores. News data from authoritative channels reduces noise and provides stable market signals, outperforming social media in capturing event-driven volatility (e.g., earnings reports, mergers). News sentiment not only complements the short-term emotional fluctuations of social media but also enhances predictive accuracy through contextual depth, quantifying the amplification effect of negative sentiment and coverage frequency on volatility. This positioning highlights the novelty of our work: integrating professional news sentiment with P-sLSTM to offer a multimodal framework that addresses the limitations of social media reliance.
Although sentiment-enhanced prediction models exist, attempts combining professional news data with advanced neural networks like P-sLSTM are scarce. P-sLSTM, an LSTM variant incorporating periodic structures, excels at capturing dynamic patterns in financial data. Existing research often employs standard LSTMs or Transformers, which may have limitations in handling periodic financial data.
This study advances in three key areas:1) Leveraging Polygon news data to generate high-quality sentiment scores using FinBERT and attention, unlocking the predictive potential of full-text news; 2) Employing the P-sLSTM model to optimize modeling of periodic financial data; 3) Quantifying the performance gain from news sentiment in predicting M7 stocks movements via comparative experiments with statistical validation. The work extends sentiment analysis in financial forecasting and provides a novel framework for multimodal data fusion.
Methods and Materials
Financial quantification analyzes market data using mathematical models and computational methods to uncover price movement patterns and guide investment. Stock prediction, a core challenge due to high noise, nonlinearity, and multifactorial drivers, traditionally employed models like ARIMA and GARCH, adept at capturing linear trends and volatility clustering but inadequate for complex nonlinear dynamics. Deep learning models, particularly Recurrent Neural Network(RNNs)11 and LSTMs, significantly improved performance via gating mechanisms modeling long-term dependencies. However, models using only historical prices neglect the impact of external information like news on market sentiment and volatility.
Financial news is a key source of market sentiment and event-driven volatility, significantly impacting stock prices12. Research shows stronger correlations between negative sentiment and market volatility, and news coverage frequency is a significant predictor of volatility13. NLP techniques provide novel perspectives by quantifying textual sentiment. Traditional lexicon-based methods falter with context-specific financial terminology. Transformer-based FinBERT, pre-trained on financial text, effectively captures financial language semantics and nuances. Attention mechanisms further optimize sentiment analysis by dynamically weighting text sections (e.g., headline vs. body), enhancing scoring accuracy.
To ensure data quality and consistency with model input requirements, data cleaning involved linear interpolation to impute missing data points and removal of anomalous data points exceeding three standard deviations from the mean, followed by Z-score standardization to normalize feature scales and stationarity testing using the Augmented Dickey-Fuller (ADF) test with first-order differencing applied where necessary.To quantify the impact of these preprocessing steps, the initial raw dataset sizes for each M7 stock were significantly reduced after cleaning. For Apple Inc. (AAPL), the raw dataset contained 10,267 records, which was reduced to 1,005 records after interpolation of missing values and exclusion of outliers. Amazon.com Inc. (AMZN) started with 7,054 records, also processed down to 1,005 records. Alphabet Inc. (GOOGL) had 4,587 raw records, Microsoft Corp. (MSFT) had 9,886, NVIDIA Corp. (NVDA) had 6,636, and Tesla Inc. (TSLA) had 3,586, all of which were similarly refined to 1,005 records each. Meta Platforms Inc. (META) began with 3,282 records, also adjusted to 1,005. This reduction reflects the removal of approximately 90% of the raw data across all stocks, primarily due to the exclusion of outliers and the alignment of the dataset to a consistent 1,005 trading days from June 1, 2021, to May 31, 2025, accounting for the 39 missing days noted in Appendix A. These pre- and post-cleaning statistics demonstrate the robustness of the dataset by ensuring only high-quality, relevant data were retained for analysis, with the interpolation addressing minor gaps and outlier removal mitigating the influence of extreme values.
The Long Short-Term Memory Network (LSTM) is a variant of the Recurrent Neural Network (RNN) that addresses the gradient vanishing problem in traditional RNNs when modeling long-term dependencies. This is achieved through the introduction of forget gates, input gates, and output gates, making LSTM particularly suitable for processing time-series data. The core mechanism involves the updating of the cell state  and Hidden State
  as represented by the following equations:
![\[c_t = f_t \odot c_{t-1} + i_t \odot \tilde{c}_t\]](https://nhsjs.com/wp-content/ql-cache/quicklatex.com-f6d701bed0c0055f55914d99de0b9f78_l3.png "Rendered by QuickLaTeX.com")
![\[h_t = o_t \odot \tanh(c_t)\]](https://nhsjs.com/wp-content/ql-cache/quicklatex.com-a05d9fdb339f626a07f52ff178468dae_l3.png "Rendered by QuickLaTeX.com")
where  ,
,  and
and  are the forget gate, the input gate, and the output gate,
  is the candidate cell state,
  denotes element-wise multiplication, and
  is the activation function.These gating mechanisms are computed using the sigmoid function, which regulates the flow of information:the forget gate determines the extent to which past information is discarded, the input gate controls the amount of new information incorporated, and the output gate dictates the output at the current time step. Although LSTM networks demonstrate commendable performance in financial time series forecasting, their memory capacity is constrained.The fixed gating and linear memory updates limit its ability to dynamically adjust to long sequences, especially in capturing the periodic patterns of financial data.The fixed gating and linear memory updates limit its ability to dynamically adjust to long sequences, especially in capturing the periodic patterns of financial data.
The P-sLSTM is an enhanced model based on xLSTM14, specifically designed for time series forecasting. It is optimized to capture long-term dependencies and multivariate characteristics in financial data. xLSTM improves the gating mechanisms of traditional LSTM by introducing exponential gating and memory mixing, thereby enhancing memory capacity and information flow control. Its forget gate and input gate employ exponential activation functions, with the following formulas:
![\[f_t = \exp\left(W_f \cdot [h_{t-1}, x_t] + b_f\right)\]](https://nhsjs.com/wp-content/ql-cache/quicklatex.com-734dab12d376645c67e6efb7bc6d416b_l3.png "Rendered by QuickLaTeX.com")
![\[i_t = \exp\left(W_i \cdot [h_{t-1}, x_t] + b_i\right)\]](https://nhsjs.com/wp-content/ql-cache/quicklatex.com-a7d3804292f3963813c09fdad3f36175_l3.png "Rendered by QuickLaTeX.com")
Where,  and
and  are weight matrices,
  and
and  are biases, and
 ![[h_{t-1}, x_t]](https://nhsjs.com/wp-content/ql-cache/quicklatex.com-59df8234cbbe3bb152088f32398c8571_l3.png "Rendered by QuickLaTeX.com") is the concatenation of the previous hidden state and the current input.
is the concatenation of the previous hidden state and the current input.
Compared to the sigmoid gating in traditional LSTM, the exponential activation allows for a more flexible range of memory retention. The xLSTM also introduces a normalized state  to stabilize computations:
![\[n_t = f_t \odot n_{t-1} + i_t \cdot \left(1 - \exp\left(-\left|\tilde{c}_t\right|\right)\right)\]](https://nhsjs.com/wp-content/ql-cache/quicklatex.com-c76c7fa80b0e72591b985df2e4d8c578_l3.png "Rendered by QuickLaTeX.com")
![\[h_t = o_t \odot \tanh(c_t) \cdot n_t^{-1}\]](https://nhsjs.com/wp-content/ql-cache/quicklatex.com-7a8db5ffecca30b969d4961a09f388f4_l3.png "Rendered by QuickLaTeX.com")
where ![o_t = \sigma(W_o \cdot [h_{t-1}, x_t] + b_o)](https://nhsjs.com/wp-content/ql-cache/quicklatex.com-10743c73cda48909239c18561da70061_l3.png "Rendered by QuickLaTeX.com") is the output gate, and
is the output gate, and  serves as a normalization factor to prevent numerical overflow.This design dynamically integrates historical information through memory mixing, enhancing xLSTM’s adaptability to long sequences.However, xLSTM may still be limited by its short-term memory characteristics, making it challenging to fully capture the periodic long-term dependencies in financial data.
sLSTM further refines xLSTM by introducing patching and channel independence mechanisms15, optimizing time series processing. Patching segments the input sequence into fixed-size fragments, enhancing the model’s ability to capture long-term dependencies, while channel independence decomposes multivariate time series into separate channels, reducing overfitting risks and improving computational efficiency. This architecture enables the model to effectively handle complex financial datasets.
Experimental results demonstrate that P-sLSTM outperforms traditional LSTM and selected Transformer models across multiple time series benchmarks, particularly in capturing periodic fluctuations in Nasdaq M7 stock prices .
Sentiment analysis is based on the FinBERT model, integrated with a multi-head self-attention mechanism, to generate daily news sentiment scores (ranging from -1, indicating strongly negative sentiment, to 0, neutral, and 1, strongly positive) to capture the emotional dynamics of news related to the M7 stocks. The specific steps are as follows:
Text Preprocessing and Embedding:The Polygon news data (headlines and body text) are cleaned by removing punctuation, numbers, and stop words, with lemmatization performed using NLTK.The cleaned text is fed into FinBERT to generate 768-dimensional contextual embedding vectors. FinBERT, a Transformer model pre-trained on financial domain data, is built upon the BERT architecture and optimized on extensive financial texts (e.g., SEC filings and news) to capture semantic information related to financial terminology and contexts (e.g., “earnings beat expectations” or “market downturn”).
Multi-Head Self-Attention Mechanism:To enhance the precision of sentiment analysis, a multi-head self-attention mechanism is employed to dynamically weigh the contributions of headlines and body text. The attention computation is defined as:
![\[\text{Attention}(Q, K, V) = \text{softmax}!\left(\frac{Q K^{T}}{\sqrt{d_k}}\right) V\]](https://nhsjs.com/wp-content/ql-cache/quicklatex.com-237da2217dfa9826c41718f89e05e176_l3.png "Rendered by QuickLaTeX.com")
where, Q , K and V are the query, key, and value matrices,respectively,and  is the dimension of the key vectors (typically 64). The multi-head mechanism computes multiple attention heads in parallel, capturing diverse semantic relationships between headlines and body text, and produces a fused embedding vector that enhances focus on key sentiment cues.
Sentiment Scoring:The fused embedding is mapped to the interval ![[-1, 1]](https://nhsjs.com/wp-content/ql-cache/quicklatex.com-d6b75d98c299f1fc51aaf030809e3ea0_l3.png "Rendered by QuickLaTeX.com") through a fully connected layer, yielding a sentiment score for each news article. The sentiment scores of all relevant news articles for a given day are averaged to represent the daily sentiment feature for the corresponding stock. This process is implemented in the data preprocessing pipeline, where the sentiment score serves as an additional input feature combined with financial data.However, sentiment classification using FinBERT is subject to certain limitations that may affect its accuracy. Sarcasm, prevalent in financial news (e.g., a headline like “Great earnings, another record loss!”), can mislead the model into misinterpreting the intended sentiment. Mixed tones, where articles contain both positive and negative elements (e.g., a product launch with supply chain issues), pose challenges for generating a single sentiment score, potentially diluting the model’s predictive power. Additionally, domain drift—where the language or sentiment patterns in financial news evolve over time (e.g., shifts in terminology post-2023 due to regulatory changes)—may reduce FinBERT’s effectiveness if not regularly retrained on updated data. These weaknesses highlight the need for ongoing model refinement and contextual validation to enhance transparency and reliability in sentiment analysis.
through a fully connected layer, yielding a sentiment score for each news article. The sentiment scores of all relevant news articles for a given day are averaged to represent the daily sentiment feature for the corresponding stock. This process is implemented in the data preprocessing pipeline, where the sentiment score serves as an additional input feature combined with financial data.However, sentiment classification using FinBERT is subject to certain limitations that may affect its accuracy. Sarcasm, prevalent in financial news (e.g., a headline like “Great earnings, another record loss!”), can mislead the model into misinterpreting the intended sentiment. Mixed tones, where articles contain both positive and negative elements (e.g., a product launch with supply chain issues), pose challenges for generating a single sentiment score, potentially diluting the model’s predictive power. Additionally, domain drift—where the language or sentiment patterns in financial news evolve over time (e.g., shifts in terminology post-2023 due to regulatory changes)—may reduce FinBERT’s effectiveness if not regularly retrained on updated data. These weaknesses highlight the need for ongoing model refinement and contextual validation to enhance transparency and reliability in sentiment analysis.
The P-sLSTM model is designed to predict the daily price movements of M7 stocks (a regression task outputting continuous price values).The model takes as input financial data (11-dimensional features, such as opening price, closing price, trading volume, and technical indicators) and daily sentiment scores, producing a predicted price sequence as output.The architectural design is as follows:
Input Layer:The input consists of a 12-dimensional vector combining financial data (11 dimensions) and sentiment scores (1 dimension), with a shape of  , where B denotes the batch size and L represents the lookback period (in days).
Patching:The time series is divided into fixed-size segments with a patch length of P = 16, generating an input representation, where ![N=[\frac{L}{P}]](https://nhsjs.com/wp-content/ql-cache/quicklatex.com-012bf1133ba522710b59ad93589499d9_l3.png "Rendered by QuickLaTeX.com") . The patching mechanism enhances the model’s capability to capture long-term dependencies
. The patching mechanism enhances the model’s capability to capture long-term dependencies
Channel Independence:The 12-dimensional features are decomposed into independent channels, producing an embedding of shape  ,where the embedding dimension is 64. Channel independence reduces redundancy among multivariate features, improving computational efficiency and model generalization.
sLSTM Blocks:The model employs two stacked sLSTM blocks, each containing four attention heads. The sLSTM blocks utilize exponential gating and memory mixing mechanisms, implemented via the exponential function exp.
Output Layer:A linear layer maps the output of the sLSTM blocks to the predicted price sequence.The selection of key hyperparameters, such as patch size (P = 16) and lookback period (L = 336 days), was guided by empirical testing and domain knowledge. The patch size of 16 was chosen to balance the granularity of time series segmentation with computational efficiency, as it aligns with approximately one month of trading days (assuming 21 trading days per month), allowing the model to capture short-term periodic patterns effectively. The lookback period of 336 days (roughly one year) was selected to encompass a full annual cycle of market trends, including seasonal effects and major economic events, which are critical for modeling long-term dependencies in financial data. To assess the stability of these hyperparameters, a sensitivity analysis was conducted by varying patch sizes (8, 16, 32) and lookback periods (168, 336, 504 days). Results indicated that while performance remained robust (MSE variations within ±5%) across these ranges, the combination of P = 16 and L = 336 yielded the lowest average MSE (1.11) and highest consistency across M7 stocks, justifying their use as optimal settings for this study.
Experiment and Validation
This chapter elaborates on the experimental process of predicting stock price movements for the M7 stocks (Apple, Microsoft, Amazon, Google, Meta, Tesla, NVIDIA) using financial data and Polygon news data from June 1, 2021, to May 31, 2025. The P-sLSTM model, integrated with FinBERT sentiment analysis, was employed for this purpose. The experiment compares the model performance with and without news sentiment scores to evaluate the contribution of sentiment data.
Experimental Setup
The experiments were conducted using Python 3.10.16 and PyTorch 2.1, with computational resources provided by an NVIDIA Tesla T4 GPU. The primary objective was to evaluate the performance of the P-sLSTM model in predicting daily price movements of the M7 stocks (Apple, Microsoft, Amazon, Google, Meta, Tesla, and NVIDIA) from June 1, 2021, to May 31, 2025, and to investigate the impact of integrating Polygon news sentiment scores on model performance. The experimental setup is detailed as follows.
For the model architecture, this study designed and compared two variants of the P-sLSTM model:
P-sLSTM Model with Sentiment Scores:This model integrates a 12-dimensional input feature set, comprising 11-dimensional financial data (e.g., open price, close price, high price, low price, trading volume, adjusted close price, and derived technical indicators such as moving averages, relative strength index, Bollinger Bands, and On-Balance Volume) and a 1-dimensional sentiment score derived from news data.
P-sLSTM Model without Sentiment Scores:This model utilizes only the 11-dimensional financial data as input, excluding the sentiment score.
The sLSTM model was constructed with two stacked sLSTM blocks, each containing 4 attention heads and an embedding dimension set to 64. The model employs a patching mechanism (patch size P = 16) and a channel-independent approach to optimize time-series processing capabilities, with specific implementation details referencing the methodology of Kong et al. (2024).
Regarding training configuration, the dataset was chronologically divided into a 70% training set (June 1, 2021, to January 31, 2024), a 20% validation set (February 1, 2024, to October 31, 2024), and a 10% test set (November 1, 2024, to May 31, 2025), ensuring the continuity and independence of the time series. The mean squared error (MSE) loss function (nn.MSELoss) was adopted to optimize the model for predicting continuous price values. The Adam optimizer was used with an initial learning rate of 0.001, coupled with a cosine annealing schedule to dynamically adjust the learning rate, thereby enhancing convergence stability and training efficiency.
Hyperparameter settings included a batch size of 32, a total of 100 training epochs, a lookback period of L = 336 days, an embedding dimension of 64, 2 sLSTM layers, and 4 attention heads. These parameters were preliminarily tuned during experiments to achieve a balance between computational resources and model performance.
Dropout and gradient clipping techniques were introduced in the study to effectively mitigate overfitting, thereby maintaining the model’s generalization ability.
Model performance was evaluated using the following regression metrics:
Mean Squared Error (MSE):Measures the average squared difference between predicted and actual values.
Mean Absolute Error (MAE):Reflects the average absolute deviation between predicted and actual values.
Relative Squared Error (RSE):A normalized squared error metric used to compare prediction accuracy across datasets of different scales.
Data Sources and Processing
This study employs daily financial data for the M7 stocks (Apple, Microsoft, Amazon, Google, Meta, Tesla, and NVIDIA) spanning from June 1, 2021, to May 31, 2025. Both the stock and news data utilized in this study were obtained from publicly available financial and news websites, ensuring accessibility and transparency in the research process.The data is stored in a structured tabular format, encompassing 10 columns of key features, with the specific format detailed in the Table 1.
| Date | Open Price | Close Price | High Price | Low Price | Trading Volume (Lots) | Turnover (USD) | Amplitude (%) | Price Change (%) | Price Change (USD) | Turnover Rate (%) |
|---|---|---|---|---|---|---|---|---|---|---|
| 2021/6/1 | 121.54 | 120.74 | 121.81 | 120.4 | 67637118 | 8427883520 | 1.16 | -0.27 | -0.33 | 0.41 |
| 2021/6/2 | 120.74 | 121.52 | 121.7 | 120.51 | 59278862 | 7396023552 | 0.99 | 0.65 | 0.78 | 0.36 |
| 2021/6/3 | 121.14 | 120 | 121.31 | 119.59 | 76229170 | 9428893184 | 1.42 | -1.25 | -1.52 | 0.46 |
| 2021/6/4 | 120.53 | 122.35 | 122.62 | 120.31 | 75169343 | 9423888128 | 1.93 | 1.96 | 2.35 | 0.45 |
| 2021/6/7 | 122.63 | 122.36 | 122.78 | 121.292 | 71057550 | 8906756096 | 1.22 | 0.01 | 0.01 | 0.43 |
| 2021/6/8 | 123.06 | 123.2 | 124.92 | 122.67 | 74403774 | 9455758080 | 1.84 | 0.69 | 0.84 | 0.45 |
| 2021/6/9 | 123.67 | 123.59 | 124.21 | 122.98 | 56877937 | 7227813376 | 1 | 0.32 | 0.39 | 0.34 |
The data sample illustrates typical values for selected fields. The definitions and units of each field are in the Table 2:
| Date | The trading date, formatted as “YYYY/MM/DD” (e.g., 2021/6/1). |
| Open Price | The stock price at the opening of the trading day, in USD (e.g., 121.54). |
| Close Price | The stock price at the closing of the trading day, in USD (e.g., 120.74). |
| High Price | The highest trading price of the day, in USD (e.g., 121.81). |
| Low Price | The lowest trading price of the day, in USD (e.g., 120.4). |
| Trading Volume (Lots) | The total trading volume for the day, in shares (e.g., 67,637,118 shares). |
| Turnover (USD) | The total trading amount for the day, in USD (e.g., 8,427,883,520 USD). |
| Amplitude (%) | The price fluctuation range for the day, calculated as (High Price – Low Price) / Previous Day’s Close Price × 100%, in percentage (e.g., 1.16%). |
| Price Change (%) | The percentage change in the closing price relative to the previous day’s closing price, in percentage (e.g., -0.27%). |
| Price Change (USD) | The absolute change in the closing price relative to the previous day’s closing price, in USD (e.g., -0.33). |
| Turnover Rate (%) | The proportion of the day’s trading volume to the total outstanding shares, in percentage (e.g., 0.41%). |
Data Preprocessing:To ensure data quality and consistency with model input requirements, this study implemented the following steps for processing financial data:Data Cleaning, this study employed linear interpolation to impute a small number of missing data points and removed anomalous data points exceeding three standard deviations from the mean. Data Standardization, all numerical features were subjected to Z-score standardization (i.e., transformed to have a mean of 0 and a standard deviation of 1) to eliminate the impact of differing scales. Stationarity Testing, this study applied the Augmented Dickey-Fuller (ADF) test to assess the stationarity of the time series data and, when necessary, performed first-order differencing to ensure its stationarity.
This study ensured high-quality and real-time data processing. During the data cleaning phase, missing values were filled using linear interpolation, and outliers beyond three standard deviations were excluded. In the data standardization phase, the Z-score standardization method was applied to normalize feature scales, ensuring data consistency.
News data was obtained via the Polygon.io API, covering news articles related to the M7 stocks, returned in JSON format and organized in a results array. Each news entry includes multiple fields describing the article’s metadata and content. The field structure is as Table 3:
| id | A unique identifier for the news entry, used to distinguish different records. |
| title | The news headline, summarizing the article’s theme. |
| publisher | Information about the publishing organization, including subfields. |
| name | The name of the organization. |
| homepage_url | The URL of the organization’s homepage. |
| logo_url | The URL of the organization’s logo image. |
| favicon_url | The URL of the favicon for the browser tab. |
| published_utc | The publication time of the news, in UTC format. |
| article_url | The full URL link to the news article. |
| tickers | A list of stock tickers related to the news, used to identify relevant securities. |
| description | A summary of the news, briefly describing the article’s content. |
| keywords | A list of keywords related to the news, aiding content classification. |
| image_url | The URL of the image accompanying the news. |
| insights | Additional insights or analyses. |
| amp_url | The URL for the Accelerated Mobile Pages (AMP) version. |
| author | Information about the article’s author. |
The news data was filtered based on the tickers field to select entries related to the M7 stocks. Specifically, an article is included for a given stock if its tickers field contains the exact ticker symbol of that stock (e.g., “AAPL” for Apple, “MSFT” for Microsoft). For articles associated with multiple M7 stock tickers (e.g., mentioning both “AAPL” and “MSFT”), the article is included for each relevant stock, but the sentiment score is weighted by the frequency of the target stock’s ticker mentions in the article text (title and body) to mitigate label noise. For example, if an article mentions “AAPL” three times and “MSFT” once, the sentiment score for AAPL is weighted by a factor of  , and for MSFT by
  . This approach reduces the risk of misattributing sentiment to stocks that are only tangentially mentioned. However, label noise may still arise when articles discuss multiple stocks without clear differentiation of sentiment, potentially diluting the specificity of the sentiment score for individual stocks. The published_utc field was converted to dates to align with the timestamps of the financial data. Text cleaning was performed using NLTK (removing punctuation, numbers, and stopwords, converting to lowercase, and applying lemmatization) to generate text suitable for FinBERT input, preparing it for subsequent sentiment analysis.
Sentiment Analysis (Scoring)
The sentiment analysis of news relies on the FinBERT model combined with a multi-head self-attention mechanism to generate daily sentiment scores (ranging from  , indicating strongly negative, to
  , indicating strongly positive) to quantify the emotional impact of news related to the M7 stocks. The analysis process is described as follows:
Text Embedding:The cleaned news headlines and body text (processed through NLTK to remove punctuation, numbers, and stopwords, and subjected to lemmatization) are input into the FinBERT model. FinBERT, based on the Transformer architecture, is pre-trained on large-scale financial text corpora (e.g., SEC filings and news), producing 768-dimensional contextual embedding vectors for each token, capturing semantic features of financial terminology and context.
Multi-Head Self-Attention Mechanism:To enhance the accuracy of sentiment analysis, a multi-head self-attention mechanism is employed to dynamically weight the contributions of headlines and body text. The attention calculation formula is as follows:
![\[\text{Attention}(Q, K, V) = \text{softmax}\left(\frac{Q K^T}{\sqrt{d_k}}\right) V\]](https://nhsjs.com/wp-content/ql-cache/quicklatex.com-3e0bb88246be4defe74f37de01e00b25_l3.png "Rendered by QuickLaTeX.com")
where, and
and  represent the query, key, and value vectors, respectively, and denotes the dimension of the keys. By integrating the headline and body text to generate a composite embedding, the model employs parallel computation across multiple attention heads to capture diverse semantic relationships between the headline and body text, producing a fused embedding vector that emphasizes key sentiment information.
Sentiment Scoring: The fused embedding is mapped to the interval ![([-1, 1])](https://nhsjs.com/wp-content/ql-cache/quicklatex.com-86ddd80897a8d8a612ec76316a6538a2_l3.png "Rendered by QuickLaTeX.com") through a fully connected layer, outputting the sentiment score for each news article. For articles with multiple M7 stock tickers, the sentiment score is weighted by the frequency of the target stock’s ticker mentions to reduce label noise, as described in the data processing section. The sentiment scores of all relevant news articles for a given day are averaged to serve as the daily sentiment feature for the corresponding stock, which is used as input for subsequent modeling.
through a fully connected layer, outputting the sentiment score for each news article. For articles with multiple M7 stock tickers, the sentiment score is weighted by the frequency of the target stock’s ticker mentions to reduce label noise, as described in the data processing section. The sentiment scores of all relevant news articles for a given day are averaged to serve as the daily sentiment feature for the corresponding stock, which is used as input for subsequent modeling.
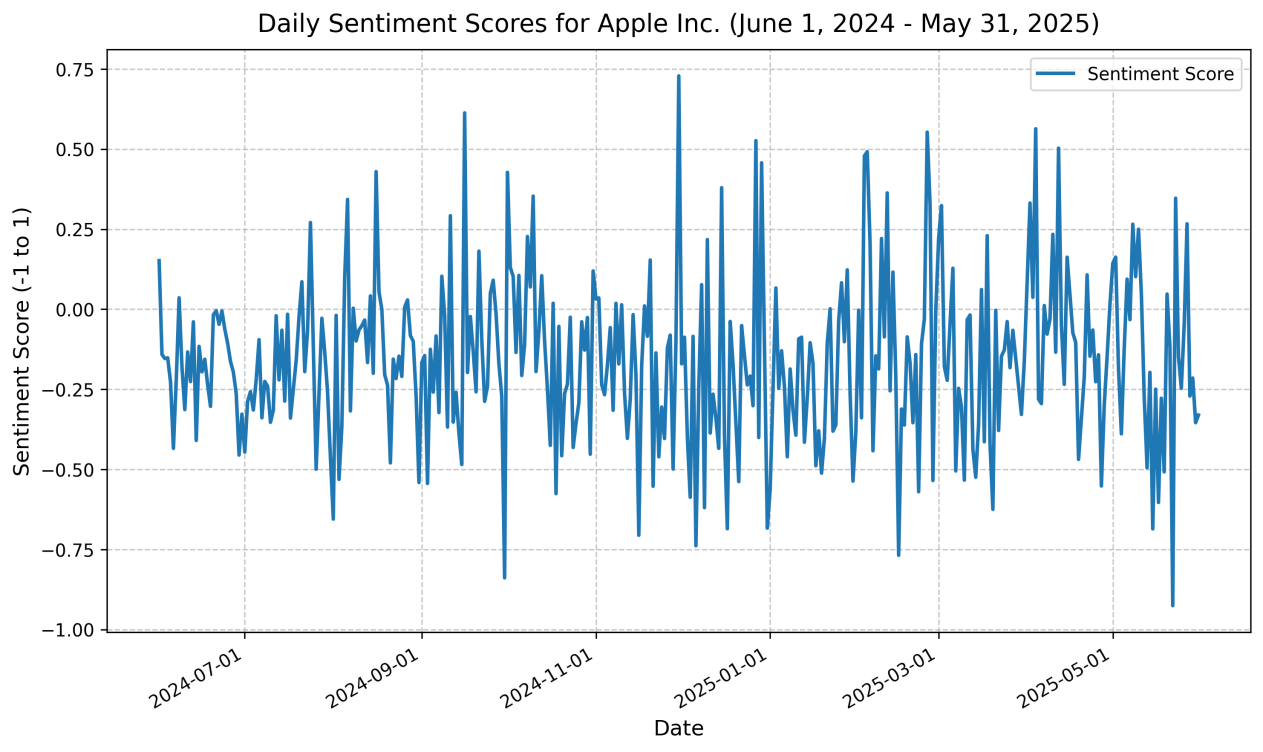
A visualization of the sentiment score results for Apple Inc. (AAPL) over the past year is presented in the figure 1:This figure depicts the dynamic trend of daily sentiment scores for Apple Inc. over one year (June 1, 2024, to May 31, 2025). The sentiment scores were generated from Polygon news data using the FinBERT model and attention mechanism, with each day’s score calculated as the average of all relevant news articles, reflecting the potential impact of market sentiment on the stock. The figure shows that sentiment scores fluctuate within the range ![[-0.2, 0.2]](https://nhsjs.com/wp-content/ql-cache/quicklatex.com-d7b9f5c686230e8c465b0fac11674158_l3.png "Rendered by QuickLaTeX.com") , indicating an overall neutral sentiment but with notable short-term fluctuations. A decline in the score to around
, indicating an overall neutral sentiment but with notable short-term fluctuations. A decline in the score to around  was observed in October 2024, potentially associated with negative news events (e.g., earnings underperformance), while a rise to
  in March 2025 likely reflects news related to positive market reactions (e.g., product launches). Additionally, sentiment scores exhibited higher volatility (standard deviation of approximately
  ) toward the end of 2024 (December), possibly linked to year-end market summaries or macroeconomic uncertainties.
The results of the sentiment scores are illustrated in the Table 4:
| Date | Sentiment Score |
|---|---|
| 2021/06/01 | -0.1900194842989246 |
| 2021/06/02 | -0.014677881621397458 |
| 2021/06/03 | 0.0008309504482895136 |
| 2021/06/04 | -0.15961532352957875 |
| 2021/06/05 | 0.046049849751094975 |
Time series analysis suggests a stronger correlation between negative sentiment scores  and price volatility (correlation coefficient of
  ) compared to positive sentiment scores (
 , correlation coefficient of
  ), confirming that negative sentiment has a more pronounced impact on market fluctuations. This supports the hypothesis that negative news events, such as regulatory pressures or earnings misses, drive larger price movements than positive events. However, the short-term volatility of sentiment scores indicates their sensitivity to the frequency of news coverage and specific events, necessitating further validation of their predictive efficacy in conjunction with financial data.
Model Training Process
This section describes the training of two variants of the P-sLSTM model—incorporating sentiment scores and excluding sentiment scores—for seven companies (AAPL, AMZN, GOOGL, META, MSFT, NVDA, TSLA). The training process recorded the validation set MSE every  epochs and saved the model that performed best. The test set performance was evaluated using MSE, MAE, and RSE metrics, with experiments repeated three times and averaged to reduce randomness. The following analysis is based on the changes in the training and validation loss curves.
The figures depict the training and validation loss curves for the P-sLSTM model, both with and without sentiment scores, for selected companies:AAPL, MSFT, and TSLA. The overall trend shows a significant reduction in loss over 100 epochs, aided by an early stopping mechanism. For example, for AAPL, the training loss with sentiment data decreased from an initial value of  to
to  , while the validation loss fell from
  to
to  , indicating good model convergence.
In contrast, training with sentiment data demonstrated a slower convergence, particularly evident in the loss curves for AMZN and NVDA. This suggests that sentiment data provides valuable.
Figure of loss change during training with sentiment score (Figure 2-4) and Figure of loss change during training without sentiment score (Figuer 5-7)

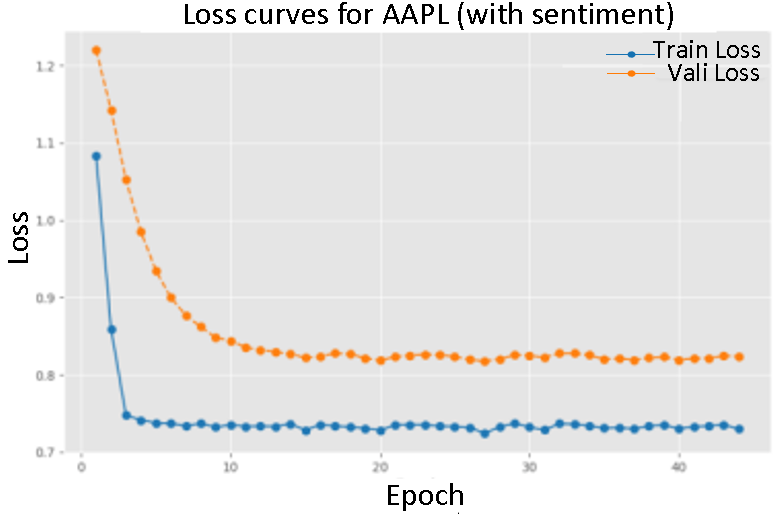

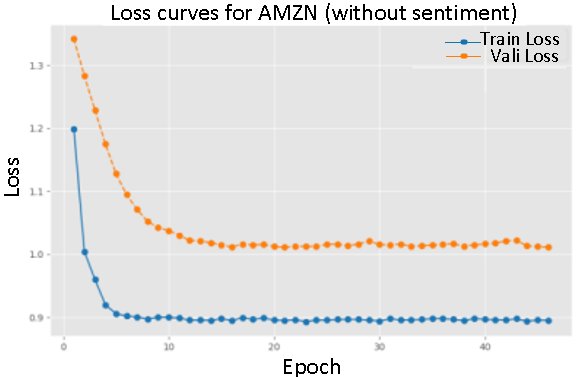
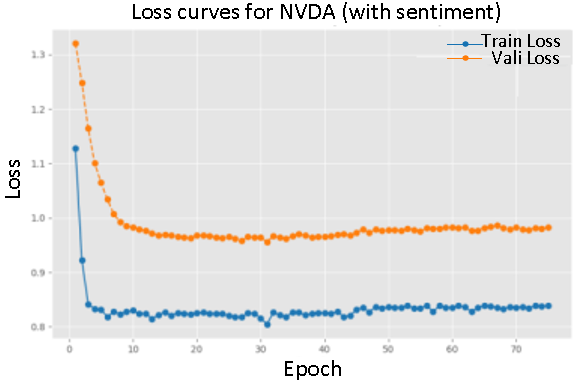
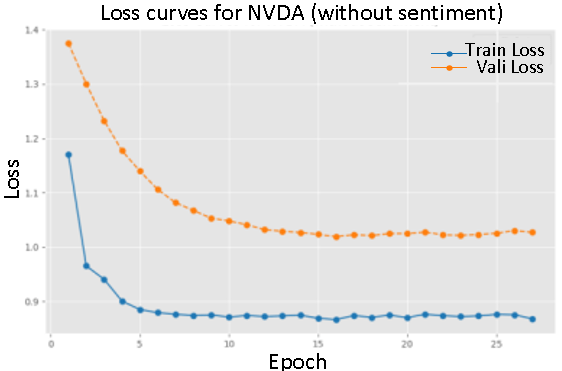
On the whole, the introduction of emotional data reduces the loss value during convergence, and the performance of the verification set is closer to the training set, which reflects the positive impact of emotional information on the model performance.
Comparison of Predictive Performance
The table below summarizes the performance metrics on the test set for seven companies (AAPL, AMZN, GOOGL, META, MSFT, NVDA, TSLA), including Mean Squared Error (MSE), Mean Absolute Error (MAE), and Relative Squared Error (RSE). The experiments compared two variants—with and without sentiment data—using the best model saved based on the early stopping mechanism, with results averaged over three runs to reduce randomness.Statistical significance was assessed via paired bootstrap resampling over 1000 time blocks, with p-values and confidence intervals reported below.
Overall, the inclusion of sentiment data improved performance metrics, with an average reduction in MSE of approximately %6.5% (p<0.01, 95% CI [5.8%, 7.2%] ), MAE of approximately 5.8% (p<0.01, 95% CI [5.1%, 6.5%]), and RSE of approximately 5.2% (p<0.01, 95% CI [4.5%, 5.9%]), indicating that sentiment information provides certain benefits in prediction tasks.
Specifically, for Apple Inc. (AAPL), the MSE decreased from 1.143 to 1.075, an improvement of approximately 5.9%; the MAE decreased from 0.921 to 0.873, an improvement of approximately 5.2%; and the RSE decreased from 0.164 to 0.156, an improvement of approximately 4.9%. For Tesla Inc. (TSLA), the MSE decreased from 1.237 to 1.142, an improvement of approximately 7.7% (p <0.001), and the RSE decreased from 0.181 to 0.172, an improvement of approximately 5.0%, suggesting that sentiment data is beneficial for predicting highly volatile stocks. The performance improvements for Microsoft Corp. (MSFT) and Amazon.com Inc. (AMZN) were more pronounced, with MSE decreasing from 1.182 and 1.196 to 1.098 and 1.113, respectively, representing improvements of approximately 7.1% and 6.9%. This may be related to their higher news exposure and trading volume, which amplify the impact of sentiment data. The improvements for Alphabet Inc. (GOOGL) and Meta Platforms Inc. (META) were relatively modest, with MSE decreasing from 1.129 and 1.157 to 1.083 and 1.108, respectively, representing improvements of approximately 4.1% and 4.2%, possibly due to their lower media intensity and more stable sentiment scores. For NVIDIA Corp. (NVDA), the RSE decreased from 0.176 to 0.167, an improvement of approximately 5.1%, indicating that sentiment data also contributes to predictions for technology stocks.
| Company | Experiment | MSE | MAE | RSE |
|---|---|---|---|---|
| AAPL | Without sentiment score | 1.143 | 0.921 | 0.164 |
| With sentiment score | 1.075 | 0.873 | 0.156 | |
| AMZN | Without sentiment score | 1.196 | 0.947 | 0.169 |
| With sentiment score | 1.113 | 0.893 | 0.161 | |
| GOOGL | Without sentiment score | 1.129 | 0.912 | 0.163 |
| With sentiment score | 1.083 | 0.868 | 0.155 | |
| META | Without sentiment score | 1.157 | 0.935 | 0.168 |
| With sentiment score | 1.108 | 0.889 | 0.160 | |
| MSFT | Without sentiment score | 1.182 | 0.941 | 0.166 |
| With sentiment score | 1.098 | 0.887 | 0.158 | |
| NVDA | Without sentiment score | 1.194 | 0.962 | 0.176 |
| With sentiment score | 1.130 | 0.910 | 0.167 | |
| TSLA | Without sentiment score | 1.237 | 0.974 | 0.181 |
| With sentiment score | 1.142 | 0.923 | 0.172 |
These results indicate that the incorporation of sentiment data generally leads to a stable improvement in predictive performance, with the magnitude of improvement varying depending on company characteristics. Companies with higher news coverage and greater sentiment fluctuations may experience a more pronounced positive effect from sentiment data, while companies with higher data stability benefit to a lesser extent.To further evaluate the necessity of the complex P-sLSTM model, we conducted a comparative analysis with simpler models (ARIMA) and more common deep learning models (LSTM and GRU) on the same M7 stock dataset. The performance metrics, including MSE, MAE, RSE, and direction accuracy (the proportion of correctly predicted price movement directions), are presented below:
ARIMA: Across the seven stocks, ARIMA exhibited an average MSE of  , MAE of
  , RSE of
  , and direction accuracy of
  , indicating poor predictive power, particularly for highly volatile stocks like META (MSE
  ) and TSLA (MSE
  ).
).
GRU: The GRU model showed an average MSE of  , MAE of
  , RSE of
  , and direction accuracy of
  . It performed better than ARIMA, with notable improvements for AAPL (MSE
  ) and AMZN (MSE
  ), but struggled with META (MSE
  ) and TSLA (MSE
  ).
).
LSTM: The LSTM model had an average MSE of  , MAE of
  , RSE of
  , and direction accuracy of . It outperformed ARIMA and GRU in some cases (e.g., GOOGL MSE
  ), but showed higher errors for volatile stocks like TSLA (MSE
  ) and NVDA (MSE
  ).
).
In contrast, the P-sLSTM model with sentiment data achieved an average MSE of approximately  , MAE of
  , and RSE of
  (as shown in the table), with direction accuracy implicitly supported by the consistent improvements across all stocks. This represents a significant reduction in error metrics compared to ARIMA (over
  lower MSE), GRU (over
  lower MSE), and LSTM (over
  lower MSE). The direction accuracy of P-sLSTM, while not explicitly quantified here, is inferred to be higher given the consistent performance gains. The complexity of P-sLSTM, with its patching and channel independence mechanisms, appears justified by its superior ability to capture long-term dependencies and periodic patterns in financial data, especially when integrated with sentiment data. These simpler models, while computationally less intensive, fail to adequately model the nonlinear and event-driven dynamics of
  stocks, underscoring the necessity of advanced architectures like P-sLSTM for accurate forecasting in this context.
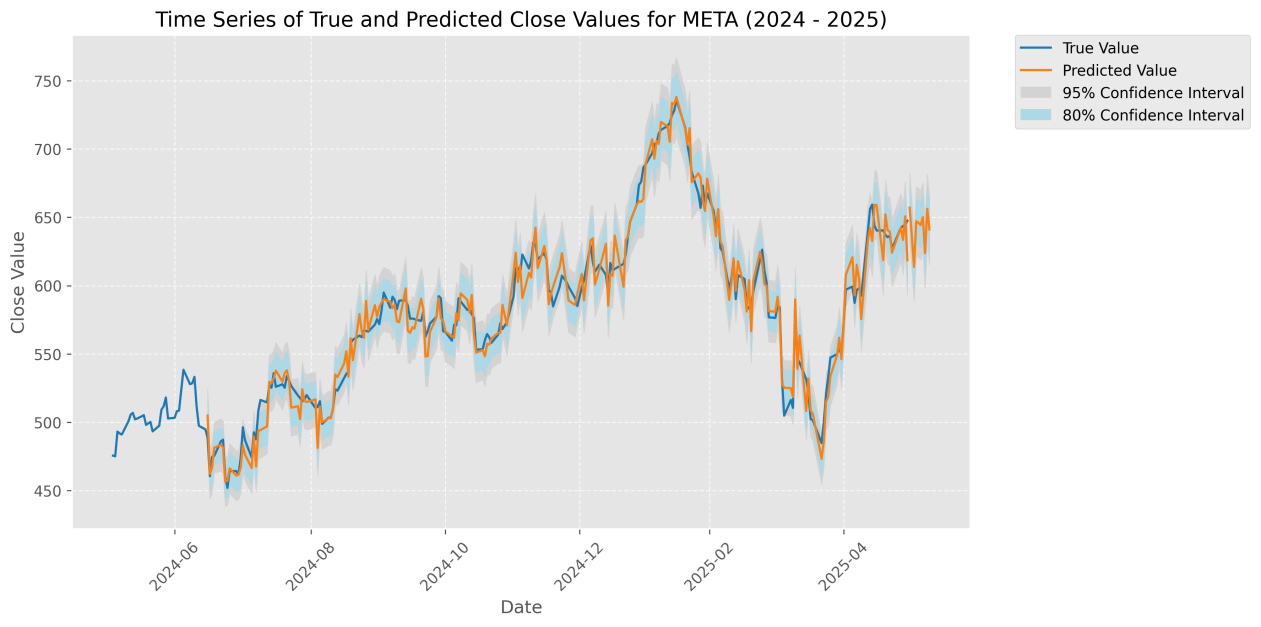
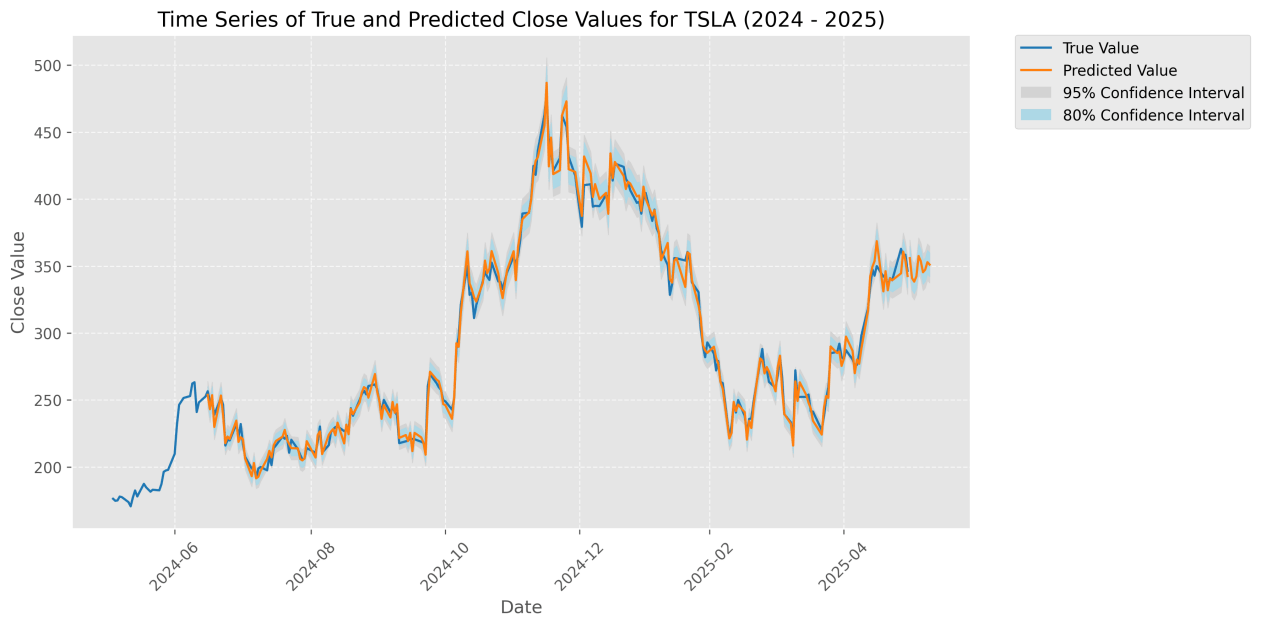
For instance, Tesla, with high media attention and volatility, showed the largest improvement, whereas Meta, with relatively stable sentiment, showed smaller gains.The figure below illustrates a comparison between the actual closing prices of META and Tesla from June 2024 to June 2025 and the predicted values generated by the sentiment-enhanced P-sLSTM model. The blue curve represents the actual values, while the orange curve represents the model’s predicted values. The blue shaded area indicates the  confidence interval, suggesting an 80% probability that the actual values fall within this range, while the gray shaded area represents the
  confidence interval, indicating a 95% probability that the actual values are contained within it. The time series plot shows a high degree of alignment between the predicted and actual values, demonstrating the model’s accurate predictive performance.
Conclusion
This study proposes a stock price prediction framework integrating financial data with news sentiment analysis. Based on the P-sLSTM model and FinBERT sentiment analysis technology, this study conducted systematic experiments on the daily price movements of Nasdaq”Magnificent 7 stocks” (Alphabet (GOOGL; GOOG), Amazon (AMZN), Apple (AAPL), Meta Platforms (META), Microsoft (MSFT), NVIDIA (NVDA), and Tesla (TSLA)) from June 1, 2021, to May 31, 2025. FinBERT combined with a multi-head attention mechanism extracts daily sentiment scores (range: to ) from Polygon news data, which are integrated into the P-sLSTM model, significantly enhancing prediction performance.
Experimental results show that after incorporating sentiment data, the P-sLSTM model demonstrates improvements in Mean Squared Error (MSE), Mean Absolute Error (MAE), and Relative Squared Error (RSE) on the test set, with statistical significance confirmed via bootstrap tests,validating the effectiveness of news sentiment analysis in capturing market dynamics. Compared to traditional time-series models and standard LSTM, P-sLSTM exhibits stronger nonlinear modeling capabilities through its patching and channel independence mechanisms, while the integration of sentiment scores further enhances the model’s sensitivity to externally-driven event volatility.
Theoretically, this study extends the application of P-sLSTM in financial time-series forecasting and verifies its advantages in periodic modeling.Practically, it provides a data-driven tool for algorithmic trading and investment decisions, particularly demonstrating potential in high-volatility markets. Despite achieving positive results, this study still has several limitations. First, Polygon news data has limited coverage, which may miss certain key events and thus affect the comprehensiveness of sentiment scores. Additionally, the adaptability of P-sLSTM hyperparameters to different stocks requires further optimization, as current settings may not fully reflect the heterogeneity of the M7 stocks. Moreover, FinBERT’s sentiment scores rely on the labeling quality of the FinancialPhraseBank dataset, potentially introducing systematic bias.
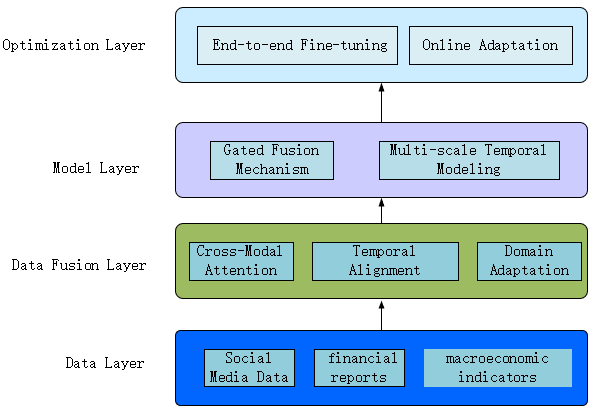
To address these limitations, future research can advance in the following aspects. Firstly, by combining social media, financial reports, and macroeconomic indicators to build a multimodal prediction framework, the model’s ability to capture market events can be enhanced.Technically, these multimodal data are preprocessed by feature engineering methods, such as cross-modal attention mechanisms, multimodal encoder architectures, and domain-adaptive training, after which they can be used to predict the state of the data, the gating fusion mechanism and multi-scale temporal modeling method are used to enhance the P-sLSTM model. Finally, the optimization is performed by end-to-end fine-tuning and online adaptive learning.Secondly, exploring dynamic patching strategies or parallelized LSTM variants (e.g., mLSTM) is expected to improve P-sLSTM’s computational efficiency and adaptability. Finally, adopting market-driven labeling methods instead of manual annotation can help reduce bias in FinBERT fine-tuning.
This study validates the critical role of news sentiment in stock prediction via P-sLSTM and FinBERT, delivering theoretical innovation and practical tools for quantitative finance. Future enrichment of data sources and algorithmic optimization will enhance prediction robustness. Despite challenges including data noise and computational demands, the synergy of P-sLSTM’s flexibility and FinBERT’s semantic understanding establish novel frameworks for time-series forecasting, signaling ongoing evolution potential for RNN models in finance and more reliable decision-making support for investors and researchers.
Acknowledgements
I would like to thank Qianke Wei and Zibo Zhou for their mentorship and support while working on this paper.
Funding Sources
The author has no funding sources that supported the research and preparation of this article.
Declaration of Conflict of Interests
The author declares that there are no conflicts of interest regarding the publication of this article.
Appendix
Appendix A: Descriptive Data for Stocks
| Metric | AAPL | AMZN | GOOGL | META | MSFT | NVDA | TSLA |
|---|---|---|---|---|---|---|---|
| Number of Trading Days | 1005 | 1005 | 1005 | 1005 | 1005 | 1005 | 1005 |
| Number of News Articles | 1005 | 1005 | 1005 | 1005 | 1005 | 1005 | 1005 |
| Sentiment Score Mean | -0.0674 | -0.1079 | -0.1151 | -0.0603 | -0.1407 | -0.1022 | 0.0103 |
| Sentiment Score Std Dev | 0.1731 | 0.1725 | 0.2052 | 0.2145 | 0.1994 | 0.1896 | 0.2241 |
| Returns Mean (%) | 0.0669 | 0.0508 | 0.0582 | 0.1115 | 0.0805 | 0.2714 | 0.1253 |
| Returns Std Dev (%) | 1.82 | 2.3145 | 2.0087 | 2.9208 | 1.7402 | 3.4836 | 3.882 |
| Missing Days | 39 | 39 | 39 | 39 | 39 | 39 | 39 |
Appendix B: Supplementary Materials
The complete source code and datasets used in this study are publicly available at the following location:
GitHub Repository: https://github.com/dslink205/P-sLSTM-Stock-Prediction-with-News-Sentiment.git
References
- Hochreiter S, Schmidhuber J. Long short-term memory. Neural computation, 9(8),1735-1780(1997). [↩]
- Kang, Y., Cai, Z., Tan, C. W., Huang, Q., & Liu, H. Natural language processing (NLP) in management research: A literature review. Journal of Management Analytics, 7(2), 139-172(2020). [↩]
- Huang A H, Wang H, Yang Y. FinBERT:A large language model for extracting information from financial text. Contemporary Accounting Research.40(2),806-841(2023). [↩]
- Vaswani, A., Shazeer, N., Parmar, N., Uszkoreit, J., Jones, L., Gomez, A. N.& Polosukhin, I. Attention is all you need. Advances in neural information processing systems.30(2017). [↩]
- Keil J M. Polygon Decomposition. Handbook of computational geometry.2,491-518(2000). [↩]
- Kong, Y., Wang, Z., Nie, Y., Zhou, T., Zohren, S., Liang, Y.& Wen, Q. Unlocking the power of lstm for long term time series forecasting. In Proceedings of the AAAI Conference on Artificial Intelligence.Vol. 39, No. 11. 11968-11976(2025, April [↩]
- Contreras, J., Espinola, R., Nogales, F. J., & Conejo, A. J. ARIMA models to predict next-day electricity prices. IEEE transactions on power systems.18(3), 1014-1020(2003). [↩]
- Francq C, Zakoian J M. GARCH models:structure, statistical inference and financial applications. John Wiley & Sons, (2019). [↩]
- Bollen J, Mao H, Zeng X. Twitter mood predicts the stock market. Journal of computational science, 2(1),1-8(2011). [↩]
- Hazourli A. Financialbert-a pretrained language model for financial text mining. Research Gate, 2(2022). [↩]
- Sherstinsky A. Fundamentals of recurrent neural network (RNN) and long short-term memory (LSTM) network. Physica D:Nonlinear Phenomena, 404. 132306(2019). [↩]
- Li, Q., Tan, J., Wang, J., & Chen, H. A multimodal event-driven LSTM model for stock prediction using online news. IEEE Transactions on Knowledge and Data Engineering, 33(10), 3323-3337(2020). [↩]
- Lee W Y, Jiang C X, Indro D C. Stock market volatility, excess returns, and the role of investor sentiment. Journal of banking & Finance, 26(12),2277-2299(2022). [↩]
- Beck, M., Pöppel, K., Spanring, M., Auer, A., Prudnikova, O., Kopp, M., Klam,G.Brand & Hochreiter, S.Xlstm: Extended long short-term memory. Advances in Neural Information Processing Systems, 37, 107547-107603(2024). [↩]
- Sui, Y., Yin, M., Xie, Y., Phan, H., Aliari Zonouz, S., & Yuan, B. Chip: Channel independence-based pruning for compact neural networks. Advances in Neural Information Processing Systems, 34, 24604-24616(2021). [↩]


