
Abstract
This paper will discuss how the use of AI (artificial intelligence), specifically the use of YOLO (You Only Look Once) models such as YOLOv5s, YOLOv5m, YOLOv5l, YOLOv8s, YOLOv8m, and YOLOv8l, can be used to detect craters on the moon. Automated crater detection is useful for moon landings since astronauts can find flat surfaces for aircraft to land on, which can greatly improve safety for both the astronauts and the spacecraft they use to land on. By finding a dataset with images of lunar craters, labeling the craters, and preprocessing the data to train each of the four YOLO models, it is possible to get resulting metrics such as class loss, precision, F1 scores, and confidence scores. Results from this experiment indicate that the YOLOv8 model outperforms the YOLOv5 model, with the YOLOv8l model achieving the highest precision and F1 metric, while the YOLOv5s receives the lowest performance on all tested metrics. This experiment will focus mainly on class loss, precision, recall, confidence scores, and F-1 confidence scores, and other important metrics will not be used due to limitations within the tests. The study also researches the fact that even though YOLO models are part of significant technological advancements, there are some key differences between the models. Thus, this paper will not only focus on understanding the YOLO models in lunar detection, but will also contribute to the field of object detection applications and future space missions.
Key Words: artificial intelligence, class loss, comparison, craters, F-1 confidence score, precision, recall confidence score, YOLO models
Introduction
Interest in space travel has increased over the decades, yet the colonization of other planets has still been something that has not been achieved. Colonization, though, has a major drawback since NASA has deemed craters as an unsafe space to land near with spacecraft1. With the development of many new AI-related devices, specifically computer vision, this major problem can be solved. Using YOLO models, which are processes of using neural networks to classify specific items in an image, specific images, such as craters, can be easily identified on many planets and find flat places.
For most scientists and astronomers, crater discovery has always been challenging and manual, although automated crater detection is becoming more feasible thanks to AI, which offers advantages such as flexibility, consistency, and efficiency. When comparing AI to humans, it can process a large number of images and inspect them much faster than humans, which not only reduces errors but also yields accurate findings. Additionally, since autonomous systems are flexible, it is possible to train these models to find craters on different surfaces. Nevertheless, there are still some challenges that limit AI in image detection, such as labeled datasets.
Some factors must be considered, such as class loss, F1 metrics, and confidence metrics, to assess how well a YOLO model performs, since these are some of the most valuable metrics that provide a deeper understanding of how well a model functions. The main idea of computer vision is to make machines able to complete a specific task that the user gives them, when presented with information. Many common tasks can be completed, some of which are object detection, feature extraction, and image processing. To do this, many popular algorithms, such as YOLO models, are used for picture recognition and categorization. These YOLO models use a single neural network to quickly and accurately predict different types of metrics from entire images. A neural network is a function that uses neurons or nodes to process information and learn from data. In this case, it is important because it is necessary to process information about craters, in which neural networks have to be used. Though there are alternate models that can be used, this experiment will mainly focus on YOLO models due to their superiority over other models due to accuracy and generalization2. It is important to note that for other models, the outcomes may vary, but currently, it is not feasible to include other models for this experiment, which is why only the YOLO models will be used. Furthermore, this study aims to get a better understanding of only the YOLOv5 and YOLOv8 models, and resource constraints allow for only these two models to be tested. In total, all these jobs combine to form a model that can identify patterns in vast volumes of data that are present across multiple fields that include autonomous systems, machine learning, and natural language processing.
In machine learning algorithms, there are mainly three general categories: supervised, unsupervised, and reinforcement learning3. Supervised learning is a machine learning technique that uses labeled datasets to train algorithms to recognize specific patterns and predict results. On the other hand, unsupervised learning is a machine learning technique that uses a self-learning algorithm to look at unlabeled data without human supervision. Reinforced learning is a machine learning technique that teaches software how to make predictions and get good results from those predictions. Because YOLO models are taught to recognize specific objects using labeled datasets, they fall within the category of supervised learning models. This has to be taken into consideration when dealing with image detection because each model needs to have different approaches to it, meaning some techniques may be better for others in particular cases.
Backbones are also another crucial factor of the YOLO models’ ability to detect craters on planetary surfaces. A backbone, in the context of AI and image detection, is the part of the neural network that takes the input image and extracts the most valuable features from that image. The backbone of any YOLO architecture serves as the main feature extraction network that processes input images and detects important visual characteristics, such as edges, textures, and patterns, that are crucial for any type of identification, in this case, crater identification. This feature extraction is the main reason that models can recognize and classify objects, including craters of different sizes and shapes4. Most backbones are often CNNs (Convolutional Neural Networks), which a neural networks used for image recognition and processing. These CNNs have already been trained, some of which are named ResNet(Residual Neural Network), CSPDarknet(Cross Stage Partial Darknet), Darknet, and EfficientNet. These trained backbones are used because they can keep a balance between efficiency and accuracy, and are seen in multiple YOLO models for this. For instance, earlier YOLO versions have been swapped with Darknet because it is suitable for tasks in real-time detection. On the other hand, more recent YOLO models include the CSPDarknet, which has improved accuracy because of the neural network’s ability to learn complex features while still having great efficiency. Another example that signifies a big step in YOLO model’s backbones is when the CSPDarknet backbone was released in 2020. This provided the YOLOv5 version with the ability to increase all metrics, which made it popular amongst other YOLO models, though for this experiment, speed will not be a focus because the study aims to focus on evaluating the accuracy and reliability of crater detection rather than the speed5. The backbone chosen for crater detection has a significant effect because some metrics may shift depending on the backbone. Because the backbones significantly influence the YOLO models’ ability to process high-resolution images of different planetary surfaces and extract features for crater detection, even if the craters vary in size or shape, they are therefore a crucial part of the YOLO model design for space exploration missions.
Crater detection with AI, and more specifically YOLO models, is crucial for several reasons. Because it can automate the identification of craters by itself, it is both scalable and efficient. Automation reduces human error while creating reliable results. By locating flat regions without craters on planetary surfaces, this technology can assist in the planning of safe landing sites for spacecraft, advancing space exploration, and creating an easier process for landing during space missions. This paper will use the YOLO algorithms for crater detection and conduct a comparative analysis between all versions of two YOLO models: YOLOv5 and YOLOv8. The study looks into how different YOLO models differ in metrics. The paper will also provide a detailed description of the methodology used for the comparative analysis, as well as present the metrics and an analysis of these results.
This study aims to address the following research question: “How do specific YOLOv5 and YOLOv8 versions perform in lunar crater detection when evaluated using specific metrics, such as class loss, precision, and F1 scores, are compared?” By answering this question, this research contributes to the advancement of AI-driven technology in space missions.
Results
| Dataset Images | YOLO5s | YOLO5m | YOLO5l | YOLO8s | YOLO8m | YOLO8l |
| Validation Class Loss | 0.58931 | 0.54343 | 0.51405 | 0.57498 | 0.51405 | 0.50505 |
| Precision | 0.75501 | 0.7697 | 0.77903 | 0.7597 | 0.77903 | 0.79013 |
As seen in Table 1, the models were evaluated based on validation class loss and precision for different epochs, showing that the larger models (YOLOv5l and YOLOv8l) outperformed the medium and small models. For example, YOLO8l got better scores for both validation class loss and precision than YOLO8s and YOLO8m. This is similar for the YOLO5l model, where it is better than YOLO5s and YOLO5m, but not by a large amount. It is also important to note that as the validation class loss approaches 0, the better and better it gets. On the other hand, the precision metric is better as it approaches 1, meaning that if the model reaches 1, it will be 100% precise. Furthermore, something to keep in mind is that as the epoch increases, the validation class loss and precision decline and increase, respectively. Another key conclusion that is made as a result of this table is that the YOLO8 model is better than the YOLO5 model in all of its respective models.
|
|
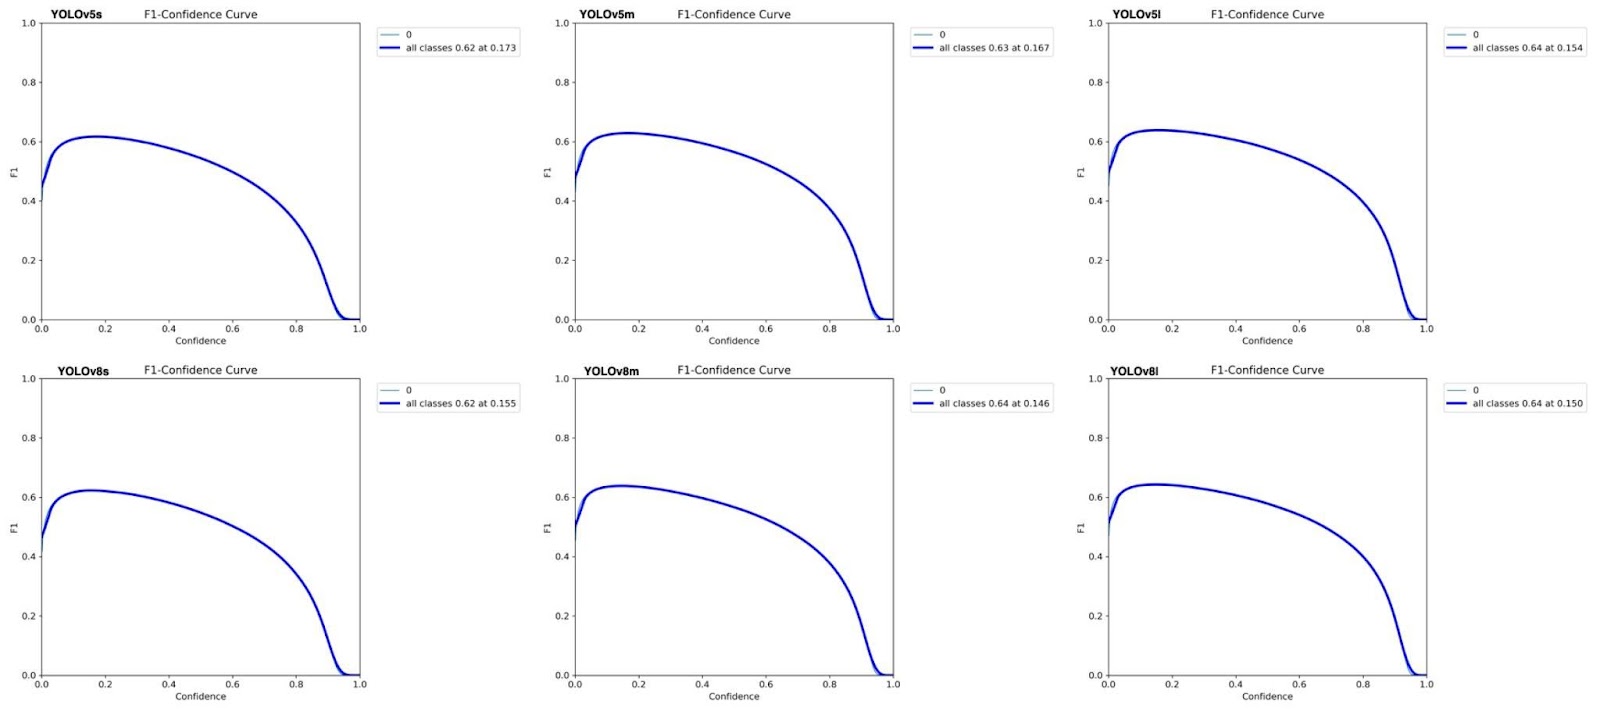
Figure 2, displaying the graphs with F1 confidence curves, shows how well all of the YOLOv5 and YOLOv8 models can balance precision and recall, meaning the higher and flatter curves mean better overall performance. In Figure 2, the y-axis, which is the F1 score, is seen to rise by a small amount, stay at around 0.63, and then gradually decline to 0. On the other hand, for all models, the confidence, which is the x-axis, steadily increases until 0 and only starts to slow down at the start and the end. This pattern suggests that even though the confidence levels are high, the model still experiences returns that decrease in the area of accuracy, showing that there is a trade-off.
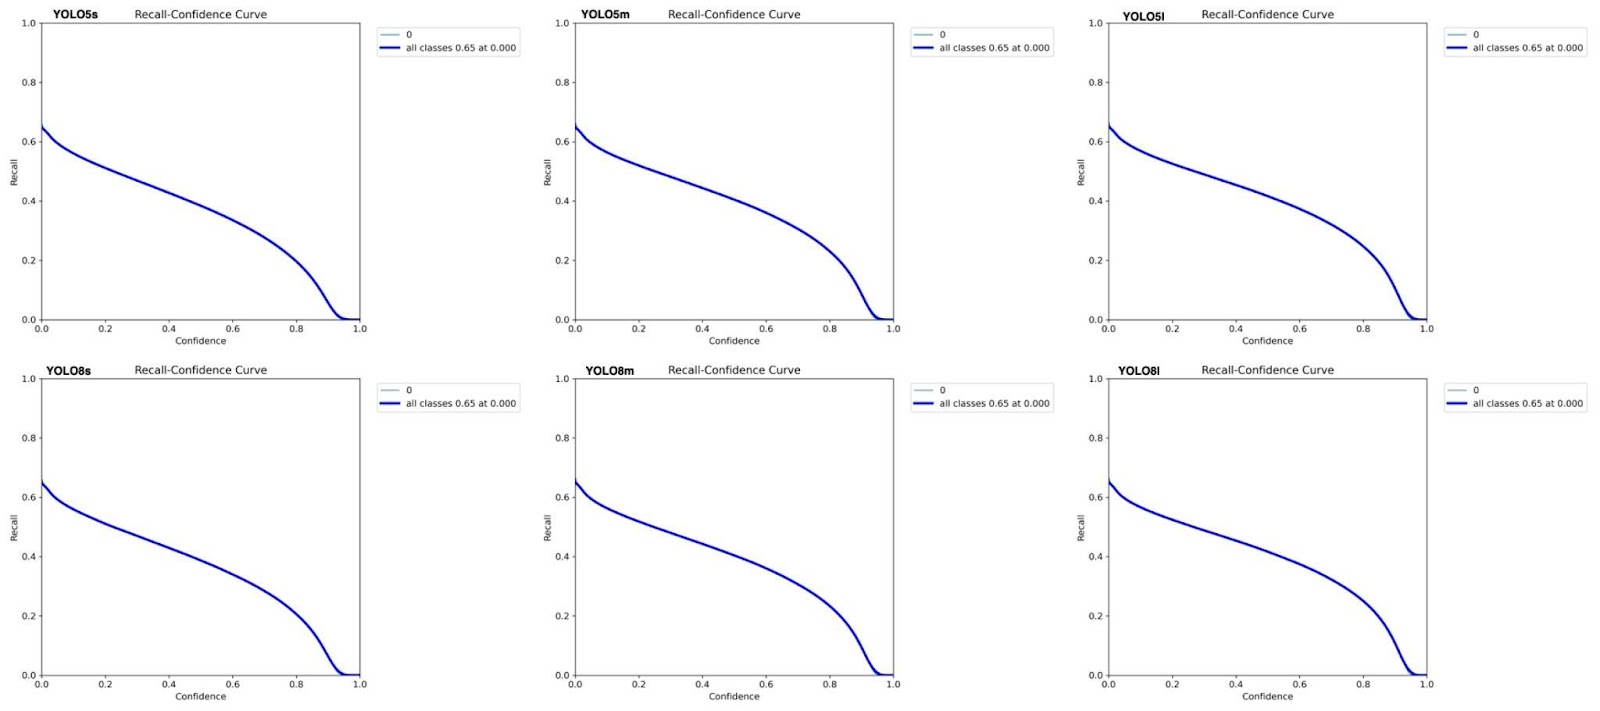
Figure 3 includes the recall confidence curves that have downward trends. Unlike Figure 2, Figure 3, which is the recall metric, starts at around 0.65 and decreases almost linearly, ending up at 0, showing that there is a constant drop in accuracy as the confidence increases. The drop at the end of the graph is different between each of the small, medium, and large versions, best seen in the large models, as it is steeper, signifying that the model is more efficient.
From this data, it is important to understand that in both models, the large version of the specific YOLO model is better in terms of accuracy, and the small version of the YOLO model is the worst in accuracy. But when comparing both the YOLOv5 and YOLOv8 models, it is clear that the YOLOv8 model is better than the YOLOv5 model. The enhancements attached to the YOLOv8 are likely a reason for its better scores, underscoring the importance of the constant improvements in algorithms. The main contributor, though, is the anchor-free detection, where an object detection model predicts certain object locations without using predefined anchor boxes. This addition allows for more flexibility while also costing less computational power. Though this is the main change, other factors like better spatial pyramid pooling or better feature extraction also play a role. Spatial pyramid pooling refers to a special technique used in CNNs that allows for the processing of images of different sizes by extracting specific features at different scales through pooling layers. This generates a fixed-length output regardless of the image size that was input, which removes the constraint of needing a specific fixed input size, though for this experiment, a fixed size was needed since the YOLOv5 model was not equipped with this type of technology. Feature extraction was also upgraded in the YOLOv8 model, meaning that this new model was able to extract the most important information better from the dataset. The comparison of several YOLO models—YOLOv5s, YOLOv5m, YOLOv5l, YOLOv8s, YOLOv8m, YOLOv8l— in the context of lunar crater detection, offers insight into how these models might be used to address actual space exploration problems. To find out which model is best for a specific group of images, in this case, craters, metrics such as accuracy and efficiency, need to be assessed. In specific, these assessments need to be tuned perfectly for a model in a field such as planetary exploration, where some scenarios in space may require quick, impulsive decisions, while other scenarios require slow and accurate results. For example, these models can be used to identify creator-free landing sites rapidly and precisely that are suitable for spaceship landings. As a result, many mission failures could be reduced because these models can identify crater-less areas quickly. However, space travel is not the only application of this study. Other areas can also profit from the comparison of certain YOLO models, such as autonomous vehicle driving, remote sensing, and environmental monitoring. By showing how well AI models can be used for specific tasks, this study provides a starting point for image identification using YOLO models.
Discussions
In summary, this paper discusses crater detection between the YOLOv5 and YOLOv8 models-specifically, the small, medium, and big versions. During the tests, these models were trained using an online dataset consisting of lunar photos that resulted in multiple different outcomes, such as class loss, precision, F1 scores and confidence scores6. In the end, the study showed that both the YOLOv5 and the YOLOv8 models were effective for detecting craters, though the YOLOv8 models, specifically the YOLOv8l model, showed better results in both class loss and precision.
The results from this study provide valuable insights into the effectiveness of YOLO models for crater detection. Improved crater detection models could enhance autonomous navigation during space exploration. Additionally, YOLOv8’s performance highlights the importance of architectural advancements, where precise feature extraction allows for accurate crater detection.
Though this experiment was straightforward and informal, there are lots of possible ideas that can be incorporated into creating a better comparison between models of any kind. In the future, it is possible to look at other YOLO models to compare and study to find the true winner in terms of specific metrics like class loss, precision, F1-Confidence, and R-Confidence results. When looking at other YOLO models, other metrics such as speed, memory usage, frames per second or computational requirements could be heavily considered and talked about for future research papers. Adding different datasets of the Moon or possibly from other celestial bodies such as Mars can further benefit this research paper, which will likely contribute to stronger and better results that match real-world scenarios. It is important to note that as the dataset grows and includes more data, the model may need to be adapted with better techniques to maintain accuracy. Other works in the future could include changes in the number of epochs or the batch size, since for this experiment resources were limited. Increasing the batch size or epoch number could potentially help the results be more accurate, though it could also cause the results to be unreliable. Additionally, switching models could potentially change the outcome of this experiment. For example, other models such as Single Shot Multibox Detector (SSD) and Region-based Convolutional Neural Network (R-CNN) can be used since different models may vary in different metrics.
This research has significant applications for space exploration as it enhances the safety of lunar landings by accurately detecting craters. By detecting craters on planetary surfaces, vehicles can safely land on places with no craters, allowing for safe landing places. Because this research has given the outputs of specific metrics for different YOLOv5 and YOLOv8 models, it will not only be able to help advance the understanding of object detection but also add to the broader field of object detection. As the exploration of celestial bodies grows faster and faster, the application of these models will be more useful for crucial space missions.
Method
This paper will compare different YOLO models, specifically YOLOv5s, YOLOv5m, YOLOv5l, YOLOv8s, YOLOv8m, and YOLOv8l, to see how efficient they are in crater detection. Three metrics—efficiency, accuracy, and performance—will be used to find which model performs best.
The first step for this experiment is data gathering. Data gathering requires a sufficient number of images of craters of different shapes and sizes to mimic real-life scenarios that these models would encounter. Using an online dataset titled the Impact Moon Craters (LU3M6TGT), which was included in this study due to its immense amount of images, it is possible to get thousands of photos of the Moon’s craters6. Though this dataset included thousands of photos, which were used for testing, which minimizes bias, this study only used one dataset that included both a training and validation set. The total amount of images that were used was 10301 images, and were split with approximately an 85% to 15% split, with the training set holding 8756 images and the validation set holding 1545 images. This split is perfect because it can balance learning and prevent overfitting, where a model fits too closely with the data and cannot generalize it anymore. Each image contained up to 1000 labeled craters, with each crater being about 5-150 pixels in diameter.
After finding a dataset, each image is labeled, which involves finding an image’s craters and marking them with boundary boxes. Each label was automatically generated, where each of the images are mapped and aligned instead of being manually labeled. These labels were not part of an inter-annotator agreement, which means that these labels were not checked manually, since the dataset does not provide a mention about inter-annotator agreements. Furthermore, challenges with small craters pose a risk since there is a chance that they may have been missed by the automation, though there was no specific mention of handling small craters.
The next step for this methodology is data preprocessing, which involves cleaning the data to make sure the experiment produces sufficient results. Data preprocessing is done by cleaning the data, transforming the data, or reducing the data size for better optimization.
Then, to make sure the pictures fit into the model for testing, every image is resized to a specific size of 416 pixels by 416 pixels. This resizing ensures that there is consistency for each image in input dimensions, allowing the model to test and process these images without any distortions. If there were to be distortions in the images, resizing the images would ensure that all images are processed under the same conditions, reducing error in the results.
After the data preprocessing step, the model starts training. To activate the model, pre-trained weights from COCO(Common Objects in Context), a popular object detection dataset, are used, which helps models detect common features such as textures or edges. However, COCO does not include craters, so transfer learning was applied to make the model adapt to the dataset. The pretrained weights acted as a base for the model, while fine-tuning was applied on the dataset to train the model on crater patterns. During fine-tuning, early layers were frozen to keep general features, while the later layers were adjusted for crater detection. The dataset was then carefully marked, and hyperparameters were added to ensure a smooth learning period. In the end, this helped the model better distinguish differences between the craters and the terrain. The pre-trained weights can also be adjusted to fit the purpose of one’s experiment. This is sometimes done to improve performance on related tasks. During the first phase of training, these models can predict metrics. The ability to predict metrics is given by looking at data or patterns and predicting outcomes. To guarantee maximum efficiency, hyperparameters for each specific model can be changed, but are kept the same for this experiment, so there are no outside factors that influence the results. Hyperparameters are variables that one sets manually before training a model, and in this case, they are the batch size and the number of epochs. The batch size refers to the number of training examples used in one iteration of testing, and epochs refer to the number of times a model repeats the dataset. For this experiment, the batch size will be 8 and the epochs will be 100.
A batch size of 8 has been chosen to create a balance between efficiency and model convergence, making sure that the memory usage remains manageable while still being able to allow the model to learn efficiently. Batch size, in this experiment, does not really affect precision, instead only being used to modify the efficiency of the Graphics Processing Unit(GPU) memory7. In any case, larger batch sizes would speed up training and lead to less generalization, though smaller batch sizes can make training unstable. This experiment specifically selected 8 as the batch size since smaller batch sizes allow for more variability and each training, meaning the model sees slightly different gradients each time, preventing the model from memorizing patterns within the data too quickly. This experiment did not test on different batch sizes, though given that the YOLOv8l model is larger and more demanding than other models, increasing the batch size could have led to memory overflow. While batch sizes sometimes improve stability, they can also cause the model to reduce generalization to unseen data. On the other hand, the number of epochs used will be 100 since this experiment aims to let the model have a sufficient amount of time to learn patterns in the data while avoiding overfitting. If the number of epochs ends up being too low, the model will not get enough exposure to the dataset, leading to unreliable results. If the number of epochs is too high, though, there may be an overfit, where the model ends up memorizing the data instead of learning from it7. The specific number of epochs and batch size were the best fit for this experience since resources were very limited.
Following the training, the models go through an evaluation process, which is when the models are tested with a validation dataset that has images not used in training6. Since these images are similar but are not used in the actual training phase, they are compared afterward by providing an unbiased evaluation of how well a specific model generalizes.
The metrics measured for this experiment are precision, class loss, recall and F-1 scores. Precision shows the percentage of correctly identified craters by that model. The precision metric is measured as a decimal between 0 to 1, where a value closer to 0 shows that the model correctly identified a low number of craters and values closer to 1 show that the model correctly identified a higher number of craters. Class loss is a metric that measures how wrong a model’s predictions are. Recall measures how often a model correctly identifies positive instances from all the positive samples in a dataset. This means that if the recall score is 1, there are no false negatives, and the model has detected 100% of all objects correctly. Conversely, if the recall score is 0, then the model has not detected any of the objects correctly. On the other hand, though, the F-1 score is a type of metric that combines and takes the mean of precision and recall in order to essentially show the overall performance. The F-1 score is specifically a useful metric when precision and recall are in a trade-off8. If there is an imbalance in the F-1 score, then there is a disparity between accuracy and precision9.These specific metrics have been used since this study aims to look for accuracy and precision, which is how well the YOLO model can correctly identify objects. For this goal, precision, recall, and F1-scores and class loss are vital metrics to see if these models are accurate9.
While the models differ in metrics such as efficiency and accuracy, this study did not focus on comparative analysis in speed. Due to limited resources, speed was not considered as a metric. The smallest version, YOLO5s, is useful for applications where accuracy is the most important due to its addition of the CSP backbone. YOLO5m is a good middle option since there is an all-around balance in metrics for this model. Meanwhile, YOLOv5l is used in cases where accuracy should be maximized.
Although YOLOv5 is a great and efficient model, YOLOv8 has an improved architecture that has increased detection and model efficiency, making it more efficient than YOLOv5. Similar to YOLOv5, YOLOv8 has versions small, medium, and large for different performance requirements.
YOLOv8 has anchor-free detection, which allows it to be faster and more efficient when compared to other models with anchors. Models with anchors have preset bounding boxes that help them to predict the location and the size of an object in a specific image. To improve efficiency and cross-platform compatibility, which allows for software to be used on multiple platforms, multiple backbone networks need to be used. C2f is a neural network that extracts specific visual properties inside an image to create groups10. This backbone is seen in the YOLOv8 models. On the other hand, in the YOLOv5 models, a similar backbone, C3, is used. Compared to the C3 block used in YOLOv5, the main difference is that C2f includes a feature that increases gradient flow, the movement of errors through a neural network during training, and may result in better feature extraction.
This study was possible through a set number of steps, such as data preprocessing, model training, assessment, and comparative analysis. All of this was done using the hardware accelerators in Google Collaboratory, which included the Central Processing Unit (CPU), A100 Graphics Processing Unit, V100 Graphics Processing Unit, T4 Graphics Processing Unit, and Tensor Processing Unit (TPU). Since the A100 Graphics Processing Unit is the fastest option, it was used to train the models using Google Collaboratory to get optimal performance. Even though an A100 Graphics Processing Unit was used, the test took up to four hours to run for each specific model, highlighting some of the computational constraints.
This study focuses on the use of publicly available datasets for image detection. The dataset used is publicly available for research, and no personal data was involved in this experiment. Confidentially, this is not an issue, since the study used no data from humans. The models used in the study did not use any information that could potentially conflict with ethical guidelines. Furthermore, the study did not use any animals or humans, and therefore, there were no safety or environmental risks.
This paper delves into the study of object detection as well as the understanding of different YOLO models in crater detection.
Acknowledgements
The author of this paper is deeply indebted to Hina Ajmal for her unwavering support and guidance during the research process. The writer of this paper is also extremely thankful to all the staff at the Lumiere Research Scholars Program for their assistance. The author would love to extend his sincerity to his family, who supported him with constant love and encouragement throughout the journey.
References
- J. Mehta. “The time NASA figured out that our Moon is cratered all the way down.” Jatan’s Space, (2022). [↩]
- Z. Keita. “Yolo object detection explained: a beginner’s guide.” DataCamp, (2024). [↩]
- S. Kumar. “Supervised vs Unsupervised vs Reinforcement.” Attitude, (2020). [↩]
- O. Elharrouss, Y. Akbari, N. Almaadeed, S. Al-Maadeed, “Backbones-review: Feature extraction networks for deep learning and deep reinforcement learning approaches.” arXiv preprint arXiv:2206.08016 (2022). [↩]
- R. Munawar, F. Mattioli, G. Jocher, S. Waxmann, eds. “Architecture summary.” Ultralytics YOLO Docs, (2024). [↩]
- R. La Grassa, “Impact Moon Craters (LU3M6TGT).” Kaggle, (2023). [↩] [↩] [↩]
- K. Marshall. “How does epoch affect accuracy?” Deepchecks, (2024). [↩] [↩]
- P. Kashyap. “Understanding precision, recall, and F1 score metrics.” Medium, (2024). [↩]
- G. Jocher, A. Vina, R. Munawar. “Performance metrics deep dive.” YOLO Performance Metrics – Ultralytics YOLO Docs, (2024). [↩] [↩]
- R. Bai, F. Shen, M. Wang, J. Lu, Z. Zhang, “Improving detection capabilities of YOLOv8-n for small objects in remote sensing imagery: Towards better precision with simplified model complexity.” ResearchGate, (2023). [↩]


