
Abstract
Global Warming has been a prevalent issue in the world for a while but, precautions and actions towards stopping global warming have been very limited. Countries have tried multiple methods to try to alleviate global warming but have yet to be successful. Since systemic changes are yet to be implemented, this research examines how one’s individual choices affect global warming, by analyzing the effect of consumer preferences for automobile features on carbon emissions. Individuals with a higher preference for luxury automobile features, such as premium brands and models, are hypothesized to have a greater negative impact on global warming, evidenced by higher vehicle emissions ratings. This research leveraged a dataset of various car attributes and their influence on emissions. Leveraging the Random Forest Classification algorithm with car attributes as features and a categorical emission level output, this research aims to determine, what consumer preferences have an effect on emission emitted by a car. The categories of preferences studied were Manufacturer, Model, Transmission, Manual or Automatic, Engine Capacity, Engine Power, Power Train, and Noise Level. The findings showed that: 1) Luxury cars contributed more to carbon emissions than non-luxury cars. 2) no correlation existed between emissions and car attributes of noise level and engine power. 3) Lotus exhibited the highest emissions, and Cadillac had the lowest cars. 4) Rolls-Royce proved to be the least emissions efficient, Suzuki the most efficient, and 5) automatic cars were more eco-friendly. Understanding these can help car manufacturers properly design cars to be more environmentally friendly.
Introduction
The UN predicts that the world will pass a global average temperature that will be irreversible in the coming 10 years1. This is due to a phenomenon called global warming. Global warming has been a prominent issue in the world which started to become a serious problem in the early to mid-nineties, during the Industrial Revolution, and when cars started to become mainstream around 30 percent of global warming was caused solely by automobiles. The transport sector accounted for 23% of global CO2 emissions in 2010, and its share of emissions is expected to increase at a higher rate than that of other sectors by 20501. Road travel accounts for three-quarters of transport emissions. Most of this comes from passenger vehicles2. As the consumption of these vehicles continues to grow, the need for mitigation of emissions increases.
Although the effects of past emissions are significant, mitigation efforts are still possible and critical for future outcomes. One way consumers can mitigate their carbon emissions is by choosing what they drive. Choices between gasoline and electric vehicles, or between different vehicle manufacturers, play a critical role in shaping future emissions. Each individual’s vehicle choice can either exacerbate environmental damage or contribute to a cleaner, healthier planet. Some efforts are underway. For example, the emergence of electric cars has started a positive trend towards a better Earth. Electric vehicles (EVs) are expected to make up 30% of global car sales by 2030, significantly reducing CO2 emissions3. However, despite the growing popularity of electric vehicles, consumer preference remains largely in favor of internal combustion engine (ICE) vehicles. A major barrier is that consumers tend to resist new technologies that are considered alien or unproved, thus, policy decisions that consider their critical concerns will have a higher level of success3. However, electric cars have the potential to be a significant player in the global cleansing race as electric vehicles (EVs) are expected to make up 30% of global car sales by 2030, significantly reducing CO2 emissions3. Electric cars are not the only option that can help with the cause. Another car type for consumers to consider has been in the industry since 1997: Hybrids. A study concluded that hybrid vehicles combine internal combustion engines with electric propulsion, resulting in lower CO2 emissions compared to conventional vehicles4. Although hybrid vehicles like the Toyota Prius offer some environmental benefits, their battery range remains limited, with the Prius offering only 44 miles per charge. This means that the car mostly operates on gas, and the positive effect on the environment is still very little.
Another question to consider is how humans affect the amount of carbon their car emits. Researchers conducted a study to show the effect of passenger weight on the CO2 emissions emitted by the car.5 stated that “considerable reductions in CO2 emissions could be obtained if the weight of future (2020) new PCs (production cars) is controlled.”
Another possibility is government intervention. A European study mentions that the first point concerns the limit on exhaust CO2 emissions, which is based on the average emissions of each manufacturer’s sales. Using this value, car manufacturers can produce vehicles with low and high levels of CO2 emissions, as long as the average does not exceed the value of 95 g CO2/km6. Although government intervention can be helpful in the long run, it could put a significant dent in consumption levels, as producers will structure their cars differently and possibly not to the liking and comfort of the consumer. Therefore, from analyzing all of the possibilities, the best option is to look at what individual factors of a car can help reduce car emissions and global warming. This research focuses on how consumer preferences can affect the CO2 emissions emitted from the vehicle like manufacturer, model, and transmission. The aim is to focus on the most mainstream features and choices that people make while buying a car. By focusing on the most popular features, the results can relate more to the audience rather than just car enthusiasts. The features include Manufacturer, Model, Transmission, Manual or Automatic, Engine Capacity, Engine Power, Power Train, and Noise Level. Data from the cars can be accessed through datasets found online.
Methodology
The dataset is imported from Kaggle, including data on European cars solely containing 44 unique features per unit. Focusing on one region first like Europe will allow us to focus on the types of cars manufactured in that certain area only as some cars can be manufactured differently based on the region.
However, we use a select few, 11 to be precise (Table 1). The reason for this significant cut of data was that the data set contains a substantial amount of null values in some columns.
| Variable | Variable Type | Data Type | Description | Number of Uniques? |
| Manufacturer | Feature | string | The manufacturer of thecar | 34 |
| Model | Feature | string | The name of the car model produced by themanufacturer | 253 |
| Transmission | Feature | string | The component that turns the engine’s power intosomething the car can use | 34 |
| Manual or Automatic | Feature | string | Whether the car needs to change gears manually orautomatically | 2 |
| Engine Capacity | Feature | float | How much fuel the car canhold | 82 |
| Engine Power (Kw) | Feature | float | The maximum energy theengine can put out | 152 |
| Powertrain | Feature | string | The type of engine that operates the car ex.Internal Combustion orElectric | 5 |
| WLTP Imperial Combined | Feature | float | WLTP test with all speedlimits accounted | 272 |
| WLTP CO2 | Feature | float | Total emissions from theWLTP test | 214 |
| Emissions CO [mg/km] | Feature | float | Carbon emissions fromcars | 3 |
| Emissions NOx [mg/km] | Feature | float | Nitrous oxide emissionsfrom cars | 70 |
| Noise Level dB(A) | Feature | float | How loud the car is | 53 |
| low | Class Label | string | Low Speed | |
| medium | Class Label | string | Medium Speed | |
| high | Class Label | string | High Speed |
Note: Different variables that are being compared. 14 exact. The Data type whether string or float and the number of unique values per variable
The columns Emissions CO [mg/km], Emissions NOx [mg/km], and WLTP (Worldwide Harmonized Light-Duty Vehicles Test Procedure) Imperial combined are the dependent variables and the rest are the independent variables. we assigned a number value to every unique string value of the strings column using a label encoding algorithm, and that converted the data from string to int because String data can not be analyzed through correlation analysis. The columns included Manufacturer, Model, Transmission, Manual or Automatic, and Powertrain. To complete the research and analysis, we needed to get rid of any electric vehicles from the data set because electric vehicles could tamper with the emission numbers for brands as they are electric so their numbers are 0 across the board. Therefore from the powertrain column, we eliminated any car that had the regular expression “electric” anywhere in this column, leaving us with only combustible engine cars. After all our data cleansing and transformation steps, we were left with 3,752 observations out of the original 4,761.
This methodology involved pre-processing, transformation, training, and testing to analyze emissions data from vehicles. The pre-processing started by loading vehicle data from a CSV file and cleaning it, such as removing irrelevant columns and filtering data to exclude incomplete or zero values. The filter focuses on specific powertrain types like electric, hybrid, and diesel engines.
Pre-processing filters data, such as the elimination of electric cars or any other that can tamper with analysis. Transformation is carrying out the actions and transforming the data. Training is analyzing the data individually and comparing it to dependent variables.
Once cleaned, the dataset was split into string and numeric columns. String columns like “Model” and “Manufacturer” is encoded using a LabelEncoder, converting categorical data into numeric labels. The reason the conversion between categorical and numerical was necessary for the CO emissions column was the data from that column on the data set was provided in string format. Since the data was numbers in a string format, the same process would still have worked for the other columns as there were many unique values which were then categorized into “low,” “medium,” and “high” levels based on percentiles of the “Emissions CO [mg/km]” column. The percentiles were split into 3 sections with low being under 25%, medium being between 25% and 50 %, and high being above 50%.
Two data frames, ave_val_fin, and ave_val_fin_mod, were created to calculate the average emissions per manufacturer and model, respectively. Afterward, a Random Forest Classifier is trained to predict the emissions level (“low,” “medium,” or “high”). The data was split into training and testing sets, and the model’s performance was evaluated using precision, recall, and F1-score metrics.
A Random Forest Classifier is an ensemble learning method that builds multiple decision trees during training and merges their predictions (using averaging for regression or majority voting for classification) to improve overall accuracy and reduce overfitting. It leverages the concept of bagging (bootstrap aggregation) and feature randomness to create a diverse set of trees, making it robust against noise in the data. Compared to a single decision tree, it is superior because it mitigates overfitting and provides more stable and generalizable predictions. Additionally, it handles high-dimensional data effectively and can assess feature importance, making it versatile for various tasks. Finally, the Random Forest Classifier is transparent and much better at reducing bias compared to other ML methods7.
Random Forest Classifier calculated feature importance to determine the attributes that have the highest impact on the model’s predictions. Finally, the code outputs these performance metrics, helping to assess the effectiveness of the model in predicting vehicle emissions based on various features.
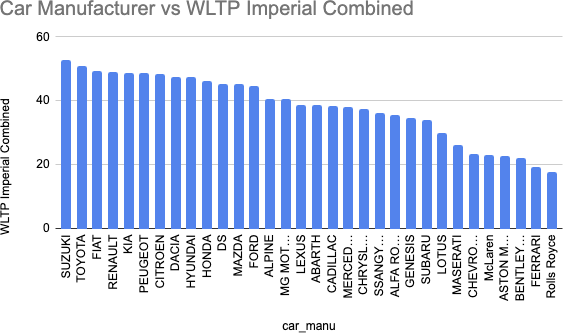
In the analysis of the data, we used 3 dependent: Emissions CO [mg/km], Emissions NOx [mg/km], and WLTP (Worldwide Harmonized Light-Duty Vehicles Test Procedure) Imperial combined. The Emissions CO [mg/km] and Emissions NOx [mg/km] columns were total emissions for the carbon monoxide and Nitrogen oxide gasses- while the WLTP Imperial Combined uses an average of the emissions outputted at different speeds and outputs and compares that with CO2 emissions therefore having a higher number refers to a better, more fuel-efficient vehicle.
Results
The use of the Random Forest Classifier is due to its ability to evaluate feature importance with high accuracy even with missing data making it a transparent library. Random Forest Classifier, like other libraries, has many important sub-functions for data analysis. In this case, we use the correlation analysis in the Random Forest Classifier. The table below shows a correlation measurement number related to emissions. In regards to the missing data, if there were missing inputs on sections that were being analyzed, the whole entry would be removed so then it wouldn’t interfere with any results.
| Engine Capacity | 0.226292972 |
| Emissions NOx [mg/km] | 0.149964967 |
| Manufacturer | 0.123039447 |
| Engine Power (Kw) | 0.118600243 |
| WLTP Imperial Combined | 0.1104343 |
| Noise Level dB(A) | 0.072028554 |
| WLTP CO2 | 0.071302195 |
| Model | 0.06649718 |
| Transmission | 0.052020511 |
| Manual or Automatic | 0.010359851 |
Note: RandomForestClassifier gives feature importance rankings as they output the decimal amount of importance that each feature has on the dependent variable, which in this case is Emissions CO. Random Forest Classifier is calculated by averaging the decrease in impurity (like Gini impurity) caused by each feature across all the decision trees in the forest.
From this data, we can decipher that Engine Capacity has the largest correlation to CO2 emissions. Each column was analyzed to identify the most and least environmentally friendly vehicles based on CO emissions, NOx emissions, and WLTP Imperial combined ratings. A detailed overview of all significant findings can be found in Table II.
Discussion
According to the data studied, engine power is strongly associated with CO2 emissions. However, the data did not reveal a definitive relationship between engine power and emissions due to variability influenced by driver behavior. How a driver drives is also very important. Many cars are equipped with sports mode or eco mode, either worse or better for fuel efficiency. Aggressive driving styles, characterized by rapid acceleration and frequent braking, can increase emissions by 20% to 40% compared to calmer driving behaviors. Additionally, novice drivers have been observed to produce 17% and 29% higher mean NOx and PM emissions, respectively, compared to experienced drivers8. All that is being said is that a correlation is present which is more powerful cars emit for CO2 but the variability in the results from driver to driver is too substantial to create a conclusion.
On the other hand, Engine capacity has the strongest correlation and there is substantial evidence to back it up. The correlation between them 2 is that the greater the engine capacity, the more CO2 is emitted9.
In terms of environmental friendliness, automated transmissions perform better than manual ones across a range of emissions criteria. This is because in automated transmissions the cars know when to switch gears and therefore when speeding up reduces power on the engine. On the contrary, manual transmissions need human prompting which could result in unnecessary power in the engine eventually leading to more emissions. Automatic cars have an efficient methodology that allows the car to use less power but be more fuel efficient therefore explaining the difference between the two10.

Note: The Emissions NOx column accounts for the average of all the models in the data set for each manufacturer.
Based on the analysis, Toyota, Honda, and Suzuki consistently ranked high in emission efficiency across multiple metrics for example, in the manufacturer categories for all 3 tests. In addition to the manufacturer tests, these 3 car brands also ranked high in the model tests for all 3 emission tests. In contrast, sports car brands such as Ferrari, Rolls Royce, and McLaren consistently rank low in emission efficiency, as seen in Figures 1 and 2. Therefore, through analysis of every specific car model, we were able to see that sports cars were the least emission-efficient car type/brand out there. Overall, this data varied significantly among automobile models and manufacturers. However, the data points to the preference for hybrid powertrains and automatic gearboxes when it comes to lowering vehicle emissions.
What are possible solutions to this? It is very difficult to control human preference as everyone wants to own a Ferrari or a supercar in their life. However, we can challenge this issue of global warming simply through our driving habits. As seen through the engine power correlation with CO2 emissions, aggressive drivers emit a substantial amount more CO2 emissions than safe drivers. Therefore the practice of safe driving could lower CO2 emissions on top of obviously the car that one buys.
Conclusion
As we can see from the results and discussion, consumer preferences regarding manufacturers and car brands do play an effect on car emissions. Since the data set was based in Europe, the next step is to analyze data from other manufacturers located in different geographies. Different regions in the world have different car brands, models, transmissions, etc but which region is the most fuel-efficient? Do the most efficient brands stay relatively the same for all regions? Why or why not? These are questions to be researched in future studies building off of this one. Everybody wonders what they can do to help out their world but do people have the integrity to do it? Will you buy a Toyota over a Ferrari to save the world?
Acknowledgments
Thank you for the guidance of Patrick Houlihan from Columbia University in the development of this research paper.
References
- Sengupta, Somini, et al. “Climate Change Is Speeding Toward Catastrophe. The Next Decade Is Crucial, U.N. Panel Says.” The Washington Post, 20 Mar. 2023, https://www.washingtonpost.com/climate-environment/2023/03/20/climate-change-ipcc-report-15/. Accessed 19 Dec. 2024. [↩] [↩]
- Ritchie, H., & Roser, M. (2020). CO2 emissions from transport. Our World in Data. https://ourworldindata.org/co2-emissions-from-transport [↩]
- IEA (2024), Global EV Outlook 2024, IEA, Paris https://www.iea.org/reports/global-ev-outlook-2024, Licence: CC BY 4. [↩] [↩] [↩]
- Hu, Zhemin & Tafazzoli Mehrjardi, Ramin & Ehsani, Mehrdad. (2023). On the Lifetime Emissions of Conventional, Hybrid and Electric Vehicles. 1-6. 10.1109/TPEC56611.2023.10078609. [↩]
- Mateev, M., & Mateeva, R. (2018). Evaluation of the impact of logistic processes on CO2 emissions in Bulgarian transport. MATEC Web of Conferences, 207, 02007. https://doi.org/10.1051/matecconf/201820702007 [↩]
- Geng, Y., Zhang, P., Wang, Z., & Zhang, X. (2022). Life cycle carbon footprint and energy optimization of new energy vehicles in China. Energies, 15(7), 2703. https://doi.org/10.3390/en15072703 [↩]
- “sklearn.ensemble.RandomForestClassifier.” scikit-learn: Machine Learning in Python, version 1.5,scikit-learn.org,https://scikit-learn.org/1.5/modules/generated/sklearn.ensemble.RandomForestClass ifier.html. Accessed 19 Dec. 2024. [↩]
- Almutairi, Sultan M., et al. “Impact of driving behavior on vehicle emissions and fuel consumption: A comprehensive review and analysis.” OPSEARCH, vol. 60, 2023, pp. 555–583. Springer, doi:10.1007/s12351-023-00798-2. Accessed 19 Dec. 2024. [↩]
- Yusoff, S., Hashim, H., & Tan, Y. S. (2020). Toward sustainable transportation and logistics: Review of environmental impacts and supply chain management strategies. Sustainability, 12(17), 6919. https://doi.org/10.3390/su12176919 [↩]
- U.S. Department of Energy. “FOTW #1127, March 30, 2020: Since Model Year 2016, Automatic Transmissions Have Surpassed Manuals in Fuel Economy.” Energy.gov, 30 Mar. 2020, www.energy.gov/eere/vehicles/articles/fotw-1127-march-30-2020-model-year-2016-automatic-transmissi ons-have. Accessed 18 Dec. 2024. [↩]


