
Abstract
In the remote regions of Northern Tanzania, women and children of the Maasai Tribe Walk nine hours a day to collect water for their families. Over four years, the collaborative efforts with the Maasai communities have led to the installation of four water harvesting units, enhancing the local socio-economic conditions by facilitating educational opportunities and economic pursuits for over 4,500 individuals within a 10-mile radius. This project presents a novel approach to addressing this issue by integrating satellite data and image classification to identify densely populated areas marked by uniquely shaped Maasai homes lacking a water supply and planning the best placement of rainwater harvesting units. The backbone of this project was developing an image classification model trained on 10,000 hand-selected satellite image samples of Bomas. This model generated a density heat map, enabling the strategic placement of water harvesting units in the most critical locations to maximize impact. Our findings underscore the potential of satellite technology in humanitarian interventions, particularly in harder-to-reach areas where traditional surveying and data collection techniques are impractical.
Introduction
Background and Context
According to the United Nations, one in four people cannot access clean water1. One such community is the Maasai in the Monduli District of Tanzania. They walk over nine hours daily to fetch water and face climate change and land deforestation challenges2. Floods and droughts are more frequent and severe, and traditional water sources, such as rivers and springs, dry up. Annual rainfall in Tanzania is equal to or higher than in the US, yet they face challenges in accessing water. The community has been deploying water harvesting units along the main highway, which currently helps less than 4000 people, but only during the rainy season. The impact of one water harvesting unit has been validated. The challenge is that over 30,000-40,000 Maasai live across hundreds of square miles without highways and infrastructure like electricity or water. A better technique needs to be identified to assess the living locations, the density, and pick the right water harvesting solution that balances cost, ease of deployment, and sustainability. This paper takes the first step in identifying the living locations across hundreds of square miles using satellite images, machine learning, and image classification models. If this approach has high precision, it can be expanded to many regions for water resource planning and management opportunities. There is a need for sustainable water management solutions to support communities like the Maasai and other areas of Africa.

The first water harvesting unit of 100K liters directly impacted the community. Specifically, kids have started coming to school more often, and there is higher enrollment of students. Women have seen reduced walking time to fetch water and use the extra time for social, agricultural, and economic activities and reduced walking from nine to two hours a day (Fig 1).
Given the impact, multiple additional projects have been executed, including deploying a 30+K liter water harvesting unit serving the Nanja village. Additionally, a water filtration system in Engirgiri sanitizes water collected in man-made ponds in the area.
Problem Statement and Rationale
The primary concern was to support 30,000-50,000 Maasai, identifying the best places to place rainwater harvesting units across 300-500 square miles. Ideally, the best water harvesting solutions would be based on the population’s density distribution and nearby available water resources. However, the government does not provide accessible maps of the Maasai’s location. So, to design and plan solutions at scale, satellite images and image classification helped to create a map of Maasai dwellings and validate the maps with local community involvement. The next step would be identifying the best locations for placing the water harvesting solutions.
Scope and Limitations
The study will be limited to a selected area of about 250 sq. miles. In addition, limited modifications will be made to the base computer vision algorithm. These limitations enable a rapid iterative process to be used to finalize the correct training data and algorithms. There are also other limitations in the data being used.
Unique Structure and Materials of Bomas

Due to their polygamous nature, familial groups live together in large units called “Bomas.”
A Boma is a unique structure that is difficult to classify. There is no precise size to a Boma, but it usually consists of multiple small huts and a section for keeping goats and cows safe at night. A few characteristics define a Boma: an outer barrier, traditionally made from rough bushes, trees, or other structures, such as shelters inside. At the center will be a smaller circle, also created with bushes, where cattle stay. These Bomas can house 10 to 50 people and sometimes appear square or in other shapes. Another issue is the contrast of the bushes with the environment, sometimes not showing up in typical color imagery (Fig 2). As a result, hyperspectral or infrared imagery is utilized due to its ability to differentiate between vegetation and soil.
Literature Review
This section reviews related works for deep learning methods for classifying remote sensing satellite images. Classification of remote sensing images using machine learning is challenging because images are characterized by multi-resolution, heterogeneous appearance, and multi-spectral channels. Convolutional neural networks have a lot of limitations, including quality assurance of inputs, false negatives, overfitting, and the complicated nature of hyperparameters. Recent remote sensing and deep learning research has explored various methods for analyzing and classifying satellite images. Three research papers are included below to explain the range of methods but are not comprehensive. G. Richardson et al (2023)3 focused on mapping lichen to support caribou conservation efforts using machine learning models. They trained a dense neural network to map lichen coverage, achieving an accuracy based on Sentinel-2 imagery and UAV data from 20 sites in Québec and Labrador. The data was processed using Pix4D and Google Earth Engine. The model used 10-meter resolution maps and minimized spatial autocorrelation with a blocking strategy. The best-performing model, a dense neural network with an R2 of 0.76, was trained with the Adam optimizer, and overfitting was avoided with early stopping.
G. Liu et al. (2024)4 proposed STransU2Net for building extraction from satellite imagery using a hybrid approach that combines Convolutional Neural Networks (CNN) and Transformer architectures. CNNs are effective for capturing local features but struggle with more significant buildings, while Transformers are better at capturing global context but not small buildings. STransU2Net overcomes these limitations by integrating both models and adding advanced features like Bottleneck Pooling Blocks (BPB) and Channel And Spatial Attention Blocks (CSAB) to preserve edge information and focus on essential features. The model was trained on two datasets, achieving impressive results, with 91.04% IoU on the Aerial imagery dataset and 59.09% IoU on the Satellite II dataset. Combining local feature extraction (CNN) and global context modeling (Transformer) made building segmentation tasks more efficient and accurate. Mark Chern (2020)5) explored deep learning for satellite image classification, specifically using Convolutional Neural Networks (CNNs) to detect objects in satellite imagery. Their system was tested on the IARPA Functional Map of the World (fMoW) dataset, which includes large-scale, multi-spectral satellite images. The model successfully classified objects into 63 categories with 83% accuracy and an F1 score of 0.797. The study highlighted challenges in preprocessing satellite images, such as cloud cover, resizing that lost essential details, and the limitations of labeled satellite datasets. By integrating metadata with image features, the system improved accuracy and managed false detections effectively.
The above techniques were not implemented explicitly. This project used data augmentation of the training data, and the method is detailed in the following sections.
Image Processing Pipeline
Model Database (20) Resource Provisioning Unit (50)

The image processing pipeline illustrated in the diagram (Fig 3) is centered around detecting and clustering dwellings from satellite image data to support resource provisioning. The process begins with a Satellite Image Database (Fig 3:05) that stores raw satellite images (Fig 3:03) and associated metadata (Fig 3:04). These images are divided into training data (Fig 3:02A) and validation data (Fig 3:02B), which are processed by an Input Processor (Fig 3:10) to prepare the dataset for model training. The Model Generator (Fig 3:11) creates a detection model (Fig 3:12) using parameters (Fig 3:21) and weights (Fig 3:22) stored in the Model Database (Fig 3:20). This trained model is then used to analyze the images and extract dwelling locations (Fig 3:41), including associated geographical data (Fig 3:42) and timestamps (Fig 3:43).
Once dwelling locations are identified, the data is further refined through a Clustering Process (Fig 3:16) to group dwellings into clusters (Fig 3:45), which are stored in a Dwelling Database (Fig 3:40). The clustering process helps identify patterns or group dwellings based on proximity or other relevant factors, which can be analyzed temporally using the Temporal Analyzer (Fig 3:54). This clustered information is then utilized by the Resource Provisioning Unit (Fig 3:50), which includes components like a Water Consumption Estimator (Fig 3:51) and a Water Unit Calculator (Fig 3:52). These tools enable precise calculation and allocation of water resources to dwelling clusters, guided by resource instructions (Fig 3:44) considering their specific geographical and temporal requirements. The pipeline is designed for efficient resource allocation by leveraging satellite imagery and advanced machine learning models.
Techniques Considered
In evaluating three different methods for this project, the computer visions considered were YOLOv7, OpenCV, and TensorFlow. YOLOv7, though highly optimized for speed and accuracy with minimal background detection errors, presented significant challenges. It proved difficult to integrate with Jupyter notebooks6. It performed inadequately with objects of varying sizes and shapes—critical for this project—and suffered from limited community support7, maintained by a small team. While boasting extensive community support and customizable settings, OpenCV was deemed overly complex, featuring a steep learning curve8.
Conversely, TensorFlow appeared as the optimal choice, balancing accessibility as an open-source tool and compatibility with Python and JavaScript, which is crucial for integrating with Google Earth Engine (GEE). Despite its higher resource consumption and slower performance, TensorFlow’s regular updates and new features make it the most suitable framework. It provides the necessary tools and support for successful project execution.
Objectives
This research project aims to optimize the placement of water harvesting solutions based on population density and natural water sources. A population density map would be generated, using satellite data to detect these uniquely shaped Bomas across selected regions. This data will help identify critical locations for deploying the appropriate water solutions. The options for enhancing water accessibility include large units for housing groups, such as installing communal rainwater harvesting units to serve large groups of Bomas and creating larger-scale rainwater collection systems, such as ponds or dams, to benefit entire communities, especially in more densely populated areas.
Methods
Data
Two different sources were considered for the training data. One was the Copernicus Institute website for the Copernicus Satellites and Google Earth Engine (GEE). GEE was the better option because writing a script to generate the training data from just a few points on a map was easier.
Collection
2000 photos of Bomas and 500 photos of the environment (Omits a Boma) was the first iteration of training data. The training accuracy was around 30%, far below the required standards. The model needed help with a few problems. First, The color of the Boma circle blended in too well with the environment. Second, There wasn’t enough data to train the AI.
Augmentation
A key insight employed was the fact that these images could be superimposed, meaning they could be rotated and flipped to create more training data for the model. Using this new information, 6,000 more photos of Bomas and 1500 more images of the environment were generated. With this new model trained at 10,000 images, the accuracy skyrocketed to 92.1%. Because these “Bomas” are often disguised and varied, more training would not increase the accuracy further. The model plateaus with the current constitution at a certain point due to the extreme shape, color, and size variation. Toggling with filters, cropping, grayscale, or increasing the contrast did not impact the accuracy. Perhaps more fine-tuning is necessary, but it’s unlikely to change performance significantly.
Model Training


The model architecture is a straightforward Convolutional Neural Network (CNN) designed for image classification. The input images, resized to 100×100 pixels with three color channels (RGB), undergo a series of transformations through
the network. A rescaling layer normalizes the pixel values between 0 and 1 to standardize the input data. Three convolutional layers with ReLU activation extract features such as edges and patterns, particularly those indicative of circular or closed shapes resembling the structure of a Boma. MaxPooling layers follow each convolutional layer, reducing the dimensionality of the feature maps and focusing on the most prominent features. The resulting feature maps are then flattened into a one-dimensional vector and passed through two dense layers, with the final dense layer outputting logits for classification into two categories: “boma” or “not boma.” (Fig 4)
The model was trained on 10,064 images, with 8,052 images used for training and 2,012 for validation, using a batch size of 32. The training was performed over 15 epochs (Fig 5), with the Adam optimizer and Sparse Categorical Crossentropy as the loss function. The model achieved a steady improvement in accuracy and loss during training, plateauing around epoch 12-14 (Fig 6).
Model Testing
The model’s training and validation performance indicate effective learning but also highlight areas for refinement. After 15 epochs, the training accuracy reached 98.5%, while validation accuracy plateaued at 92.1%. The corresponding validation loss also stabilized, reflecting a good fit to the data without significant overfitting. A plot of training accuracy over epochs demonstrates consistent improvement, while the validation accuracy remains slightly lower, indicating room for further optimization. Training loss reduced significantly during the first few epochs before leveling off, with a similar trend observed in the validation loss. These results suggest that while the model generalizes well, there may be opportunities to fine-tune hyperparameters or explore additional regularization techniques to improve validation performance further.
Model Performance
| Predicted: Boma | Predicted: Not Boma | Total | |
| Actual: Boma | 112 | 55 | 167 |
| Actual: Not Boma | 104 | 1741 | 1845 |
| Total | 216 | 1796 | 2012 |
The model demonstrated overall solid performance, achieving an accuracy of 92.1% on the validation dataset. However, the confusion matrix reveals class specific strengths and weaknesses: the model correctly classified 1,741 “notboma” images while misclassifying 104 as “boma.” For the “boma” class, it correctly identified 112 images but failed to recognize 55, leading to an imbalance in classification metrics. The precision for the “boma” class was 51.9%, indicating a relatively high rate of false positives, while the recall was 67.1%, showing the model effectively captured most “boma” instances. The F1 score of 58.5% reflects this trade-off between precision and recall. These results suggest that while the model is a good baseline, further improvements could focus on increasing precision, potentially through strategies like data augmentation, addressing class imbalance, or refining the architecture.
Spatial Coordinate Extraction
Google Earth Engine (GEE) enables an image processing technique called “Image Stacking.” Typically, these stacks would allow users to perform time-series analysis, detect trends, and monitor environmental changes using satellite imagery and other geospatial data. However, there is a lesser-known technique in which the user “squashes” the highest-resolution sections together to generate exceptionally high-resolution content to read. This can be useful, especially for filling holes in scanning, removing lower-resolution mapping, or avoiding cloudy content.
A specified sample of the Monduli district of just over 260 square miles was chosen (Fig 7) and it was isolated for recent times in the last four weeks (2024- 02-01 to 2024-02-29). The images were manually isolated with no cloud coverage over the selection area.

All bands greater than 10-20 meters per pixel were filtered out of the image stack. For Copernicus/S2_Harmonized, those included [’B2’, ’B3’, ’B4’, ’B5’, ’B6’, ’B7’, ’B8’, ’B8A’, ’B11’, ’B12’] (Fig 8). Then, the images were layered according to the variable importance GEE provided (Fig 9). An image stack was created of all collected wavelengths of color light.


The image stack was seperated into slices run individually through the model (Fig 4). The final image stack was 10980 pixels by 10980 pixels. To classify some of these Bomas accurately, the samples overlapped by a 20-pixel overlap in both the horizontal and vertical directions for edge cases where a Boma would be too far into the border and missed by either selection.
Results
It took over 4 hours to run the model discussed in section 2.2 over the selected area of 260 square miles on GEE. Everywhere the confidence of the model was above 80%, the coordinates of that point were recorded (Fig 10). Figure 10 displays a dot for each recorded sample plotted out by relative coordinate. In total, the model classified 488 Bomas over the selected area. The relative coordinates were transposed on top of the image stack of the designated area generated in section 2.5 (Fig 11). Figure 11 displays all the classified Bomas relative to Nanja Dam (natural reservoir).


Discussion
Key Findings
It is evident that large populations seem to live in dense communities of several dozen Bomas (A, B, F, J, K). They also live in lines along the edges of major geological formations such as dried riverbeds or reservoirs (C, E, G). In addition, it also looks like many communities reside parallel to the major highway that runs through the area (H, I). This information can be used to isolate large communities and identify the best locations for rainwater harvesting solutions (Fig 12).
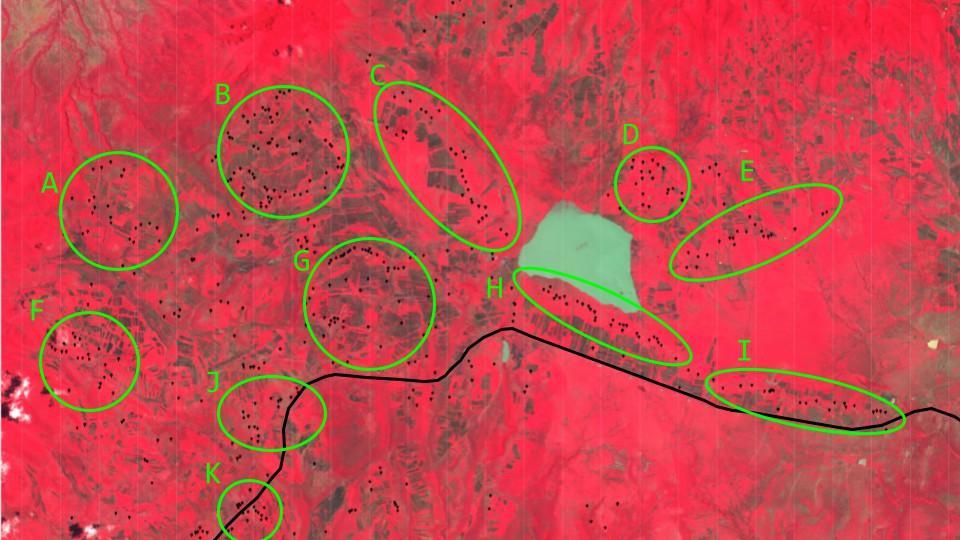
Larger groups, especially those further away from the Nanja Dam, such as A, B, and F, are this project’s starting point, and identifying locations within these more prominent groups to place these water harvesting solutions is the next step.
Limitations of Outputs
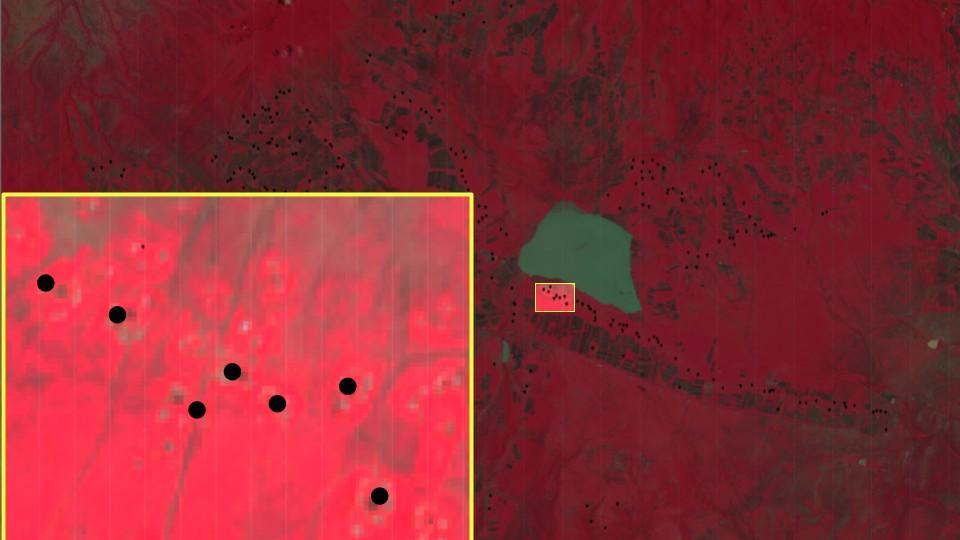
As you can see in the zoomed-in photos, the images streamed to the web editor are of very low quality from the perspective of the GEE editor. However, there are noticeable patterns where the model “identified” Bomas (Fig 13). A quick look at the coordinates in Google Maps (with higher resolution but dated images) shows that at least a couple of these points seem to be housing units. However, many Bomas seem not identified (Fig 14), or only large, easily identifiable with thick or dark boundaries are identified.

In addition, the training data may have caused some of these inaccuracies. The dataset was very unbalanced, with 75% of the data being photos of Bomas and only 25% of the data being photos of the environment. The model may have been more accurate with a more balanced training set.
Implications and Significance
Maps like these can be used in numerous contexts, especially in other humanitarian efforts. Now that the population locations are better understood, the data can be used to structure other initiatives, like drone-based medical delivery, better road systems, or the locations of medical facilities. Other organizations, or even the Tanzanian Government, could use this data to understand better where their Indigenous populations are located. For instance, temporal satellite data analysis can identify migration patterns in other nomadic tribes, especially to warn said tribes of dangerous events like flooding or landslides.
Ground Truth Validation
The outputs’ results are being validated with the local Maasai community (a formal group of Maasai members from across the region). To simplify validation, geo-tagged pictures taken by volunteers on the ground will be cross-referenced with the outputs from the model, providing an estimate of the physical accuracy of the model.
Community Involvement
With the validated data, the next step is to segment the map into high-density, medium-density, and low-density clusters. Identifying the best possible water access solutions is based on the size and area of the clusters.
Three types of deployment solutions are being evaluated with the community. The first is a low-cost solution of 5000-liter tanks with rainwater harvesting at a Boma. This applies to distant Bomas, which are not close to any significant water access location. The second is a sizeable 100,000-liter water harvesting solution deployed for a set of Bomas together that will be helpful for large density/medium-density regions. The third is a man-made pond/small lake where rainwater collects, and a solar-powered pump and filtration unit provides clean water access.
One of the core principles of ensuring long-term sustained impact and ownership is to empower and enable the local Maasai community to pick these solutions and invest their time in the planning, deployment, and ongoing maintenance. With over 480 Bomas and 50000 Maasai, establishing a more structured Water Council that takes accountability for equitable water use and ongoing maintenance will be crucial. This work is done with Maji Wells [Mbayani Tayai, local Maasai leader] and other local community leads.
Conclusion
This study has demonstrated the potential of integrating advanced satellite imagery analysis with traditional water management practices to significantly enhance water accessibility for the Maasai communities in Northern Tanzania. By employing TensorFlow in conjunction with Google Earth Engine, a model was developed that identifies populations. These maps can optimize water solution placement, tailoring solutions to the region’s unique geographical and social structure. A mix of individual and communal rainwater harvesting units is being built in or near the locations. Future efforts should focus on refining the models’ predictive accuracy by in corporating more diverse data sets and real-time environmental monitoring. Additionally, exploring partnerships with local governments and international organizations will be crucial in scaling these solutions to other similarly affected communities globally. By continuously blending technology with traditional knowledge, more resilient communities can be better equipped to manage their natural resources sustainably.
Acknowledgement
We thank Ananya Rao (Carnegie Mellon University) for mentoring and supporting this project, and Mbayani Tayai for validating ground truths in Tanzania.
References
- UnitedNations. Global Issues: Water. 2021. url: https://www.un.org/ en/global-issues/water [↩]
- Roshan Taneja, Yuvraj Taneja, and Mbayani Tayai. “Evaluating the Impact of Water Harvesting for 4500+ Maasai in Communities in Monduli District, Arusha, Tanzania”. In: National High School Journal of Science (NHSJS) (Oct. 2024). Accessed: 2024- 11-01. url: https://nhsjs.com/2024/evaluating-the-impact-of-water-harvesting- for- 4500- maasai- in- communities- in- monduli- district- arusha-tanzania/ [↩]
- G. Richardson et al. “Dense neural network outperforms other machine learning models for scaling-up lichen cover maps in Eastern Canada”. In: PLoS ONE 18.11 (2023). Accessed: 25 Nov. 2024, e0292839. doi: 10 .1371 /journal. pone.0292839. url: https://research.ebsco.com/linkprocessor/plink? id=21a96e6b- e83c- 3406- 8d8b- f8226382537c [↩]
- G. Liu et al. “STransU2Net: Transformer based hybrid model for building segmentation in detailed satellite imagery”. In: PLoS ONE 19.9 (2024). Accessed: 25 Nov. 2024, e0299732. doi: 10 . 1371 / journal. pone . 0299732. url:https://research.ebsco.com/linkprocessor/plink?id=9dffa5b1- 6f63-3824-95ad-a20489f67fdf [↩]
- Mark Chern Gary Pritt. “Satellite Image Classification with Deep Learning”. In: arxiv (2020 [↩]
- Adekanmi Adeyinka Adegun et al. “State-of-the-Art Deep Learning Methods for Objects Detection in Remote Sensing Satellite Images”. In: Sensors 23.13 (2023). issn: 1424-8220. doi: 10.3390/s23135849. url: https://www. mdpi.com/1424-8220/23/13/5849 [↩]
- Sandeep Kumar Deepthi S and Dr. Suresh L. “Detection and Classification of Objects in Satellite Images using Custom CNN”. in: IJERT 10.3 (2021). issn: 2278-0181 [↩]
- Austen Groener, Gary Chern, and Mark Pritt. “A Comparison of Deep Learning Object Detection Models for Satellite Imagery”. In: 2019 IEEE Applied Imagery Pattern Recognition Workshop (AIPR). 2019, pp. 1–10. doi: 10.1109/AIPR47015.2019.9174593 [↩]


