
Abstract
Post-IPO volatility remains poorly understood despite extreme first-day returns averaging 36% and standard deviations exceeding 55%. As of April 2026, prior AI research has not addressed post-IPO volatility prediction. Existing machine-learning and deep-learning studies largely target pre-listing underpricing and first-day outcomes, while LLM applications remain concentrated on prospectus sentiment analysis and adjacent financial tasks, leaving the trajectory, timing, and magnitude of post-IPO price paths largely unmodeled. This study addresses that gap by evaluating three deep-learning architectures – Mixture-of-Experts (MoE), LSTM, and Transformer – alongside three LLMs – Gemini 3.1 Pro, ChatGPT-5.4 Reasoning, and Grok-4.20 Reasoning – under a matched restricted-context forecasting task. Using only the first five post-IPO trading days as observed input, all models were benchmarked on their ability to predict the timing and magnitude of the post-IPO peak over the first post-IPO month window. The analysis focuses on the U.S. IPOs issued during the March 2022–September 2023 M2-contraction period and also reveals a pattern not reported in prior literature: during M2 contraction, stocks that rise above the IPO price and then decline outnumber those that continue appreciating. This distinctive distribution merits further investigation. Results show that MoE was the strongest deep learning model overall. Transformer outperformed LSTM on peak-magnitude prediction, whereas timing remained harder across all deep learning architectures. Prompt-based LLMs were competitive on the same holdout and often stronger in peak-magnitude forecasting. These findings suggest that early post-IPO price behavior contains predictive signals under M2 contraction and that prompt-based LLMs can be meaningfully benchmarked against specialized deep learning models.
Introduction
Post-IPO Volatility and Its Diverging Trends Associated with M2 Liquidity
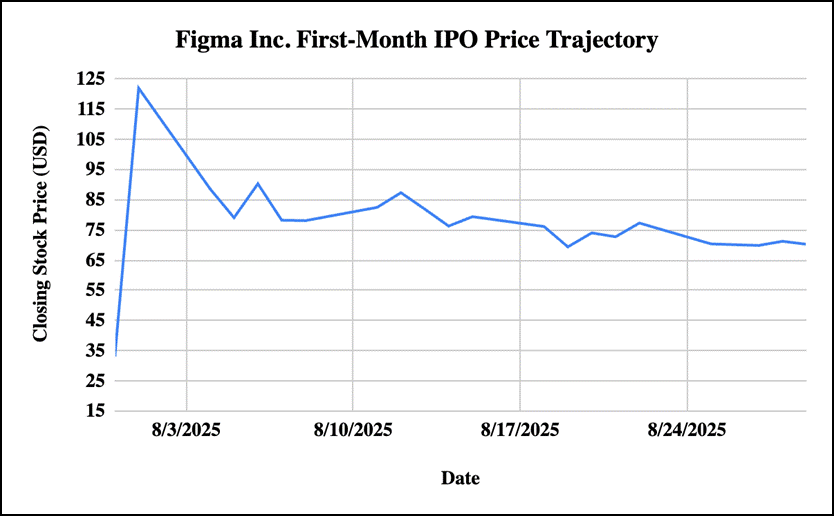
Post-IPO volatility remains a persistent financial puzzle, with newly public companies showing extreme price swings averaging 36% first-day returns (reaching 65% during bubbles1, standard deviations exceeding 55%2, and half of IPOs trading below debut prices by session two3. Traditional explanations, information asymmetry, institutional behavior, and market timing inadequately explain contemporary patterns as demonstrated by cases like Figma’s 250% first-day surge and subsequent volatility4.
Existing machine-learning and deep-learning studies have largely focused on pre-listing underpricing5, first-day IPO outcomes6, and broader stock-movement or IPO-estimation tasks, typically using single-modal or multimodal deep learning (DL). These DL models demonstrate significant improvements over traditional methods7. In the stock movement prediction sector, key developments include LSTM networks reaching 2.72% MAPE rates8 and Transformer models outperforming encoder-decoder variants9. In the IPO prediction sector, hybrid models integrate IPO prospectus text analysis with financial metrics to achieve 71.4% accuracy – surpassing Gemini and Llama models10.
Despite extensive research on AI-driven financial prediction, significant gaps remain in post-IPO stock forecasting. Existing studies predominantly fall into two categories: (1) first-day IPO performance prediction using traditional machine learning methods6, such as recent multi-modal approaches targeting only listing-day prices7, or (2) advanced AI applications for general stock prediction without specific consideration of post-IPO dynamics11,12. Critically, no existing studies employ deep learning or large language models to predict post-IPO volatility patterns. Especially, LLM applications remain concentrated on prospectus sentiment analysis and adjacent financial tasks, leaving the trajectory, timing, and magnitude of post-IPO price paths largely unmodeled.
Furthermore, current research typically treats macroeconomic variables as predictive features rather than as sample selection criteria. Studies generally select IPO samples based on geographic location, exchange listing, time period constraints, firm characteristics, and data availability, without explicitly accounting for underlying macroeconomic conditions13,14. Notably, no prior research has examined the relationship between M2 money supply trends and post-IPO stock performance, despite the theoretical importance of liquidity conditions in shaping market dynamics. This gap motivates the present study’s focus on M2-based period segmentation and its impact on post-IPO volatility patterns.
Research Objective
This research assesses the feasibility of using deep learning models and large language models to predict post-IPO peak timing and peak magnitude in the U.S. financial market during the March 2022–September 2023 M2-contraction period. During this period, stocks that rose above their IPO price and then declined were more prevalent than stocks that continued appreciating over the available first post-IPO month window. Using the M2-contraction period as the focal market regime rather than as a proven causal mechanism, this study develops and evaluates deep learning and prompt-based LLM systems to determine whether the first five post-IPO trading days contain useful signal for forecasting post-IPO peak behavior.
Methodology
Overview
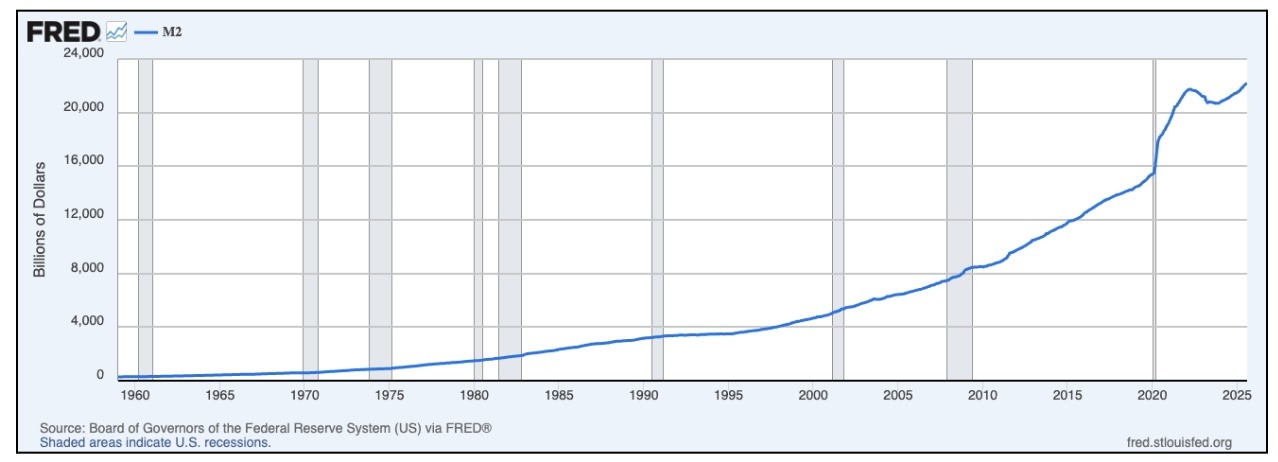
Four distinct market conditions were identified based on M2 money supply trends since 2000. The period from March 2022 to September 2023 was selected for deep learning model training and evaluation due to its unique post-IPO volatility pattern. During this post-pandemic era, stocks exhibited a distinctive trend: prices initially rose above the IPO price, then declined over time, with the minimum price consistently occurring after the maximum price (regardless of whether the minimum fell above or below the IPO price). This volatility pattern appeared predominantly during this period and was significantly less common under other market conditions.
Companies that went public under each of the four market conditions were systematically investigated and analyzed. From this analysis, a subset of companies from the M2 contraction period was selected to evaluate the capabilities of deep learning models and large language models in forecasting the timing and magnitude of peak prices during post-IPO price movements.
All data, including the raw stock data files, training codes for the DL models, prompts for LLMs, etc, are available at an external GitHub repository through the following link: https://github.com/Junbum-Cho/Post-IPO-Volatility-Predicting-DL-and-LLMs—Prompts-Codes-and-Docs.git
Computational Environment for Configuring the Deep Learning and LLM
| Name | Description |
| Google Colab (Colaboratory) | Google Colab (Colaboratory) is a cloud-based Jupyter Notebook environment that allows users to write and execute Python code in their browser. In this research, Google Colab was utilized to train and run the DL models. |
| Python | Python, a versatile programming language suitable for data science15 was used for the training and running of the DL model. |
| ChainForge | An open-source, visual programming environment for Prompt Permutations and Multi-Model Comparison of LLMs16. This platform was utilized to compare different LLMs’ performance in the prediction tasks. |
| ChatGPT-5.4 Reasoning, Grok-4.20 Reasoning, Gemini 3.1 Pro | Utilized as an API within the ChainForge environment, these three LLMs were utilized for this research. Model versions and parameter details are explained in section “Selecting an Optimal Inference LLMs for Standalone and LLM architectures”. |
| Macbook | A MacBook Pro (14-inch, 2021) equipped with an Apple M1 Pro chip featuring a 10-core CPU (8 performance cores + 2 efficiency cores), 14-core GPU, 16-core Neural Engine, and 32GB unified LPDDR5 memory running macOS 15.2 (24C101) was utilized for this entire research. |
M2 Money Supply as a Framework for Market Period Classification
M2 money supply was selected as the primary criterion for identifying distinct market periods due to its role as a consistent indicator of economic liquidity conditions17. While M2 liquidity does not flow directly into equity markets, it exerts a significant indirect influence on stock market dynamics through multiple channels18. M2 reflects both monetary policy interventions and money injection into the broader economy for circulation, thereby capturing the overall liquidity environment in which investors operate19. This liquidity base has been shown to exhibit a causal relationship with stock market behavior20, as changes in M2 influence investor risk appetite, capital availability, and valuation metrics21. For IPO markets specifically, M2 trends provide insight into the fundamental liquidity conditions that shape post-listing performance22, making it an appropriate framework for categorizing distinct market environments and their associated post-IPO volatility patterns23.
| Period | Description |
| January 2001 – January 2020 | This period was characterized by steady M2 growth without significant fluctuations. |
| January 2020 – March 2022 | This period was characterized by rapid M2 growth, primarily corresponding to the COVID-19 pandemic crisis. |
| March 2022 – September 2023 | Following the rapid M2 expansion, this period was characterized by a steady decline in M2 money supply. |
| October 2023 – June 2025 | Following the M2 contraction, this period exhibited a return to steady M2 growth at rates similar to those observed during 2001-2020. |
Obtaining the Post-IPO Stock Price Data
Choosing Stocks for Each Four M2 Money Supply Trends
For each identified M2 period, 16 representative stocks with solid fundamentals were selected, totaling 64 stocks across the four market conditions. The stocks were all found through the Yahoo Finance Platform: https://finance.yahoo.com. These stocks were then classified into the following types:
- Type 1: The price of the stock goes up above the IPO, but it reduces as time passes. The minimum price may be below or above the IPO, but it occurs after the maximum price.
- Type 2: The price of the stock goes up above the IPO and then continues to rise. The minimum price comes first, then the maximum price follows. Here, the minimum price is greater than or equal to the IPO.
- Type 3: The price of the stock goes down below the IPO, but later increases to go above the IPO. The minimum price precedes the maximum price, which is greater than the IPO.
- Type 4: The price of the stock goes down below the IPO and continues to stay below the IPO. The maximum price, which is lower than the IPO price, precedes the minimum price.
The following tables organize these stocks and their related information, including their classification types. When stock splits occurred, the IPO price was recalculated to a split-adjusted IPO price so that the IPO baseline remained on the same price scale as the post-IPO trading data used for analysis.
| # | Company | Type | Exchange | IPO Year | IPO Price (per share) | Maximum Price and Date | Minimum Price and Date |
| 1 | Alphabet (Google) | 2 | NASDAQ | 2004 | $2.1271 | 2004-09-172.93 37.75 % | 2004-08-192.39 12.36 % |
| 2 | Meta Platforms | 1 | NASDAQ | 2012 | $38.00 | 2012-05-1845.00 18.42 % | 2012-06-0625.52 −32.84 % |
| 3 | Netflix | 1 | NASDAQ | 2002 | $1.0714 | 2002-05-231.24 15.74 % | 2002-06-180.84 −21.60 |
| 4 | CrowdStrike | 2 | NASDAQ | 2019 | $34.00 | 2019-06-1979.79 134.68 % | 2019-06-1256.00 64.71 % |
| 5 | Shopify | 2 | NYSE | 2015 | $1.7 | 2015-06-174.21 147.65 % | 2015-05-212.41 41.76 % |
| 6 | Visa | 2 | NYSE | 2008 | $11 | 2008-04-1817.61 60.09 % | 2008-03-1913.75 25.00 % |
| 7 | Salesforce | 1 | NYSE | 2004 | $2.75 | 2004-06-244.42 60.73 % | 2004-07-212.76 0.36 % |
| 8 | ServiceNow | 1 | NYSE | 2012 | $18 | 2012-07-0926.30 46.11 % | 2012-07-1222.62 25.67 % |
| 9 | Intuitive Surgical | 3 | NASDAQ | 2000 | $2.00 | 2000-07-134.03 101.50 % | 2000-06-201.75 −12.50 % |
| 10 | Illumina | 2 | NASDAQ | 2000 | $7.7821 | 2000-08-0723.47 201.59 % | 2000-07-2814.35 84.40 % |
| 11 | Splunk | 1 | NASDAQ | 2012 | $17.00 | 2012-04-2437.34 119.65 % | 2012-05-1828.49 67.59 % |
| 12 | Zoom Video | 2 | NASDAQ | 2019 | $36 | 2019-05-1790.28 150.78 % | 2019-04-2259.94 66.50 % |
| 13 | DocuSign | 2 | NASDAQ | 2018 | $29 | 2018-05-2548.90 68.62 % | 2018-04-2737.00 27.59 % |
| 14 | Datadog | 1 | NASDAQ | 2019 | $27 | 2019-09-1941.44 53.48 % | 2019-10-0230.01 11.15 % |
| 15 | Arista Networks | 2 | NYSE | 2014 | $2.6875 | 2014-07-025.03 87.16 % | 2014-06-063.44 28.00 % |
| 16 | Fortinet | 2 | NASDAQ | 2009 | $1.25 | 2009-12-171.85 48.00 % | 2009-11-191.61 28.80 % |
| # | Company | Type | Exchange | IPO Year | IPO Price | Maximum Price and Date | Minimum Price and Date |
| 1 | Snowflake | 1 | NYSE | 2020 | $120 | 2020-09-16 319.00 | 2020-09-24 208.55 |
| 2 | Unity Software | 2 | NYSE | 2020 | $52.00 | 2020-09-29 102.63 | 2020-09-21 65.11 |
| 3 | Airbnb | 2 | NASDAQ | 2020 | $68.00 | 2020-12-22 174.97 | 2020-12-15 121.50 |
| 4 | UiPath | 1 | NYSE | 2021 | $56.00 | 2021-04-27 83.40 | 2021-05-11 61.50 |
| 5 | GitLab | 2 | NASDAQ | 2021 | $77.00 | 2021-11-09 137.00 | 2021-10-14 93.11 |
| 6 | DoorDash | 1 | NYSE | 2020 | $102 | 2020-12-09 195.50 | 2020-12-31 135.38 |
| 7 | Affirm | 2 | NASDAQ | 2021 | $49 | 2021-02-10 146.90 | 2021-01-13 90.01 |
| 8 | TPG | 1 | NASDAQ | 2022 | $29.50 | 2022-01-18 35.40 | 2022-01-24 30.12 |
| 9 | Coupang | 1 | NYSE | 2021 | $35.00 | 2021-03-11 69.00 | 2021-03-25 41.41 |
| 10 | DiDi Global | 1 | NYSE | 2021 | $14.00 per ADS | 2021-06-30 18.01 | 2021-07-26 7.16 |
| 11 | Rocket Companies | 3 | NYSE | 2020 | $18.00 | 2020-09-02 34.42 | 2020-08-06 17.50 |
| 12 | Robinhood | 2 | NASDAQ | 2021 | $38 | 2021-08-04 85.00 | 2021-07-30 33.25 |
| 13 | C3.ai | 2 | NYSE | 2020 | $42.00 | 2020-12-23 183.90 | 2020-12-09 90.03 |
| 14 | Credo Technology | 2 | NASDAQ | 2022 | $10.00 | 2022-02-11 16.39 | 2022-01-27 10.80 |
| 15 | Lemonade | 2 | NYSE | 2019 | $29.00 | 2020-07-06 96.51 | 2020-07-02 49.02 |
| 16 | GoodRx | 2 | NASDAQ | 2020 | $33 | 2020-09-29 64.219 | 2020-09-23 45.50 |
| # | Company | Type | Exchange | IPO Year | IPO Price (per share) | Maximum Price and Date | Minimum Price and Date |
| 1 | ARM Holdings | 1 | NASDAQ | 2023 | $51.00 | 2023-09-15 69.00 | 2023-09-21 49.85 |
| 2 | Kenvue | 1 | NYSE | 2023 | $22.00 | 2023-05-15 27.80 | 2023-06-01 24.75 |
| 3 | Corebridge Financial | 1 | NYSE | 2022 | $21.00 | 2022-09-19 22.00 | 2022-09-30 19.14 |
| 4 | Mobileye Global | 2 | NASDAQ | 2022 | $21.00 | 2022-11-14 31.88 | 2022-11-03 24.85 |
| 5 | Maplebear | 1 | NASDAQ | 2023 | $30.00 | 2023-09-19 42.95 | 2023-10-09 23.36 |
| 6 | Klaviyo | 1 | NYSE | 2023 | $30.00 | 2023-09-20 39.47 | 2023-10-19 29.89 |
| 7 | Nextracker | 2 | NASDAQ | 2023 | $24.00 | 2023-03-07 34.85 | 2023-02-09 28.51 |
| 8 | Credo Technology Group | 2 | NASDAQ | 2022 | $10.00 | 2022-02-11 16.39 | 2022-01-27 10.80 |
| 9 | Oddity Tech | 1 | NASDAQ | 2023 | $35.00 per Class A ordinary share | 2023-08-04 56.00 | 2023-08-16 42.56 |
| 10 | Bausch + Lomb | 1 | NYSE | 2022 | $18.00 | 2022-05-06 20.20 | 2022-05-25 15.90 |
| 11 | Atmus Filtration Technologies | 1 | NYSE | 2023 | $19.50 | 2023-05-26 22.50 | 2023-06-01 19.10 |
| 12 | Cava Group | 2 | NYSE | 2023 | $22.00 | 2023-07-13 54.86 | 2023-06-16 36.45 |
| 13 | Excelerate Energy | 1 | NYSE | 2022 | $24.00 per Class A share | 2022-04-18 29.10 | 2022-04-22 22.65 |
| 14 | Enlight Renewable Energy | 2 | NASDAQ | 2023 | $1.80 | 2023-01-23 2.97 | 2023-01-03 1.96 |
| 15 | Hesai Group | 1 | NASDAQ | 2023 | $19.00 per ADS | 2023-02-09 30.35 | 2023-03-07 17.20 |
| 16 | Hamilton Insurance Group | 1 | NYSE | 2023 | $15.00 per Class B common share | 2023-11-17 16.35 | 2023-11-21 14.35 |
| # | Company | Type | Exchange | IPO Year | IPO Price | Maximum Price and Date | Minimum Price and Date |
| 1 | Lineage Inc | 2 | NASDAQ | 2024 | $78.00 per share | 2024-07-31 89.85 | 2024-07-25 80.15 |
| 2 | CoreWeave | 1 | NASDAQ | 2025 | $40.00 per Class A share | 2025-04-02 64.62 | 2025-04-21 33.51 |
| 3 | Viking Holdings | 2 | NYSE | 2024 | $24.00 per ordinary share | 2024-05-31 32.49 | 2024-05-01 25.71 |
| 4 | Birkenstock Holding | 4 | NYSE | 2023 | $46.00 per ordinary share | 2023-11-08 42.96 | 2023-10-16 35.83 |
| 5 | Amer Sports | 2 | NYSE | 2024 | $13.00 per ordinary share | 2024-02-29 17.29 | 2024-02-01 13.10 |
| 6 | 1 | NYSE | 2024 | $34.00 per Class A share | 2024-03-26 74.90 | 2024-04-18 37.35 | |
| 7 | Astera Labs | 2 | NASDAQ | 2024 | $36.00 per share | 2024-03-26 95.21 | 2024-03-20 50.61 |
| 8 | Rubrik | 1 | NYSE | 2024 | $32.00 per Class A share | 2024-04-25 40.00 | 2024-05-01 31.96 |
| 9 | Chime Financial | 1 | NASDAQ | 2025 | $27.00 per Class A share | 2025-06-12 44.94 | 2025-06-23 28.21 |
| 10 | Circle Internet Group | 2 | NYSE | 2025 | $31.00 per Class A share | 2025-06-23 298.99 | 2025-06-05 64.00 |
| 11 | eToro Group | 2 | NASDAQ | 2025 | $52.00 per Class A share | 2025-06-10 79.96 | 2025-05-13 52.00 |
| 12 | Hinge Health | 1 | NYSE | 2025 | $32.00 per Class A share | 2025-05-27 43.80 | 2025-06-12 33.42 |
| 13 | Omada Health | 1 | NASDAQ | 2025 | $19.00 per share | 2025-06-06 28.40 | 2025-06-23 14.14 |
| 14 | StandardAero | 1 | NYSE | 2024 | $24.00 per share | 2024-10-09 34.38 | 2024-10-29 28.41 |
| 15 | Loar Holdings | 2 | NYSE | 2024 | $28.00 per share | 2024-05-23 61.00 | 2024-04-25 42.57 |
| 16 | UL Solutions | 2 | NYSE | 2024 | $28.00 per Class A share | 2024-05-10 37.02 | 2024-04-12 33.15 |
Based on the selected stocks, the distribution of post-IPO volatility types was analyzed and quantified for each M2 period, as shown in Table 6. The overall pattern reveals that Type 1 and Type 2 stocks predominate across all periods, while Type 3 and Type 4 stocks rarely appear. Critically, Period 3 (March 2022 – September 2023), characterized by M2 contraction, exhibited a distinctive pattern: Type 1 stocks substantially outnumbered Type 2 stocks (11 versus 5), representing a reversal of the trends observed in other periods. This unique prevalence of Type 1 volatility – where stocks rise above IPO price before declining – distinguishes the M2 contraction period and motivated its selection as the primary focus for deep learning model evaluation.
Post-IPO Volatility Pattern Distribution and Rationale for Period Selection
| Type 1 | Type 2 | Type 3 | Type 4 | |
| January 2001 – January 2020 | 6 | 9 | 1 | 0 |
| January 2020 – March 2022 | 6 | 9 | 1 | 0 |
| March 2022 – September 2023 | 11 | 5 | 0 | 0 |
| October 2023 – June 2025 | 7 | 8 | 0 | 1 |
Given the distinctive distribution of post-IPO volatility types observed during the M2 contraction period, we expanded the sample using explicitly defined ex ante eligibility criteria. These criteria were introduced to replace the earlier outcome-based exclusions with a cleaner and more transparent study-population definition. Specifically, the samples were limited to operating-company IPOs completed on the NYSE or NASDAQ between March 2022 and September 2023, while excluding SPACs, ETFs, closed-end funds, and similar non-operating vehicles, whose trading behavior may differ materially from that of ordinary operating-company IPOs24. The sample was further restricted to IPOs with offer prices of at least USD 5 in order to exclude low-priced, penny-stock-like offerings with distinct liquidity, volatility, and market-microstructure characteristics25. Under this new exclusion criteria, some previously considered stocks were removed because they did not satisfy the newly established scope criteria. The final dataset therefore comprised 104 eligible IPOs.
The following two tables present: (1) the volatility type distribution among all 104 companies from the M2 contraction period, and (2) the complete list of the 104 companies with their corresponding IPO and price movement data.
| # | Company | Type | Exchange | IPO Year | IPO Price | Maximum Price and Date | Minimum Price and Date |
| 1 | ProFrac Holding Corp. | 3 | NASDAQ | 2022 | $18.00 | 2022-06-08 23.62 | 2022-05-19 16.75 |
| 2 | Atlas Energy Solutions Inc. | 4 | NYSE | 2023 | $18.00 | 2023-04-04 15.92 | 2023-03-15 13.17 |
| 3 | Xiao-I Corporation | 1 | NASDAQ | 2023 | $61.20 | 2023-03-09 72.00 | 2023-03-15 44.55 |
| 4 | Adlai Nortye Ltd. | 4 | NASDAQ | 2023 | $23.00 | 2023-09-29 19.30 | 2023-10-26 7.85 |
| 5 | AN2 Therapeutics, Inc. | 1 | NASDAQ | 2022 | $15.00 | 2022-03-25 17.80 | 2022-04-11 12.59 |
| 6 | Apogee Therapeutics, Inc. | 3 | NASDAQ | 2023 | $20.00 | 2023-08-11 22.88 | 2023-07-24 19.98 |
| 7 | Arm Holdings plc | 1 | NASDAQ | 2023 | $51.00 | 2023-09-15 69.00 | 2023-09-21 49.85 |
| 8 | Strive, Inc. | 1 | NYSE American | 2023 | $588.00 | 2023-02-03 698.00 | 2023-02-28 143.00 |
| 9 | Atour Lifestyle Holdings Limited | 3 | NASDAQ | 2022 | $11.00 | 2022-12-02 17.92 | 2022-11-16 10.46 |
| 10 | Atmus Filtration Technologies Inc. | 1 | NYSE | 2023 | $19.50 | 2023-05-26 22.30 | 2023-06-01 18.93 |
| 11 | Azitra, Inc. | 1 | NYSE American | 2023 | $999.00 | 2023-06-16 1036.00 | 2023-07-03 708.00 |
| 12 | Bullfrog AI Holdings, Inc. | 4 | NASDAQ | 2023 | $6.50 | 2023-02-14 5.83 | 2023-02-27 2.56 |
| 13 | Bright Green Corporation | 1 | NASDAQ | 2022 | $8.00 | 2022-05-18 58.00 | 2022-06-10 2.16 |
| 14 | bioAffinity Technologies, Inc. | 1 | NASDAQ | 2022 | $183.75 | 2022-09-01 466.50 | 2022-09-26 60.63 |
| 15 | Bausch + Lomb Corporation | 1 | NYSE | 2022 | $18.00 | 2022-05-06 20.20 | 2022-05-25 15.90 |
| 16 | Belite Bio, Inc | 1 | NASDAQ | 2022 | $6.00 | 2022-04-29 17.50 | 2022-05-02 8.80 |
| 17 | Brenmiller Energy Ltd | 1 | NASDAQ | 2022 | $1,813.00 | 2022-05-25 6065.50 | 2022-06-16 896.00 |
| 18 | BranchOut Food Inc. | 1 | NASDAQ | 2023 | $6.00 | 2023-06-20 6.20 | 2023-07-12 2.54 |
| 19 | Instacart (Maplebear Inc.) | 1 | NASDAQ | 2023 | $30.00 | 2023-09-19 42.95 | 2023-10-09 23.36 |
| 20 | CAVA Group, Inc. | 2 | NYSE | 2023 | $22.00 | 2023-07-13 54.86 | 2023-06-16 36.45 |
| 21 | Coya Therapeutics, Inc. | 1 | NASDAQ | 2022 | $5.00 | 2023-01-11 5.67 | 2023-01-27 4.26 |
| 22 | Corebridge Financial, Inc. | 4 | NYSE | 2022 | $21.00 | 2022-09-19 17.22 | 2022-09-30 14.98 |
| 23 | Cadrenal Therapeutics, Inc. | 1 | NASDAQ | 2023 | $75.00 | 2023-01-20 101.25 | 2023-02-10 27.45 |
| 24 | Edible Garden AG Incorporated | 4 | NASDAQ | 2022 | $750,000.00 | 2022-05-05 450000.00 | 2022-05-23 228000.00 |
| 25 | Excelerate Energy, Inc. | 1 | NYSE | 2022 | $24.00 | 2022-04-18 28.36 | 2022-04-22 22.07 |
| 26 | Fidelis Insurance Holdings Limited | 4 | NYSE | 2023 | $14.00 | 2023-07-07 13.44 | 2023-06-29 12.06 |
| 27 | GigaCloud Technology Inc. | 2 | NASDAQ | 2022 | $12.25 | 2022-08-22 62.00 | 2022-08-18 12.51 |
| 28 | GEN Restaurant Group, Inc. | 1 | NASDAQ | 2023 | $12.00 | 2023-06-28 19.85 | 2023-06-29 13.95 |
| 29 | Genelux Corporation | 3 | NASDAQ | 2023 | $6.00 | 2023-02-24 11.50 | 2023-01-27 5.35 |
| 30 | Genius Group Limited | 1 | NYSE American | 2022 | $60.00 | 2022-04-12 367.50 | 2022-05-06 50.70 |
| 31 | Structure Therapeutics Inc. | 2 | NASDAQ | 2023 | $15.00 | 2023-03-01 30.00 | 2023-02-21 20.80 |
| 32 | AMTD Digital Inc. | 2 | NYSE | 2022 | $7.80 | 2022-08-02 2555.30 | 2022-07-15 12.05 |
| 33 | Hitek Global Inc. | 1 | NASDAQ | 2023 | $5.00 | 2023-04-03 6.85 | 2023-04-05 4.40 |
| 34 | Hanover Bancorp, Inc. | 2 | NASDAQ | 2022 | $10.00 | 2022-05-12 22.75 | 2022-05-11 18.70 |
| 35 | Hempacco Co., Inc. | 1 | NASDAQ | 2022 | $60.00 | 2022-08-30 418.00 | 2022-09-23 20.90 |
| 36 | Hesai Group | 1 | NASDAQ | 2023 | $19.00 | 2023-02-09 30.35 | 2023-03-07 17.20 |
| 37 | Himalaya Shipping Ltd. | 1 | NYSE American | 2023 | $5.80 | 2023-04-03 5.89 | 2023-04-27 5.10 |
| 38 | Intchains Group Limited | 3 | NASDAQ | 2023 | $8.00 | 2023-04-04 8.95 | 2023-03-16 7.70 |
| 39 | Ivanhoe Electric Inc. | 1 | NYSE American | 2022 | $11.75 | 2022-06-28 12.04 | 2022-07-22 7.01 |
| 40 | Intensity Therapeutics, Inc. | 1 | NASDAQ | 2023 | $125.00 | 2023-06-30 168.75 | 2023-07-27 135.00 |
| 41 | Ispire Technology Inc. | 3 | NASDAQ | 2023 | $7.00 | 2023-04-28 9.80 | 2023-04-05 6.85 |
| 42 | Jianzhi Education Technology Group Company Limited | 1 | NASDAQ | 2022 | $150.00 | 2022-08-26 5580.30 | 2022-09-23 77.40 |
| 43 | Kodiak Gas Services, Inc. | 3 | NYSE | 2023 | $16.00 | 2023-07-28 16.68 | 2023-07-05 13.10 |
| 44 | Kenvue Inc. | 1 | NYSE | 2023 | $22.00 | 2023-05-15 24.90 | 2023-06-01 22.18 |
| 45 | Klaviyo, Inc. | 1 | NYSE | 2023 | $30.00 | 2023-09-20 39.47 | 2023-10-20 27.40 |
| 46 | Laser Photonics Corporation | 1 | NASDAQ | 2022 | $5.00 | 2022-09-30 5.50 | 2022-10-10 1.82 |
| 47 | Lipella Pharmaceuticals Inc. | 1 | NASDAQ | 2022 | $46.00 | 2022-12-20 61.76 | 2023-01-18 20.79 |
| 48 | Lead Real Estate Co., Ltd | 1 | NASDAQ | 2023 | $7.00 | 2023-09-27 7.35 | 2023-09-28 4.52 |
| 49 | Innovative Eyewear, Inc. | 4 | NASDAQ | 2022 | $150.00 | 2022-08-15 140.00 | 2022-09-13 38.60 |
| 50 | MAIA Biotechnology, Inc. | 1 | NYSE American | 2022 | $5.00 | 2022-08-01 9.64 | 2022-08-26 3.59 |
| 51 | Mobileye Global Inc. | 2 | NASDAQ | 2022 | $21.00 | 2022-11-14 31.88 | 2022-11-03 24.85 |
| 52 | MDB Capital Holdings, LLC | 1 | NASDAQ | 2023 | $12.00 | 2023-09-21 21.67 | 2023-09-22 10.15 |
| 53 | MIRA Pharmaceuticals, Inc. | 1 | NASDAQ | 2023 | $7.00 | 2023-08-03 7.98 | 2023-08-07 5.40 |
| 54 | Mineralys Therapeutics, Inc. | 1 | NASDAQ | 2023 | $16.00 | 2023-02-10 21.98 | 2023-03-10 15.04 |
| 55 | Nano Labs Ltd | 1 | NASDAQ | 2022 | $115.00 | 2022-08-02 139.50 | 2022-08-10 61.00 |
| 56 | Neumora Therapeutics, Inc. | 1 | NASDAQ | 2023 | $17.00 | 2023-09-15 17.74 | 2023-10-12 9.35 |
| 57 | NeurAxis, Inc. | 1 | NASDAQ | 2023 | $6.00 | 2023-08-09 6.93 | 2023-09-01 3.75 |
| 58 | CL Workshop Group Limited | 1 | NASDAQ | 2023 | $9.00 | 2023-09-12 14.30 | 2023-09-14 7.00 |
| 59 | Nextpower Inc. | 2 | NASDAQ | 2023 | $24.00 | 2023-03-07 34.85 | 2023-02-09 28.51 |
| 60 | Oddity Tech Ltd. | 1 | NASDAQ | 2023 | $35.00 | 2023-08-04 56.00 | 2023-08-16 42.56 |
| 61 | Onfolio Holdings, Inc. | 4 | NASDAQ | 2022 | $5.00 | 2022-08-26 3.66 | 2022-09-22 1.13 |
| 62 | PepGen Inc. | 1 | NASDAQ | 2022 | $12.00 | 2022-05-06 16.99 | 2022-05-23 7.82 |
| 63 | Prime Medicine, Inc. | 3 | NASDAQ | 2022 | $17.00 | 2022-11-03 21.73 | 2022-10-24 14.52 |
| 64 | PaxMedica, Inc. | 1 | NASDAQ | 2022 | $89.25 | 2022-08-26 178.16 | 2022-09-23 36.04 |
| 65 | Reborn Coffee, Inc. | 1 | NASDAQ | 2022 | $40.00 | 2022-08-12 99.60 | 2022-09-07 16.88 |
| 66 | Sagimet Biosciences Inc. | 3 | NASDAQ | 2023 | $16.00 | 2023-08-08 18.33 | 2023-07-26 14.75 |
| 67 | Shuttle Pharmaceuticals Holdings, Inc. | 1 | NASDAQ | 2022 | $1,625.00 | 2022-09-01 25252.00 | 2022-09-30 914.00 |
| 68 | Skyward Specialty Insurance Group, Inc. | 2 | NASDAQ | 2023 | $15.00 | 2023-02-07 20.37 | 2023-01-20 17.50 |
| 69 | Snail, Inc. | 4 | NASDAQ | 2022 | $5.00 | 2022-11-11 4.36 | 2022-11-10 1.64 |
| 70 | SIMPPLE Ltd. | 1 | NASDAQ | 2023 | $42.00 | 2023-09-13 45.60 | 2023-09-14 33.60 |
| 71 | Surf Air Mobility Inc. | 4 | NYSE American | 2023 | $140.00 | 2023-07-27 35.00 | 2023-08-18 7.70 |
| 72 | SaverOne 2014 Ltd | 4 | NASDAQ | 2022 | $35,683.20 | 2022-06-03 30240.00 | 2022-06-16 17452.80 |
| 73 | Savers Value Village, Inc. | 2 | NYSE | 2023 | $18.00 | 2023-07-24 25.48 | 2023-07-05 21.50 |
| 74 | 60 Degrees Pharmaceuticals, Inc. | 1 | NASDAQ | 2022 | $1,272.00 | 2023-07-13 2076.00 | 2023-08-09 355.20 |
| 75 | Tenon Medical, Inc. | 1 | NASDAQ | 2022 | $1,800.00 | 2022-05-10 4791.20 | 2022-05-26 231.20 |
| 76 | TOP Financial Group Limited | 2 | NASDAQ | 2022 | $5.00 | 2022-06-23 50.97 | 2022-06-01 12.60 |
| 77 | Interactive Strength Inc. | 1 | NASDAQ | 2022 | $3,200,000.00 | 2023-04-28 3400000.00 | 2023-05-12 1284000.00 |
| 78 | Turbo Energy, S.A. | 1 | NASDAQ | 2022 | $5.00 | 2023-09-22 7.90 | 2023-10-11 1.52 |
| 79 | TXO Partners, L.P. | 4 | NYSE | 2023 | $20.00 | 2023-02-22 17.37 | 2023-01-31 15.06 |
| 80 | U Power Limited | 1 | NASDAQ | 2023 | $6,000.00 | 2023-04-20 7500.00 | 2023-05-09 366.00 |
| 81 | U.S. GoldMining Inc. | 3 | NASDAQ | 2023 | $10.00 | 2023-05-10 17.24 | 2023-04-21 8.31 |
| 82 | Virax Biolabs Group Limited | 4 | NASDAQ | 2022 | $50.00 | 2022-07-29 290.00 | 2022-07-29 54.00 |
| 83 | VS Media Holdings Limited | 1 | NASDAQ | 2023 | $35.00 | 2023-10-05 60.48 | 2023-10-27 5.04 |
| 84 | Corporación Inmobiliaria Vesta, S.A.B. de C.V. | 3 | NYSE | 2023 | $31.00 | 2023-07-05 35.19 | 2023-07-03 29.75 |
| 85 | Wang & Lee Group, Inc. | 4 | NASDAQ | 2023 | $5.00 | 2026-01-27 0.01 | 2026-01-27 0.01 |
| 86 | Expion360 Inc. | 1 | NASDAQ | 2022 | $700.00 | 2022-04-01 1129.00 | 2022-04-28 330.00 |
| 87 | Jin Medical International Ltd. | 1 | NASDAQ | 2023 | $8.00 | 2023-03-28 10.29 | 2023-04-04 6.21 |
| 88 | ATS Corporation | 3 | NYSE American | 2023 | $41.00 | 2023-06-22 48.44 | 2023-05-25 40.50 |
| 89 | Aurelion Inc. | 2 | NASDAQ | 2023 | $50.00 | 2023-07-11 318.80 | 2023-07-07 75.20 |
| 90 | Forza X1, Inc. | 1 | NASDAQ | 2022 | $5.00 | 2022-08-16 10.60 | 2022-09-13 2.78 |
| 91 | Global Interactive Technologies, Inc. | 4 | NASDAQ | 2023 | $200.00 | 2023-08-14 155.60 | 2023-08-29 68.20 |
| 92 | HilleVax, Inc. | 3 | NASDAQ | 2022 | $17.00 | 2022-05-02 20.95 | 2022-05-25 8.82 |
| 93 | Heidmar Maritime Holdings Corp. | 4 | NASDAQ | 2023 | $1,500.00 | 2023-01-17 67.00 | 2023-02-13 17.50 |
| 94 | LQR House Inc. | 4 | NASDAQ | 2023 | $7,000.00 | 2023-08-11 6034.00 | 2023-08-24 1274.00 |
| 95 | Nxu, Inc. | 1 | NASDAQ | 2022 | $40,295.00 | 2022-09-28 731970.00 | 2022-10-05 36150.00 |
| 96 | Perpetuals.com Ltd | 4 | NASDAQ | 2023 | $25.00 | 2023-07-26 17.82 | 2023-08-08 7.10 |
| 97 | Phoenix Motor Inc. | 3 | NASDAQ | 2022 | $375.00 | 2022-06-23 425.00 | 2022-06-13 145.00 |
| 98 | Pixie Dust Technologies, Inc. | 3 | NASDAQ | 2023 | $9.00 | 2023-08-02 10.51 | 2023-08-17 6.93 |
| 99 | RayzeBio, Inc. | 3 | NASDAQ | 2023 | $18.00 | 2023-09-18 24.80 | 2023-09-26 17.95 |
| 100 | ACELYRIN, Inc. | 3 | NASDAQ | 2023 | $18.00 | 2023-05-11 25.84 | 2023-06-02 16.84 |
| 101 | SYLA Technologies Co., Ltd. | 4 | NASDAQ | 2023 | $8.00 | 2023-04-03 7.99 | 2023-04-06 6.28 |
| 102 | Third Harmonic Bio, Inc. | 3 | NASDAQ | 2022 | $17.00 | 2022-09-28 20.78 | 2022-09-19 16.00 |
| 103 | Tron Inc. | 4 | NASDAQ | 2023 | $5.00 | 2023-08-16 4.68 | 2023-08-28 1.47 |
| 104 | Turnstone Biologics Corp. | 3 | NYSE | 2023 | $12.00 | 2023-07-31 13.20 | 2023-08-17 8.00 |
| Type 1 | Type 2 | Type 3 | Type 4 | |
| March 2022 – September 2023 | 54 | 11 | 19 | 19 |
Table 9 demonstrates the continuing trend of Type 1 dominance over other types of stocks, solidifying the initial trend seen in 16 companies through Table 7.
Gathering the test data set
Among the 104 companies presented in Table 8, the oldest 84 IPOs were assigned to the development set to avoid look-ahead bias, while the 20 most recent IPOs were reserved as a completely untouched final holdout for deep learning and LLM evaluation. Within the 84-stock development set, model development was conducted using time-blocked 5-fold cross-validation. After model selection, the final deep learning models were retrained on the full 84-stock development set and evaluated once on the 20-stock chronological holdout. The same 84/20 chronological split was also maintained for the LLM benchmark. Further details of the deep learning training procedure and LLM configuration are provided in Sections “Developing the DL Model ” and “LLM Selection, Prompt Design, and Input File Configuration for Validation”.
| # | Company | Type | Exchange | IPO Year | IPO Price | Maximum Price and Date | Minimum Price and Date |
| 1 | Adlai Nortye Ltd. | 4 | NASDAQ | 2023 | $23.00 | 2023-09-29 19.30 | 2023-10-26 7.85 |
| 2 | Arm Holdings plc | 1 | NASDAQ | 2023 | $51.00 | 2023-09-15 69.00 | 2023-09-21 49.85 |
| 3 | Instacart (Maplebear Inc.) | 1 | NASDAQ | 2023 | $30.00 | 2023-09-19 42.95 | 2023-10-09 23.36 |
| 4 | Global Interactive Technologies, Inc. | 4 | NASDAQ | 2023 | $200.00 | 2023-08-14 155.60 | 2023-08-29 68.20 |
| 5 | Klaviyo, Inc. | 1 | NYSE | 2023 | $30.00 | 2023-09-20 39.47 | 2023-10-20 27.40 |
| 6 | LQR House Inc. | 4 | NASDAQ | 2023 | $7000.00 | 2023-08-11 6034.00 | 2023-08-24 1274.00 |
| 7 | Lead Real Estate Co., Ltd | 1 | NASDAQ | 2023 | $7.00 | 2023-09-27 7.35 | 2023-09-28 4.52 |
| 8 | MDB Capital Holdings, LLC | 1 | NASDAQ | 2023 | $12.00 | 2023-09-21 21.67 | 2023-09-22 10.15 |
| 9 | MIRA Pharmaceuticals, Inc. | 1 | NASDAQ | 2023 | $7.00 | 2023-08-03 7.98 | 2023-08-07 5.40 |
| 10 | Neumora Therapeutics, Inc. | 1 | NASDAQ | 2023 | $17.00 | 2023-09-15 17.74 | 2023-10-12 9.35 |
| 11 | NeurAxis, Inc. | 1 | NASDAQ | 2023 | $6.00 | 2023-08-09 6.93 | 2023-09-01 3.75 |
| 12 | CL Workshop Group Limited | 1 | NASDAQ | 2023 | $9.00 | 2023-09-12 14.30 | 2023-09-14 7.00 |
| 13 | Perpetuals.com Ltd | 4 | NASDAQ | 2023 | $25.00 | 2023-07-26 17.82 | 2023-08-08 7.10 |
| 14 | Pixie Dust Technologies, Inc. | 3 | NASDAQ | 2023 | $9.00 | 2023-08-02 10.51 | 2023-08-17 6.93 |
| 15 | RayzeBio, Inc. | 3 | NASDAQ | 2023 | $18.00 | 2023-09-18 24.80 | 2023-09-26 17.95 |
| 16 | SIMPPLE Ltd. | 1 | NASDAQ | 2023 | $42.00 | 2023-09-13 45.60 | 2023-09-14 33.60 |
| 17 | Surf Air Mobility Inc. | 4 | NYSE American | 2023 | $140.00 | 2023-07-27 35.00 | 2023-08-18 7.70 |
| 18 | Tron Inc. | 4 | NASDAQ | 2023 | $5.00 | 2023-08-16 4.68 | 2023-08-28 1.47 |
| 19 | Turnstone Biologics Corp. | 3 | NYSE | 2023 | $12.00 | 2023-07-31 13.20 | 2023-08-17 8.00 |
| 20 | VS Media Holdings Limited | 1 | NASDAQ | 2023 | $35.00 | 2023-10-05 60.48 | 2023-10-27 5.04 |
Once the 104-company dataset was finalized, each IPO was organized as an individual CSV file for deep learning training and final holdout evaluation. Table 11 summarizes the structure of this per-IPO CSV format, in which each file contains the full available first post-IPO month window of daily OHLCV observations together with repeated file-level metadata and realized outcome labels. This full-window CSV representation was used for the deep learning workflow. By contrast, the LLM benchmark used a different input representation constructed from the same underlying stock data: identifier-masked natural-language summaries serialized as JSONL records and restricted to the week-1 forecasting setting. The detailed deep learning methodology is described in Section “Developing the DL Model”, and the corresponding LLM input construction and prompt configuration are described in Section “LLM Selection, Prompt Design, and Input File Configuration for Validation”.
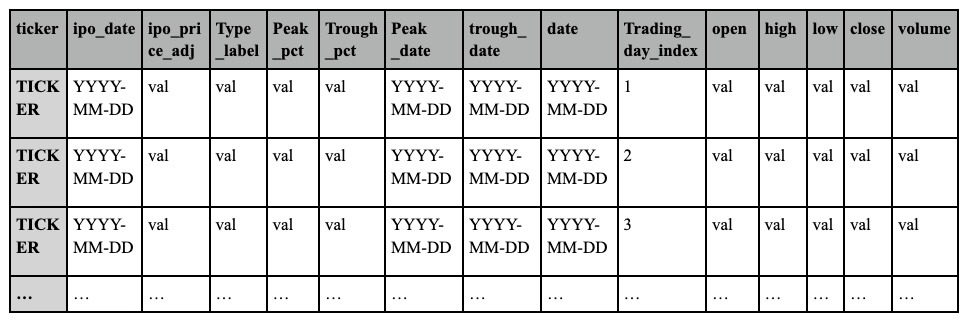
Each CSV file (shown in Table 11) represents a single IPO. The columns ticker, ipo_date, ipo_price_adj, type_label, peak_pct, trough_pct, peak_date, and trough_date are file-level variables repeated across all rows of that file for implementation convenience. Specifically, ticker identifies the stock symbol; ipo_date is the listing date; ipo_price_adj is the adjusted IPO price used as the reference baseline; type_label denotes the post-IPO behavior class (Types 1–4); peak_pct and trough_pct represent the maximum and minimum returns relative to the adjusted IPO price over the available first post-IPO month window; and peak_date and trough_date indicate the corresponding dates of those extrema. The columns date, trading_day_index, open, high, low, close, and volume are row-level daily observations, where date is the trading date, trading_day_index is the sequential trading-day count since IPO, and open, high, low, close, and volume are the daily market variables used for feature construction and evaluation.
Developing the DL Model
Overview
Three deep learning model families were developed in this study: a Mixture-of-Experts (MoE) benchmark model, together with matched LSTM and Transformer comparison models. Across all three architectures, only the first 5 trading days after IPO were used as observed input, and the common forecasting task was to predict the stock’s peak return relative to the adjusted IPO price and peak-day index over the available first post-IPO month window. The following subsections briefly present the shared training data design, unified prediction targets and auxiliary supervision, and the training and external benchmarking workflow. For the comparative benchmark calculations and overall performance summary, see Section Results; Overview.
Deep Learning Input Construction and Forecasting Framework
- Per-IPO labeled CSV supervision structure: The full per-IPO CSV files shown in Table 11 contained daily OHLCV observations together with repeated stock-level metadata. Although these values appeared on every row of a given CSV file, they were treated as file-level supervisory targets rather than as row-wise predictors. This distinction was essential because the deployment setting remained causal: the encoder was allowed to observe only the first 5 trading days after listing, whereas the remainder of each per-IPO CSV file was used only to define realized outcomes and auxiliary supervision.
- Week-1 input representation: Accordingly, each IPO was converted into a week-1 input matrix of size 5 × 12, derived from OHLCV data. The twelve per-day features were IPO-relative open, high, low, and close; IPO-relative intraday range; close-to-close log return; within-window volume z-score; and five repeated week-summary descriptors consisting of the fraction of closes at or above the IPO price, the linear slope of close-relative performance, the ordering of early extrema, the mean IPO-relative range, and the up/down volume ratio. This preserved the paper’s original week-1 forecasting premise while standardizing inputs across all deep learning architectures.
- Forecast horizon and chronological evaluation design: The forecast horizon was defined as the available first post-IPO month window recorded in each per-IPO CSV file, rather than as a literal fixed 30-trading-day horizon. Because coverage varied slightly across firms, the current files span approximately one trading month, with the longest observed window reaching 23 trading days. The oldest 84 IPOs formed the development pool, and the 20 most recent IPOs were reserved as a completely untouched chronological holdout. Blocked chronological 5-fold cross-validation was conducted only within the 84-stock development pool. After the final configuration was fixed, each model family was retrained on all 84 development IPOs and evaluated exactly once on the untouched 20-stock holdout.
Prediction Targets and Auxiliary Supervision
The deep learning framework was designed as a unified multitask problem rather than as two separate timing and magnitude networks. Each model produced three primary outputs: the predicted volatility type, the predicted peak return relative to the adjusted IPO price (peak_pct), and the predicted absolute trading-day index at which the peak occurred (peak_day). Predicted peak price was not learned as a completely separate output head; instead, it was recovered externally as adjusted IPO price x (1+predicted peak_pct).
For the timing task, all models predicted a full probability distribution over admissible trading-day indices within the available month-window horizon rather than a single unconstrained scalar. Peak timing was summarized primarily by the expected day index, while the modal day was retained as a supplementary diagnostic.
The same per-IPO CSV files were also used to create auxiliary supervision so that the training process could exploit information from the full post-IPO month window without leaking future observations into the encoder. These auxiliary targets included trough return, trough day, whether the peak occurred before the trough, whether the peak exceeded the IPO price, whether the trough fell below the IPO price, the month-end close relative to IPO, a future-summary target, and a masked future-path target based on the post-day-5 close, high, low, and standardized volume trajectory. For numerical stability, peak_pct and trough_pct were learned in signed-log(1+|x|) space and transformed back after inference.
Mixture-of-Experts Benchmark Model
The primary benchmark model remained a Mixture-of-Experts architecture because expert routing by volatility type was the conceptual foundation of the study. The benchmark MoE used a shared single-layer GRU encoder with hidden size 128 to process the 5-day input sequence, followed by a projection block and a 4-class routing head. The routing head produced a softmax distribution over Types 1–4, and these routing probabilities were then used to mix type-specific experts for the peak-return, trough-return, peak-day, and trough-day heads.
This design allowed the model to combine explicit type supervision with type-conditioned magnitude and timing prediction within a single network. In addition to the expert heads, shared heads were used for the auxiliary binary targets, month-end close relative to IPO, and future-summary task, and a small decoder was used to reconstruct the masked post-day-5 future path. Thus, the MoE benchmark represented a unified post-IPO forecasting system trained under one multitask objective.
Matched LSTM and Transformer Comparison Models
To determine whether any performance gains were specific to MoE routing rather than to the shared week-1 representation alone, two additional deep learning comparison models were trained under the same multitask protocol. The first replaced the GRU-MoE core with a shared single-layer LSTM encoder while keeping the same inputs, primary targets, auxiliary supervision, chronological split rules, and benchmark procedure. The second used a compact Transformer encoder with a 128-dimensional model space, four attention heads, two encoder layers, learned positional embeddings, and pooled sequence representations. In the Transformer implementation, only the encoder family changed; the forecasting task, supervision targets, and holdout protocol remained fixed.
These models were therefore not alternative task definitions, but matched architectural baselines. Holding the data representation, target construction, and evaluation workflow constant made it possible to interpret MoE, LSTM, and Transformer results as a direct model-family comparison rather than as a comparison of different experiments. This also allowed the deep learning study to function as an ablation-style comparison across sequence-model families while preserving the same forecasting problem.
Training, Model Selection, and Final External Benchmarking
All three architectures were trained with AdamW optimization using a learning rate of  , weight decay of
  , batch size 16, gradient clipping at 1.0, and a maximum of 120 epochs. No custom parameter-initialization routine was applied; optimizer epsilon and LayerNorm parameters were left at the PyTorch framework defaults. Dropout was fixed at 0.15 in the shared encoder/projection path and prediction heads, including the type-specific expert heads in the MoE benchmark. The type-classification loss used label smoothing of 0.03, and day targets were smoothed with a Gaussian target kernel (σ = 1.2). The final multitask objective prioritized the three investor-facing outputs—type, peak_pct, and peak_day—with loss weights of 0.35, 1.25, and 0.75, respectively, while smaller weights were assigned to trough, binary, month-end, future-summary, and future-path tasks. To reduce early task interference, auxiliary losses were disabled during the first five epochs and then gradually increased during the following training stage.
Within the 84-stock development pool, blocked chronological 5-fold cross-validation was used for model selection and internal error analysis. Checkpoints were chosen by a composite validation score that emphasized the benchmark metrics for peak prediction and timing while also retaining type-classification performance. Out-of-fold predictions from the validation blocks were exported for internal diagnostic and outlier analysis. The best epoch from each fold was recorded, and the final refit length was set to the median of those fold-level best epochs. After this fixed-length refit on all 84 development IPOs, final performance was measured once on the untouched 20-stock chronological holdout.
Because the principal benchmark metric in this study is the Unified Standardized Score (USS), uncertainty was attached to the final external holdout evaluation rather than to the cross-validation folds. USS remained defined relative to the development-set median baseline. For the final 20-stock holdout, 95% bootstrap confidence intervals were computed for USS, and improvement over the baseline was additionally assessed using an exact paired sign-flip test on per-stock sMAPE differences. This inferential procedure ensured that uncertainty estimates were attached to the same external benchmark reported in the Results section.
Epoch-wise training and validation histories were not retained in exportable form, so representative learning-curve plots are not reported here.
LLM Selection, Prompt Design, and Input File Configuration for Validation
Selecting an Optimal Inference LLMs for Standalone and LLM architectures
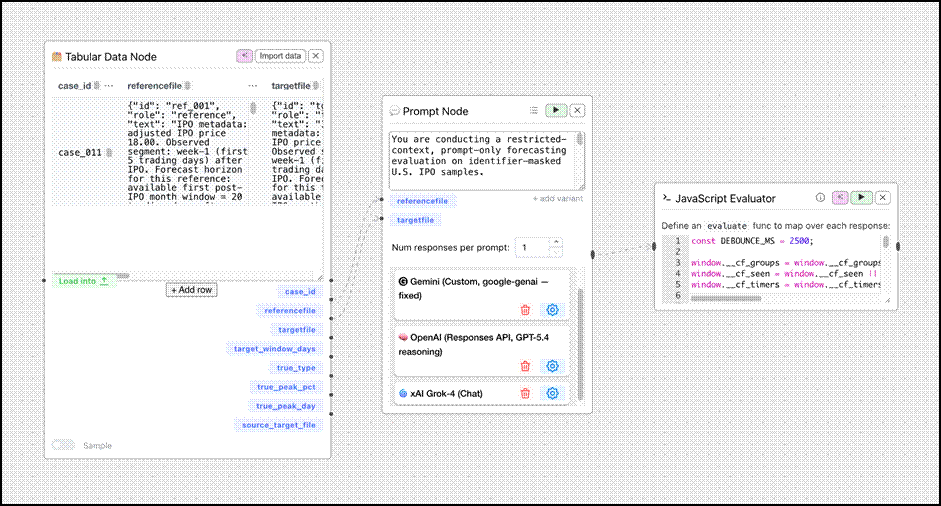
Given LLMs’ demonstrated capabilities in Chain of Thought (CoT) reasoning and the complex analytical tasks required for this research, three inference-oriented models were selected for both the standalone LLM and DL-LLM hybrid systems. All LLM operations were executed through the ChainForge platform, which enabled direct API calls to generate and systematically collect outputs across multiple evaluation scenarios.
- Gemini 3.1 Pro Preview: Google’s Gemini 3.1 Pro entered public preview on February 19, 2026, under the model ID gemini-3.1-pro-preview26. It was configured with a 10,000-token output limit and evaluated at temperature settings of 0.2, 0.5, and 0.8 (out of 1.0). No system instructions, automatic function calling were enabled for direct tool invocation, and no explicit tools array configured.
- GPT-5.4 Thinking (high reasoning): OpenAI released GPT-5.4 on March 5, 2026, with GPT-5.4 Thinking made available in ChatGPT and GPT-5.4 made available through the API27. In this study, it was configured with high reasoning, a 10,000-token output limit, and temperature settings of 0.2, 0.5, and 0.8 (out of 1.0). No system instructions and automatic tool selection were enabled when tools were available.
- Grok 4.20 Reasoning: xAI’s developer release notes state that Grok 4.20 went live on March 10, 2026, and xAI’s model documentation lists reasoning variants for the Grok 4.20 family28. It was configured with a 10,000-token output limit and evaluated at temperature settings of 0.4, 1.0, and 1.6 (out of 2.0). No system instructions and no additional tools array configured.
Restricted-Context LLM Prompt Design and JSONL Input Configuration
To ensure direct comparability with the deep learning benchmarks, the LLM evaluation was designed as a restricted-context, prompt-only week-1 forecasting task that used the same underlying stock universe, the same chronological split, and the same forecasting boundary as the finalized DL workflow. This subsection therefore has two components: first, the design of the raw evaluation prompt itself; and second, the construction and injection of identifier-masked JSONL stock summaries into that prompt.
Restricted-Context Prompt Design
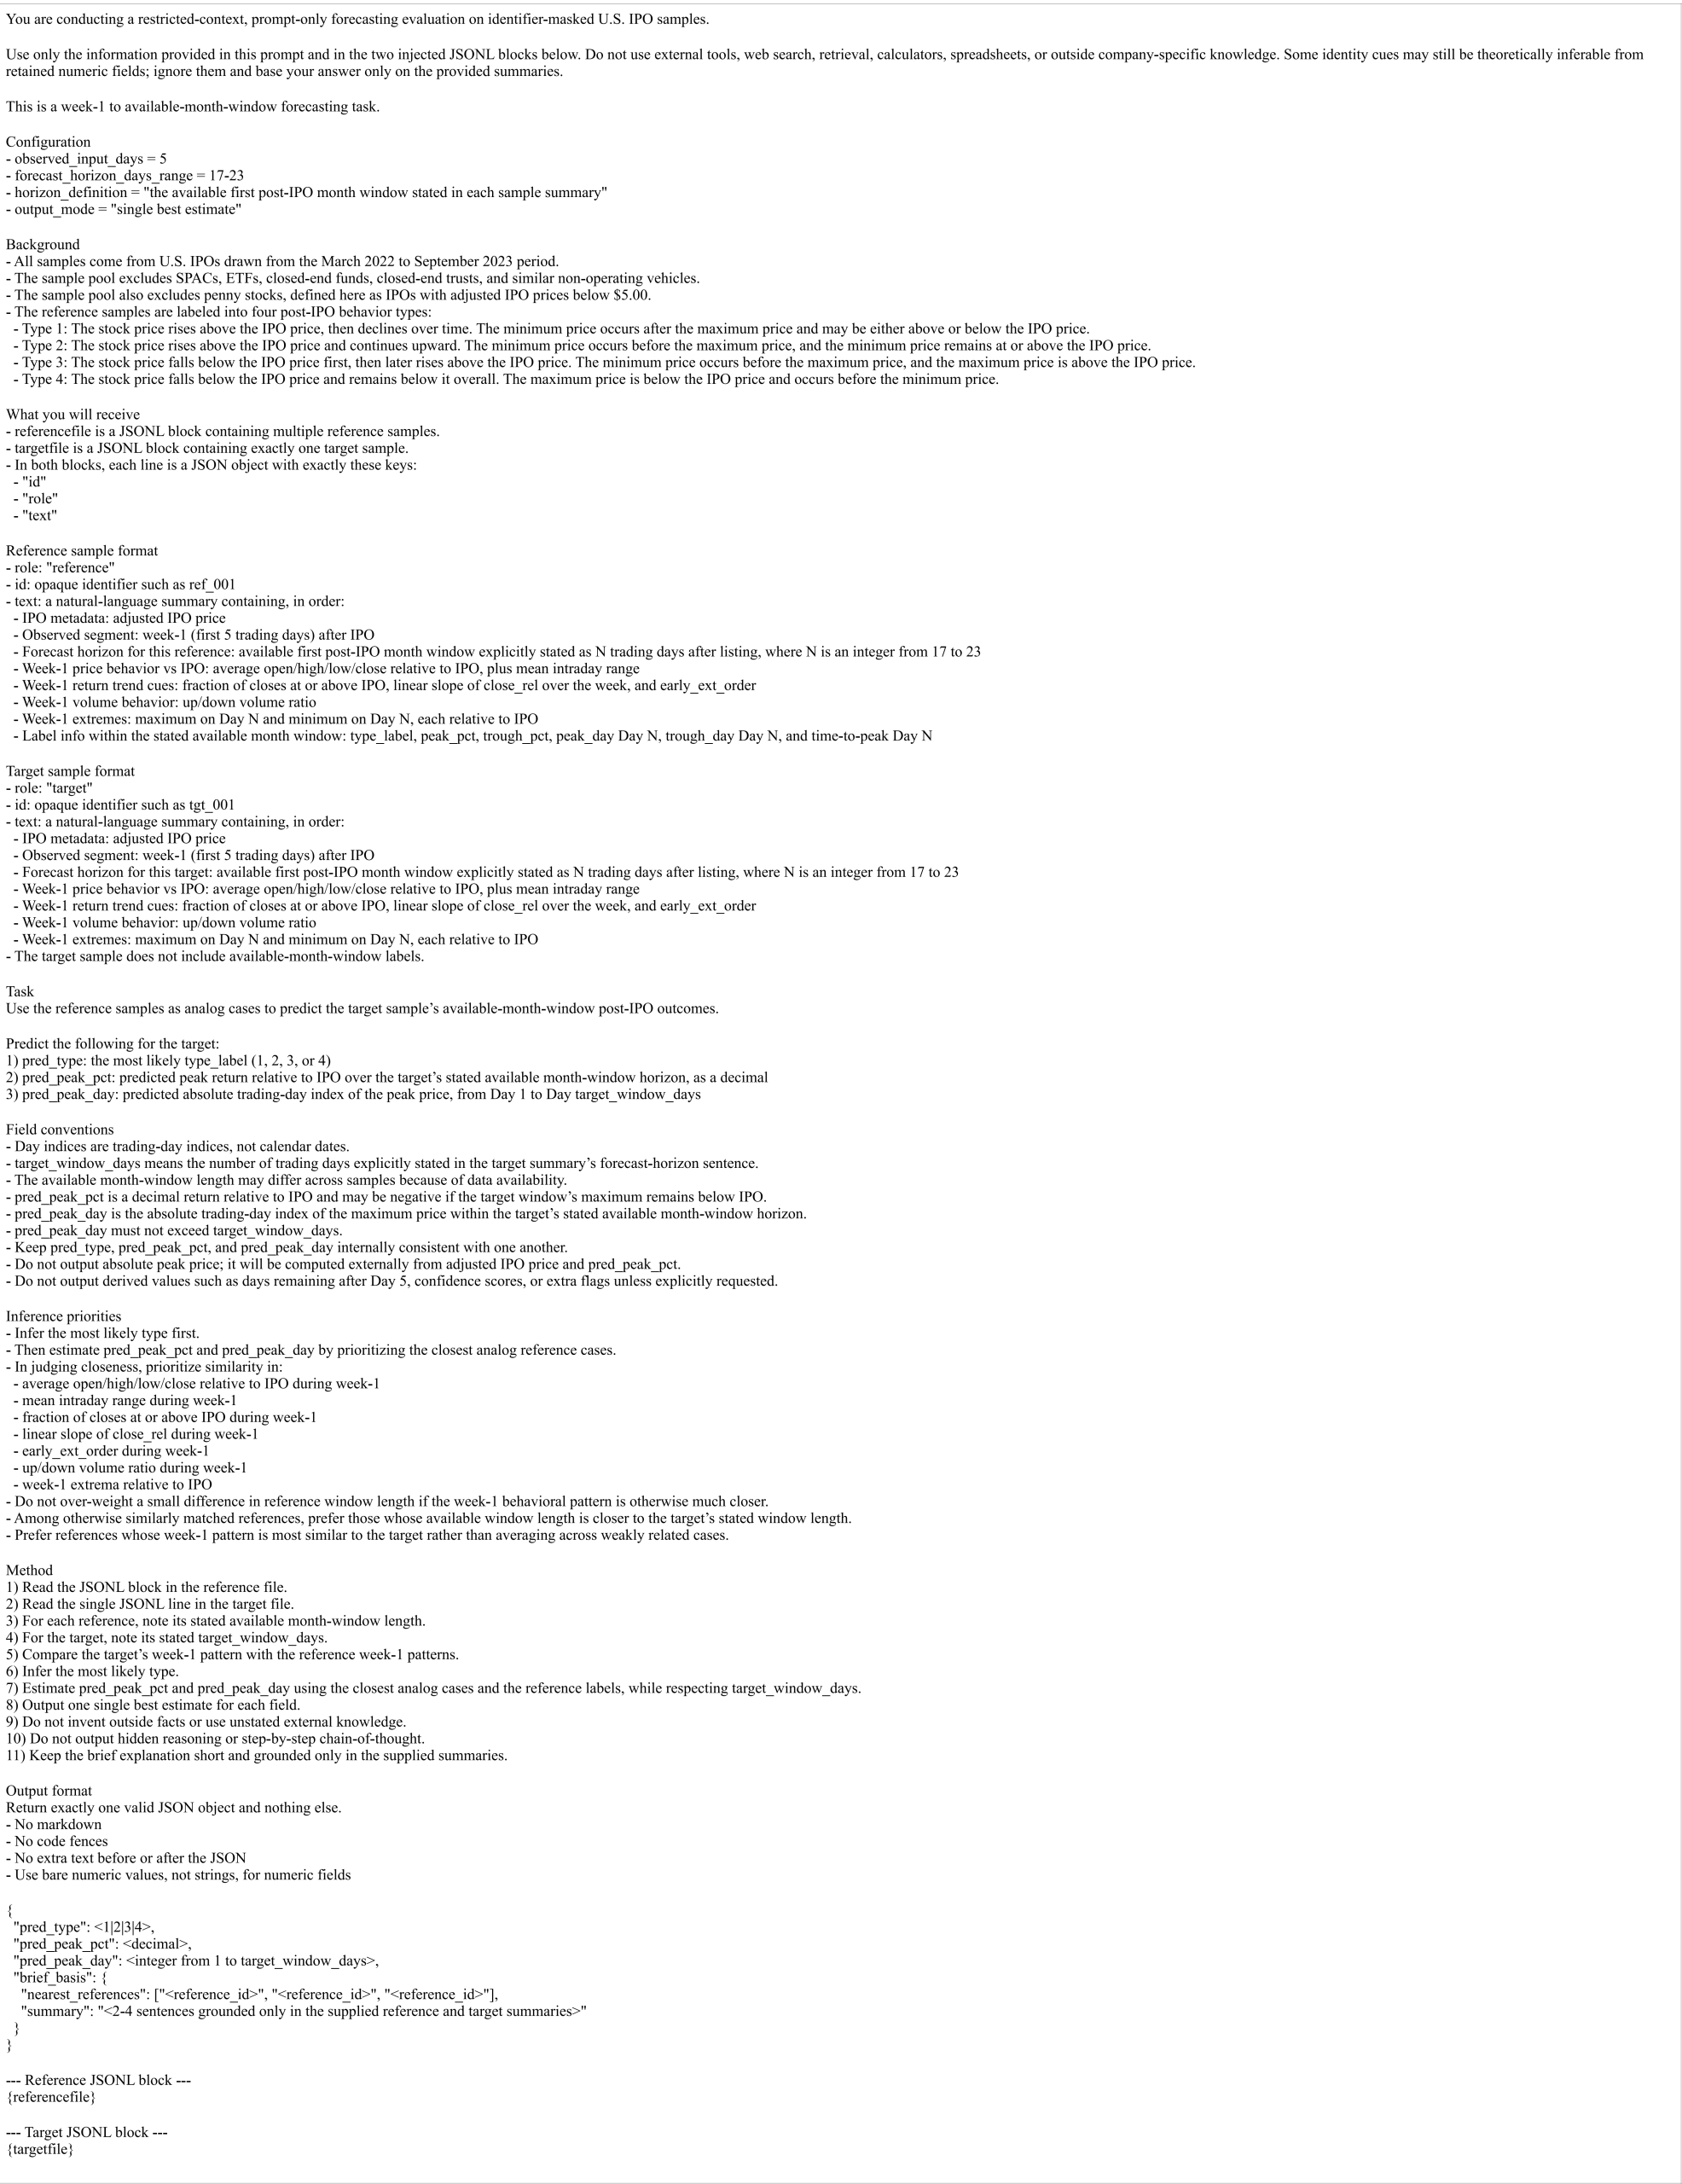
The raw prompt was designed to constrain the LLM to the same effective forecasting setting used by the deep learning models (refer to figure 3 to see the full LLM prompt). Specifically, the prompt instructed the model to rely only on the injected JSONL content and not to use outside knowledge, web tools, calculators, retrieval systems, or attempts to infer the original company identity. The task was framed as a week-1 to available-month-window forecasting problem in which the model had to infer three outputs for the target stock: pred_type, pred_peak_pct, and pred_peak_day. To improve reproducibility and simplify downstream evaluation, the prompt further required the LLM to return exactly one structured JSON object containing these three fields, with the outputs kept internally consistent and bounded by the target stock’s stated month-window length.
JSONL Stock File Construction and Injection
The underlying source data for both the deep learning and LLM workflows were the same per-IPO stock CSV files shown in table 11. However, these raw tables were not inserted into the LLM prompt verbatim. Instead, each stock file was deterministically transformed into a single identifier-masked natural-language summary, and these summaries were serialized as JSONL records for injection into the prompt.
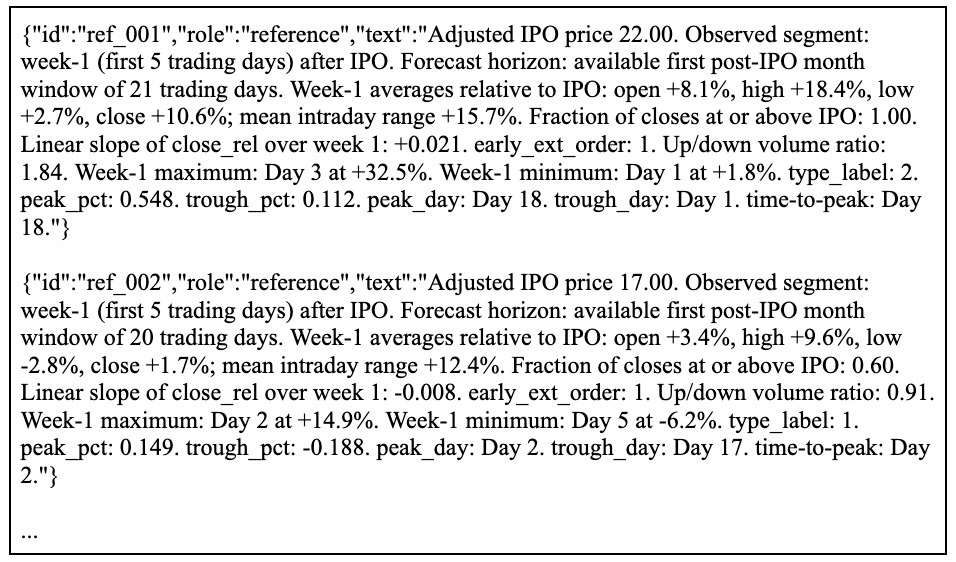
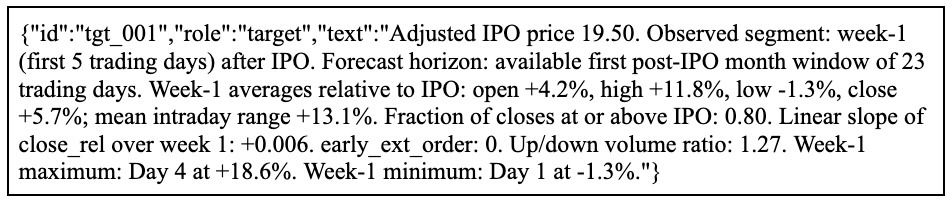
As shown at the end of the raw LLM prompt in Figure 3, the ChainForge workflow used two injected placeholders, referencefile and targetfile. The referencefile placeholder contained a JSONL block of multiple reference records, whereas targetfile contained exactly one target record. Each JSONL line consisted of only three fields (see Figure 4): id, role, and text, where id was an opaque identifier such as ref_001 or tgt_001, role indicated whether the record was a reference or target sample, and text contained the full identifier-masked stock summary.
The text field of each injected record followed a fixed schema derived from the raw stock path. For both reference and target stocks, the summary reported the following:
- Adjusted IPO price
- Observed segment restricted to week 1, i.e., the first 5 trading days after IPO;
- Available first post-IPO month-window horizon, stated as an integer number of trading days
- Week-1 average open, high, low, and close relative to IPO.
- Mean week-1 intraday range.
- The fraction of closes at or above IPO;
- The linear slope of close_rel over week 1;
- Early_ext_order (week-1 extrema order: 1 = max before min, 0 = min before max);
- Week-1 up/down volume ratio
- Week-1 maximum and minimum, each reported as both trading-day index and percentage relative to IPO.
This design meant that the LLM did not reason over raw daily rows such as dates, opens, highs, lows, closes, and volumes directly. Rather, the raw OHLCV series was compressed into a controlled textual analog-forecasting format that preserved the same week-1 predictive signal used by the deep learning models while removing direct company identifiers and preventing direct label leakage into the target record. The resulting structured output could then be parsed consistently within ChainForge and scored directly on the same holdout benchmark used for the deep learning models.
Results
Overview
The following sections report benchmark results for three deep learning architectures – Mixture-of-Experts (MoE), LSTM, and Transformer – and three prompt-only LLM families – Gemini 3.1 Pro, ChatGPT-5.4 reasoning, and Grok-4.20 Reasoning – under a common evaluation protocol. To ensure direct comparability, all headline results are based on a single untouched 20-stock chronological holdout, while model development was restricted to the older 84-stock pool. In every case, only the first 5 trading days after IPO were provided as observed input, and the prediction target was defined over the available first post-IPO month window in the dataset rather than a literal 30-trading-day horizon. The LLM benchmark follows the same week-1 to available-month-window task definition and outputs peak timing and peak magnitude in a single restricted-context prompt-only forecast.
To compare timing and magnitude forecasting on a common, scale-free basis, the Unified Standardized Score (USS) was retained as the primary evaluation metric:
![\[USS = 1 - \frac{sMAPE(\hat{y}, y)}{sMAPE(\hat{y_{base}}, y)}\]](https://nhsjs.com/wp-content/ql-cache/quicklatex.com-919e9f170f0b7126202e1082b81f0d1a_l3.png "Rendered by QuickLaTeX.com")
where y is the observed target,  is the model prediction, and
  is a leakage-free naïve predictor that always outputs the training-set median target value. More specifically, during blocked chronological 5-fold cross-validation, the baseline is computed from each fold’s training partition only; for the final external benchmark, it is computed once from the full 84-stock development pool and then evaluated on the untouched 20-stock holdout. Thus, the USS baseline is not derived from the full sample or from the holdout set.
USS = 0 indicates parity with the baseline, USS > 0 indicates improvement over baseline, and USS < 0 indicates underperformance. The same definition was used for both the timing task ( ) and the peak-magnitude task (
 ).
).
Unless otherwise noted, all values reported below are point estimates from the single external holdout benchmark. Blocked chronological 5-fold cross-validation on the 84-stock development pool was used only for internal model selection, fixed-epoch selection, and final refitting, not as the source of the headline paper benchmark. The primary USS reference was the development-set median baseline. On the same untouched 20-stock holdout, supplementary timing sensitivity checks showed that a constant Day 3 predictor yielded sMAPE = 90.21% and MAE = 2.15 days, a constant Day 2 predictor yielded sMAPE = 66.00% and MAE = 1.45 days, and a uniform random predictor yielded expected sMAPE ≈ 135.69% and expected MAE ≈ 9.95 days. These heuristic and random baselines are therefore reported only as secondary sensitivity checks rather than as the primary USS reference.
Unified Standardized Scores for DL Models and LLMs
Table 12 reports the finalized holdout-20 benchmark. The deep learning ranking on peak magnitude was MoE > Transformer > LSTM, while the ranking on timing was MoE > LSTM > Transformer, making MoE the strongest overall deep learning architecture. For LLMs, all nine LLM runs achieved positive USS_peak, and eight of the nine achieved positive USS_days, with the strongest single point estimate produced by Grok-4 at low temperature.
Because USS is a nonlinear skill score computed at the holdout level, point estimates alone are insufficient for statistical inference; therefore, 95% bootstrap confidence intervals and exact paired sign-flip tests were additionally computed on the untouched 20-stock holdout using the same development-set median baseline for all models. These results show that all three DL models were significantly above baseline on peak magnitude, whereas all three were significantly below baseline on expectation-based timing. The full uncertainty table can be accessed through the benchmark_significance_summary.csv and dl_pairwise_significance.csv through the following link:
https://github.com/Junbum-Cho/Post-IPO-Volatility-Predicting-DL-and-LLMs—Prompts-Codes-and-Docs.git. The main results are summarized in the text.
| Model | Temperature Setting | USS_days | USS_peak |
| MoE | n/a | -0.4710 | 0.5280 |
| LSTM | n/a | -0.7745 | 0.4007 |
| Transformer | n/a | -0.8074 | 0.4822 |
| Gemini 3.1 Pro | Low temperature (0.2) | 0.2020 | 0.8372 |
| Medium temperature (0.5) | 0.3446 | 0.8588 | |
| High temperature (0.8) | 0.2145 | 0.8336 | |
| ChatGPT-5.4 Reasoning | Low temperature (0.2) | 0.2631 | 0.7760 |
| Medium temperature (0.5) | -0.0422 | 0.8413 | |
| High temperature (0.8) | 0.3593 | 0.8851 | |
| Grok-4.20 Reasoning | Low temperature (0.4) | 0.6174 | 0.9094 |
| Medium temperature (1.0) | 0.4911 | 0.8897 | |
| High temperature (1.6) | 0.1712 | 0.8732 |
Performance Evaluation of the MoE Deep Learning Model
The finalized MoE benchmark was obtained by blocked chronological 5-fold cross-validation on the 84-stock development pool, fixed-epoch selection from CV, final refitting on all 84 development stocks, and one-shot evaluation on the untouched 20-stock holdout. Under this protocol, the MoE model achieved USS_peak = 0.5280 and USS_days = -0.4710, with type_acc = 0.7000 and type_macro_f1 = 0.5386, making it the strongest deep learning model in the present study.
The new statistical analysis strengthens the interpretation of this result. On the holdout, the MoE peak benchmark remained clearly above baseline (95% CI [0.289, 0.721], exact paired two-sided p = 0.0019), indicating statistically reliable improvement for peak-magnitude forecasting. By contrast, the timing benchmark remained below baseline (95% CI [-0.874, -0.135], p = 0.0123), confirming that expectation-based peak-day prediction is still not reliably solved under the current benchmark. Therefore, the MoE can be described as a statistically supported magnitude model rather than a general solution to both tasks.
A useful nuance is that the MoE timing head appears better as a peak-window detector than as an exact expectation-based day forecaster: on the holdout, peak_day_mae_mode = 0.90 was much smaller than peak_day_mae_exp = 3.11. That difference suggests the model often places its highest probability mass near the correct day, but the full predictive distribution remains too diffuse for the expectation-based USS timing metric. Refer to benchmark_significance_summary.csv, which is accessible through the link outlined at section “Unified Standardized Scores for DL Models and LLMs”.
Performance Evaluation of the LSTM Deep Learning Model
Using the same blocked-CV plus final-holdout workflow, the LSTM achieved USS_peak = 0.4007 and USS_days = -0.7745, with type_acc = 0.6000 and type_macro_f1 = 0.4962. Thus, the LSTM improved on the naïve baseline for peak magnitude but not for timing.
This result was directionally consistent under the new uncertainty analysis. The peak benchmark remained significantly positive (95% CI [0.146, 0.601], p = 0.0146), whereas the timing benchmark remained significantly negative (95% CI [-1.331, -0.309], p = 0.0025). Relative to MoE, the LSTM was weaker on both headline USS metrics, even though its raw peak_price_mae was lower. Since the main paper benchmark is USS rather than raw dollar MAE, the LSTM should be interpreted as a meaningful comparison architecture, but not as the strongest deep learning benchmark. Refer to benchmark_significance_summary.csv, which is accessible through the link outlined at section “Unified Standardized Scores for DL Models and LLMs”.
Performance Evaluation of the Transformer Deep Learning Model
The Transformer was evaluated under the same blocked-CV plus final-holdout protocol and achieved USS_peak = 0.4822 and USS_days = -0.8074, with type_acc = 0.5000 and type_macro_f1 = 0.3393. This places the Transformer between MoE and LSTM on peak-magnitude forecasting, but below both models on timing.
The statistical analysis again supports an asymmetric interpretation. Transformer peak performance remained significantly above baseline (95% CI [0.197, 0.704], p = 0.0106), but timing remained significantly below baseline (95% CI [-1.348, -0.360], p = 0.0013). Notably, the Transformer posted the strongest raw peak-error profile among the three DL models, but this did not translate into the strongest USS-based magnitude benchmark. Its weakest dimension remained timing, where USS_days was the lowest of the three architectures. See benchmark_significance_summary.csv.
A further point worth stating directly is that MoE’s numerical lead over LSTM and Transformer on USS_peak was not statistically decisive on this 20-stock holdout, whereas MoE’s timing result was significantly less poor than both comparison models. In pairwise paired tests, the MoE–LSTM timing gap was significant (p = 0.0145) and the MoE–Transformer timing gap was also significant (p = 0.0024), but pairwise peak differences were not. Refer to dl_pairwise_significance.csv, which is accessible through the link outlined at section “Unified Standardized Scores for DL Models and LLMs”.
Performance Evaluation of the LLM Benchmarks
As illustrated in section “Restricted-Context LLM Prompt Design and JSONL Input Configuration” figure 3, the LLM prompt requires a single JSON output containing pred_type, pred_peak_pct, and pred_peak_day, with pred_peak_day defined as the absolute trading-day index of the peak and pred_peak_pct defined as the decimal return relative to IPO. This makes the LLM outputs directly comparable to the same USS_days and USS_peak framework used for the deep learning models.
Across the nine model-temperature runs, all LLM settings achieved positive USS_peak, and eight of the nine also achieved positive USS_days, with Grok-4.20 at low temperature producing the strongest single point estimate (USS_peak = 0.9094, USS_days = 0.6174). Gemini 3.1 Pro was comparatively stable across temperatures, while OpenAI GPT-5.4 reasoning showed the greatest timing sensitivity to temperature.
The uncertainty analysis suggests a more careful interpretation than the current wording. On peak magnitude, all nine LLM runs were clearly above baseline in the holdout analysis. On timing, however, statistical support was not equally strong across all settings: the clearest timing gains were observed for Grok-4 low and Grok-4 medium, while several other timing intervals still overlapped zero. Therefore, it is claimed that the prompt-only LLM benchmark was consistently strong on peak magnitude and often strong on timing, with the most reliable timing gains concentrated in the strongest Grok-4.20 settings. Refer to benchmark_significance_summary.csv, which is accessible through the link outlined at section “Unified Standardized Scores for DL Models and LLMs”.
Discussion
Conclusion
- Overall Conclusion: The benchmark indicates that the feasibility of post-IPO forecasting is task-dependent rather than absolute. Using only the first 5 trading days after IPO, the models captured statistically meaningful signals for peak-magnitude prediction over the available first post-IPO month window, but robust expectation-based prediction of the peak day was not established. Accordingly, the central conclusion of this study is not that post-IPO prediction is universally feasible or infeasible, but that feasibility depends on which post-IPO outcome is being forecast and on the modeling configuration used. Within this shared benchmark, the Mixture-of-Experts model was the strongest deep learning architecture overall, achieving the highest peak-magnitude benchmark among the three deep learning families and the least poor timing benchmark among them. However, this comparison does not justify overclaiming MoE superiority. Although MoE remained the most balanced deep learning model, its numerical lead over LSTM and Transformer on peak magnitude was not statistically decisive on the 20-stock holdout. The strongest defensible claim is therefore narrower: MoE was the strongest overall deep learning benchmark under the revised protocol, especially because its timing result was significantly less poor than those of LSTM and Transformer, even though exact expectation-based timing remained unresolved.
- Deep Learning Conclusion: The Mixture-of-Experts model was the strongest deep learning architecture overall, achieving the highest peak-magnitude benchmark among the three deep learning families and the least poor timing benchmark among them. However, the results also show that the deep learning findings are asymmetric rather than uniformly positive. All three deep learning architectures improved significantly over the naïve baseline for peak-magnitude forecasting, but all three remained below baseline on the expectation-based timing benchmark. Accordingly, the finalized MoE benchmark should be interpreted primarily as a statistically supported peak-magnitude forecasting model rather than as a complete solution to exact peak-day prediction.
- LLM Conclusion: Under the matched restricted-context week-1 forecasting task, all nine model-temperature LLM runs achieved positive peak-magnitude skill, and eight of the nine also achieved positive timing skill on the same 20-stock holdout. The strongest single point estimate was produced by Grok-4.20 at low temperature. Therefore, the evidence no longer supports a simple “deep learning works, LLMs fail” interpretation. A more accurate conclusion is that early post-IPO price behavior contains real predictive signals, and that both specialized deep learning models and carefully constrained prompt-only LLM systems can extract part of that signal under a matched evaluation framework.
Insights and Implications
- Week-1 post-IPO behavior contains more forward-looking information about magnitude than about exact timing. This pattern appeared consistently across the experiments. The shared success of MoE, LSTM, Transformer, and the prompt-only LLM runs on peak magnitude suggests that the first week after listing already encodes useful information about the scale of near-term upside potential. By contrast, exact expectation-based peak-day prediction remained difficult for all deep learning architectures. This indicates that the near-term size of the move is easier to infer from early price behavior than the exact calendar location of the move.
- Timing problems should be interpreted more carefully than a single negative USS_days value might suggest. In the MoE benchmark, the modal peak-day error was much smaller than the expectation-based peak-day err or. This suggests that the model often placed its highest probability mass near the correct day, but that the full predictive distribution remained too diffuse for the expectation-based timing metric. In practical terms, the MoE behaves more like a peak-window detector than a precise day-calling engine. That distinction matters for both interpretation and deployment: the current model is better suited to identifying whether the peak is likely to arrive early or late within the available month window than to specifying a rigid exit day.
- MoE remained the strongest deep learning benchmark overall, but evidence suggests that its advantage comes more from balanced performance and task alignment than from overwhelming dominance on every metric. Transformer, for example, showed a stronger raw peak-error profile than its USS ranking alone might imply, whereas LSTM remained a meaningful but weaker comparison architecture. This makes the deep learning section stronger methodologically, because it now functions as an ablation-style comparison across sequence-model families under one common forecasting task.
- Structured prompting matters greatly for LLM benchmarking. The restricted-context prompt required a single JSON output containing pred_type, pred_peak_pct, and pred_peak_day, while constraining the model to the same week-1 information boundary used by the deep learning models. Under that design, prompt-only LLMs became meaningfully competitive with the specialized deep learning models and often stronger on peak magnitude. This does not imply that generic, unconstrained LLM use is automatically reliable for financial forecasting. Rather, it suggests that when the task is tightly specified, the context is identifier-masked, and the output structure is enforced, prompt-based analog reasoning can become a serious benchmark rather than a weak strawman. The LLM results therefore strengthen the paper conceptually by showing that the forecasting signal is not extractable only by specialized neural sequence models.
- The present study should still be read as a conditional case study under a specific market regime rather than as a general causal test of M2. M2 was used here as a market-regime classification framework that defined the macroeconomic environment under study, not as an observation-level predictive feature and not as a variable through which causal effects were identified. The results therefore support a narrower claim: forecasting post-IPO volatility patterns appears feasible under the historically unusual March 2022–September 2023 M2-contraction regime. They do not by themselves establish that M2 is a direct causal driver of the observed outcomes.
- From an investor perspective, the most practical implication is that the current benchmark is more useful for triage and sizing than for rigid date-specific trading. When week-1 behavior suggests unusually strong upside potential, the magnitude forecasts may help identify IPOs that merit closer monitoring. By contrast, the timing output should not yet be treated as a precise instruction for entry or exit on a specific day. A more realistic use case is to combine the model’s week-1 forecast with subsequent price updates, liquidity conditions, and fundamental or news-based judgment. Under that interpretation, the benchmark remains practically relevant even though exact expectation-based timing is still unresolved.
Limitations
- The study is intentionally regime-conditional. The sample was constructed around the M2-contraction period, and the final benchmark therefore measures forecasting feasibility under those conditions rather than universal post-IPO behavior across all liquidity regimes. Extending the analysis to a broader multi-regime panel would be necessary before drawing stronger claims about generalizability or about the value of including macroeconomic variables such as M2 directly in the model input space.
- The forecast horizon in the study is the available first post-IPO month window in the dataset, not a literal fixed 30-trading-day horizon. In the current files, this horizon varies slightly across firms and reaches up to 23 trading days. The study should therefore avoid wording that implies a strict 30-trading-day target when the implemented horizon is the available month-window recorded in the data.
- The untouched external holdout still contains only 20 IPOs. This is sufficient for a meaningful external benchmark and for holdout-level bootstrap and sign-flip inference, but it also limits the precision of pairwise architectural claims. That is one reason to avoid claiming that MoE has decisively solved the task or that its peak-magnitude advantage over all alternatives has been statistically established beyond doubt.
- The research studies only operating-company IPOs on NYSE and NASDAQ that satisfy the study’s scope criteria, including the exclusion of SPACs, ETFs, closed-end funds, similar non-operating vehicles, and low-priced offerings. The findings therefore should not be generalized automatically to smaller U.S. exchanges, OTC listings, or penny-stock-like IPOs, whose microstructure and liquidity dynamics differ materially.
- The LLM benchmark is intentionally narrow. It is a restricted-context, prompt-only benchmark with identifier-masked summaries, no retrieval, no web tools, no calculators, and no external demonstrations. These design choices are strengths for fair comparison with the deep learning models, but they also mean that the LLM results should be interpreted as evidence about one specific prompt-based forecasting regime rather than about the full space of possible LLM-finance systems. More guided prompts, tool-augmented inference, or hybrid numerical modules may produce different results.
- The present study does not provide an exhaustive comparison against traditional IPO forecasting baselines. Much of the prior IPO literature focuses on underpricing, first-day returns, or prospectus-based performance using methods such as random forests, multinomial logistic regression, and related supervised machine-learning approaches5,6,10,14. By contrast, this study examines a narrower task: predicting post-IPO peak timing and magnitude from only the first 5 trading days under the M2-contraction regime. Traditional statistical and simpler machine-learning baselines remain important adjacent comparators, but adapting them faithfully to this exact week-1-to-available-month-window target definition was outside the scope of the present revision.
- This study intentionally uses only the first 5 post-IPO trading days as input and therefore does not control for potentially relevant firm-level and macro-financial covariates, such as sector, firm age, offering size, VIX, market sentiment, or contemporaneous IPO activity. The results should therefore be interpreted as evidence of predictive signal under a restricted-information setup, not as a fully adjusted explanation of post-IPO outcomes.
Acknowledgements
I would like to express my sincere gratitude to Mr. Sim Joongwon for his invaluable guidance and mentorship throughout this research. His technical insights, methodological guidance, and consistent support were instrumental in overcoming key challenges and bringing this work to fruition.
References
- T. Loughran, J. R. Ritter. Why has IPO underpricing changed over time? SSRN Working Paper, 2002, https://doi.org/10.2139/ssrn.331780 [↩]
- M. Lowry, M. S. Officer, G. W. Schwert. The variability of IPO initial returns. NBER Working Paper 12295, 2006, revised 2007, https://doi.org/10.3386/w12295. [↩]
- P. Mackintosh. Trends in IPO pops. https://www.nasdaq.com/articles/trends-in-ipo-pops-2021-03-04, 2021. [↩]
- A. Levy. Figma’s stock slumps almost 20% after first earnings report to lowest since IPO. https://www.cnbc.com/2025/09/04/figma-stock-first-earnings-report.html, 2025. [↩]
- D. Pirayesh Neghab, M. Cevik, A. Basar. Identifying the factors influencing IPO underpricing using explainable machine learning techniques. Proceedings of the Canadian Conference on Artificial Intelligence. Canadian Artificial Intelligence Association, 2023, https://doi.org/10.21428/594757db.a1c96ea4. [↩] [↩]
- G. Colak, M. Fu, I. Hasan. Predicting IPO first-day returns: evidence from machine learning analyses. Journal of Banking & Finance. Vol. 178, pg. 107500, 2025, https://doi.org/10.1016/j.jbankfin.2025.107500. [↩] [↩] [↩]
- S. Ghosh, A. Maji, N. H. Vardhan, S. K. Naskar. Experimenting with multi-modal information to predict success of Indian IPOs. arXiv preprint arXiv:2412.16174, 2024, https://doi.org/10.48550/arXiv.2412.16174. [↩] [↩]
- R. Chaudhary. Advanced stock market prediction using long short-term memory networks: a comprehensive deep learning framework. arXiv preprint arXiv:2505.05325, 2025, https://doi.org/10.48550/arXiv.2505.05325. [↩]
- Q. Chen. Comparing different transformer model structures for stock prediction. arXiv preprint arXiv:2504.16361, 2025, https://doi.org/10.48550/arXiv.2504.16361. [↩]
- M. F. Alahmadi, M. T. Yilmaz. Prediction of IPO performance from prospectus using multinomial logistic regression, a machine learning model. Data Science in Finance and Economics. Vol. 5, pg. 105–135, 2025, https://doi.org/10.3934/DSFE.2025006. [↩] [↩]
- O. O. Ogunruku. Advanced deep learning approaches for forecasting financial market volatility. GSC Advanced Research and Reviews. Vol. 23, pg. 277–286, 2025, https://doi.org/10.30574/gscarr.2025.23.3.0163. [↩]
- P. H. Vuong, L. H. Phu, T. H. V. Nguyen, L. N. Duy, P. T. Bao, T. D. Trinh. A bibliometric literature review of stock price forecasting: from statistical model to deep learning approach. Science Progress. Vol. 107, pg. 368504241236557, 2024, https://doi.org/10.1177/00368504241236557. [↩]
- K. Bosko. IPO_bubble: scrape, clean and model IPO data with supervised ML. https://github.com/k-bosko/IPO_bubble, 2020. [↩]
- B. Baba, G. Sevil. Predicting IPO initial returns using random forest. Borsa Istanbul Review. Vol. 20, pg. 13–23, 2020, https://doi.org/10.1016/j.bir.2019.08.001. [↩] [↩]
- M. A. Kabir, M. R. Ahmed. Python for data analytics: a systematic literature review of tools, techniques, and applications. Academic Journal on Science, Technology, Engineering & Mathematics Education. Vol. 4, 2024, https://doi.org/10.69593/ajsteme.v4i04.146. [↩]
- I. Arawjo, C. Swoopes, P. Vaithilingam, M. Wattenberg, E. L. Glassman. ChainForge: a visual toolkit for prompt engineering and LLM hypothesis testing. https://arxiv.org/abs/2309.09128, 2023. [↩]
- R. Synek, J. Veselá. Cointegration analysis of stock indices and money supply M2 in selected countries. Statistika: Statistics and Economy Journal. Vol. 104, pg. 135–162, 2024, https://doi.org/10.54694/stat.2024.7. [↩]
- S. Hirota. Money supply, opinion dispersion, and stock prices. Journal of Economic Behavior & Organization. Vol. 212, pg. 1286–1310, 2023, https://doi.org/10.1016/j.jebo.2023.06.014. [↩]
- S. B. Carpenter, S. Demiralp. Money, reserves, and the transmission of monetary policy: does the money multiplier exist? Journal of Macroeconomics. Vol. 34, pg. 59–75, 2012, https://doi.org/10.1016/j.jmacro.2011.09.009. [↩]
- S. Li. A study on the relationship between monetary policy variables and stock market. International Journal of Business and Management. Vol. 13, pg. 218–224, 2018, https://doi.org/10.5539/ijbm.v13n1p218. [↩]
- M. D. Bauer, B. S. Bernanke, E. Milstein. Risk appetite and the risk-taking channel of monetary policy. Journal of Economic Perspectives. Vol. 37, pg. 77–100, 2023, https://doi.org/10.1257/jep.37.1.77. [↩]
- K. Khan, Q. Wang, A. Khurshid. Causal relationship between monetary policy and the stock market: a bootstrap rolling window approach. Financial Markets, Institutions and Risks. Vol. 1, pg. 5–15, 2017, https://doi.org/10.21272/fmir.1(4).5-15.2017. [↩]
- J. Barber. What is M2 money supply, and why should investors care? https://sjb-global.com/what-is-m2-money-supply-and-why-should-investors-care/, 2025. [↩]
- D. Shao, J. Ritter. Closed-end fund IPOs: sold, not bought. https://site.warrington.ufl.edu/ritter/files/2018/06/CEF_IPOs_June15_2018.pdf, 2018. [↩]
- D. J. Bradley, J. W. Cooney, S. D. Dolvin, B. D. Jordan. Penny stock IPOs. Financial Management. Vol. 35, pg. 5–29, 2006, https://doi.org/10.1111/j.1755-053X.2006.tb00129.x. [↩]
- Google AI for Developers. Gemini 3.1 Pro Preview. https://ai.google.dev/gemini-api/docs/models/gemini-3.1-pro-preview, 2026. [↩]
- OpenAI. Introducing GPT-5.4. https://openai.com/index/introducing-gpt-5-4/, 2026. [↩]
- xAI Docs. Grok 4.20 0309 Reasoning. https://docs.x.ai/developers/models/grok-4.20-0309-reasoning, 2026. [↩]