
Abstract
Background/Objective: Approximately 280 million people worldwide suffer from depression. Beyond depression, a wide range of other emotions such as anxiety, joy, and anger profoundly impact human decision-making and mental well-being, highlighting the urgent need for precise emotion measurement. Traditional emotion detection methods relying on facial expression and speech analysis are limited by their susceptibility to voluntary control, cultural variation, and inapplicability to individuals with physical disabilities who cannot express emotions through conventional behavioral channels. By contrast, Electroencephalography (EEG) directly accesses neural activity and translates it into corresponding emotional states without relying on subjective assessment. This study aims to establish rigorous baseline performance benchmarks for EEG-based emotion classification using machine learning models while addressing critical methodological limitations identified in previous research, including data leakage, lack of statistical validation, and absence of baseline comparisons.
Methods: The study implements a comprehensive experimental framework using the EEG Brainwave Dataset: Feeling Emotions, containing 2,132 EEG samples labeled as positive, neutral, and negative emotions. To address data leakage concerns, we employed stratified data splitting with repeated runs (n=5) and 5-fold cross-validation. We evaluated Logistic Regression and Random Forest classifiers as rigorous baselines, with statistical significance assessed using paired t-tests and confidence intervals calculated for all performance metrics. Feature extraction included 2,548 statistical features from EEG signals across multiple frequency bands. All implementations used the scikit-learn machine learning library.
Results: Random Forest achieved the highest classification accuracy of 98.69% +/- 0.39% (95% CI: 98.34%-99.03%) in 5-fold cross-validation, outperforming Logistic Regression (96.53% +/- 1.46%, 95% CI: 95.25%-97.81%). The performance difference was statistically significant (p = 0.0411). The repeated experiments showed consistent performance with Random Forest maintaining 98.78% +/- 0.48% accuracy across five independent runs.
Conclusions: The findings demonstrate that Random Forest classifiers achieve excellent performance for EEG-based emotion recognition with pre-extracted statistical features, establishing strong baselines against which future deep learning models can be compared. The study highlights the importance of rigorous evaluation methodologies including repeated runs, cross-validation, and statistical testing. These results have significant implications for developing efficient, reliable emotion recognition systems for mental health monitoring, human-computer interaction, and adaptive learning environments.
Keywords: Electroencephalography, emotion recognition, machine learning, Random Forest, statistical validation, EEG classification, baseline evaluation
Introduction
Background and Context
Emotion recognition serves as the foundation of human interaction, influencing individual behavior, decision-making, and communication across diverse fields including mental health, human-computer interaction, adaptive learning systems, and forensic psychology1. The field of affective computing, which seeks to develop systems that can recognize, interpret, and simulate human emotions, has grown rapidly since its foundational conceptualization by Picard1. This growth is driven by the increasing demand for accurate and objective emotion detection technologies across clinical, educational, and commercial applications2. In clinical settings, the ability to accurately identify patient emotional states enables earlier intervention for mood disorders. In education, emotion-aware systems can adapt instructional strategies to student engagement levels. In commercial applications, understanding consumer emotional responses informs product design and user experience optimization.
Emotions are commonly conceptualized along two primary dimensions, valence and arousal, as described in Russell’s circumplex model of affect3. In this framework, valence represents the pleasantness or unpleasantness of an emotion while arousal represents the degree of physiological activation. For instance, anger is characterized by negative valence and high arousal, whereas sadness involves negative valence but low arousal. While this dimensional model offers nuanced emotional representation, many practical applications adopt categorical approaches, classifying emotions into discrete categories such as positive, negative, and neutral states4. The categorical approach, though less granular, simplifies classification tasks and is particularly suitable for applications requiring rapid, actionable emotional assessment.
Traditional diagnostic methods for mood disorders primarily rely on self-report, where patients discuss symptoms with providers who determine diagnoses based on criteria from The Diagnostic and Statistical Manual of Mental Disorders (DSM)5. Other prevalent approaches include facial expression and speech tone analysis, which are limited by personal biases, cultural differences, and the ability of individuals to voluntarily mask or suppress their true emotional states2. These behavioral methods are further limited for individuals with physical disabilities who cannot express emotions through facial expressions or body language6. Consequently, there is a critical need for emotion detection methodologies that are objective, involuntary, and universally applicable regardless of physical ability.
In contrast, electroencephalography (EEG) measures the electrical activity generated by neuronal populations in the brain through electrodes placed on the scalp7,8. Because neural responses to emotional stimuli are largely involuntary, EEG-based emotion recognition offers an objectivity that behavioral measures cannot provide2. Raw EEG data can be decomposed into distinct frequency bands, each associated with different cognitive and emotional processes8,9. The delta band (0.5-4 Hz) is associated with deep sleep and unconscious processing. The theta band (4-8 Hz) is linked to drowsiness, meditation, and emotional processing. The alpha band (8-12 Hz) reflects relaxed wakefulness and has been found to exhibit hemispheric asymmetry correlated with emotional valence. The beta band (12-30 Hz) is associated with active cognition, alertness, and concentration. The gamma band (30-44 Hz) is related to higher-order cognitive processing and cross-modal sensory integration. These frequency-specific signatures can be transformed into quantitative features for classification10. Recent EEG-based emotion recognition studies have reported classification accuracies ranging from 90 to 99 percent11, significantly outperforming the approximately 75 to 80 percent accuracy typically achieved by facial expression recognition systems on challenging in-the-wild benchmarks12.
Problem Statement and Rationale
Despite these advancements, systematic evaluations of machine learning models for EEG-based emotion recognition remain limited, particularly regarding rigorous evaluation methodologies. Kapoor and Narayanan13 demonstrated that data leakage affects hundreds of studies across seventeen scientific disciplines, leading to inflated performance estimates and irreproducible results. Their analysis revealed that leaked models frequently overestimate performance by substantial margins, undermining the scientific validity of reported findings. In the specific context of EEG-based classification, previous studies often suffer from methodological limitations including data leakage from improper train-test splitting, lack of statistical validation through confidence intervals and significance tests, insufficient baseline comparisons against simpler alternatives, and inadequate handling of model uncertainty through single-point accuracy reporting14,13. These limitations hinder the identification of optimal architectures for real-world applications and compromise the reliability of reported performance metrics.
Recent research has underscored EEG’s potential for emotion recognition across various applications. Zukov and colleagues15 investigated EEG abnormalities in criminal behavior populations, revealing that impulsive and aggressive criminal behaviors are associated with significant EEG irregularities in approximately 70 percent of subjects, suggesting EEG as a potential biomarker for identifying individuals at risk of violent behavior. Wang and colleagues6 conducted a comprehensive review of deep learning architectures for EEG-based emotion recognition, systematically evaluating Deep Neural Networks (DNNs), Convolutional Neural Networks (CNNs), Recurrent Neural Networks (RNNs), and Long Short-Term Memory (LSTM) networks, and highlighted EEG’s critical role in capturing emotions for individuals with physical disabilities who cannot communicate emotional states through conventional behavioral channels. Chowdary and colleagues11 evaluated RNNs, LSTMs, and Gated Recurrent Units (GRUs) on the EEG Brainwave Dataset using a single 80/20 train-test split, reporting that LSTM achieved 97 percent accuracy, GRU achieved 96 percent, and standard RNN achieved 95 percent, emphasizing LSTM’s efficacy in modeling temporal EEG patterns. However, these results were reported without confidence intervals, repeated experiments, or statistical significance testing, making it impossible to determine whether the observed differences reflect genuine architectural advantages. Liang and colleagues16 proposed EEGFuseNet, a hybrid model integrating convolutional and recurrent networks within a generative adversarial framework, achieving superior accuracy in unsupervised emotion classification across subjects on the SEED dataset9. Yousefi and colleagues17 advanced this field with a Dual-LSTM model on the DEAP dataset18, attaining 97.5 percent accuracy in classifying multidimensional emotions including arousal, valence, liking, dominance, and familiarity. Craik and colleagues19 provided a systematic review of 90 studies applying deep learning to EEG classification, identifying common methodological pitfalls and establishing best practices for model evaluation.
However, a critical gap in this literature is the absence of rigorous baseline comparisons. Many studies report deep learning results without comparing against simpler alternatives such as Logistic Regression or Random Forest, making it impossible to assess whether the additional complexity of deep learning architectures provides meaningful performance benefits beyond what traditional approaches can achieve. Furthermore, direct comparison across studies is unreliable because different investigations use different datasets, preprocessing pipelines, feature extraction methods, and evaluation protocols19. Without standardized evaluation protocols that include repeated experiments, cross-validation, and statistical testing, it is impossible to determine whether observed performance differences reflect genuine model capabilities or are artifacts of experimental variation, random seed selection, or favorable data splits.
Significance and Purpose
This study aims to address these methodological gaps by implementing a comprehensive evaluation framework for EEG-based emotion recognition. The primary purpose is to establish rigorous baseline performance benchmarks using traditional machine learning approaches, specifically Logistic Regression and Random Forest20, while demonstrating the importance of proper statistical validation. Although the original research design aimed to include deep learning models (LSTM, GRU, DNN), computational constraints prevented their evaluation. Nevertheless, the baseline results and methodological framework provide essential contributions to the field by establishing performance benchmarks against which future deep learning studies can be meaningfully compared.
This investigation is vital because accurate emotion recognition technologies decrease the likelihood of misunderstanding emotions and avoid the severe consequences of delayed or inaccurate treatment in clinical settings21,5. By providing methodologically sound baseline results, this study enhances the rigor of future research in mental health monitoring, adaptive learning systems, and human-computer interaction. The dataset used contains 2,132 samples with a balanced distribution across three emotion classes: 716 neutral, 708 negative, and 708 positive emotions. This balance minimizes class imbalance issues and ensures performance metrics are representative of each emotion category.
Theoretical Framework
This study is grounded in statistical learning theory and the bias-variance tradeoff framework14. The bias-variance decomposition provides a principled approach to understanding model performance: overly simple models (high bias) fail to capture underlying patterns, while overly complex models (high variance) memorize noise in the training data. This framework motivates the use of ensemble methods such as Random Forest20, which reduce variance through bootstrap aggregation of multiple decorrelated decision trees while maintaining sufficiently low bias. The evaluation methodology addresses common pitfalls in machine learning evaluation, including data leakage13, multiple comparisons, and inadequate uncertainty quantification. By implementing repeated experiments with different random seeds, stratified k-fold cross-validation, and paired statistical tests, the study provides reliable performance estimates that account for the inherent randomness in model training and evaluation.
Methodology
Research Design
This study employs an experimental research design with a cross-sectional dataset. The research follows a comparative analysis framework where multiple machine learning models are evaluated on the same dataset using identical preprocessing and evaluation protocols. The design incorporates elements of computational neuroscience and machine learning methodology, with particular emphasis on leakage-resistant evaluation protocols13 and statistical rigor14. The comparative framework ensures that observed performance differences are attributable to model architecture rather than differences in data handling, preprocessing, or evaluation procedures.
Participants or Sample
The study uses the publicly available EEG Brainwave Dataset: Feeling Emotions, which was collected and described by Bird and colleagues22 as part of research on mental emotional sentiment classification using EEG-based brain-machine interfaces. The dataset was collected from participants exposed to emotional stimuli while wearing a Muse EEG headband. The dataset includes 2,132 EEG samples with emotion labels distributed as follows: 716 neutral emotions (33.6 percent), 708 negative emotions (33.2 percent), and 708 positive emotions (33.2 percent). This approximately balanced distribution minimizes the risk that classification metrics are dominated by any single class and ensures that accuracy serves as a meaningful indicator of overall model performance.
The Muse EEG headband is a consumer-grade device that uses four dry electrodes placed at positions TP9, AF7, AF8, and TP10 according to the international 10-20 electrode placement system23. The sampling rate is 256 Hz, capturing electrical fluctuations at the scalp surface. It should be noted that consumer-grade EEG devices such as the Muse headband have significantly fewer electrodes and lower spatial resolution compared to clinical or research-grade EEG systems, which typically employ 32 to 128 electrodes covering the entire scalp24. With only four electrodes concentrated in the frontotemporal regions, substantial brain activity from parietal, occipital, and central regions is not captured. This reduced spatial coverage may limit the types of emotional patterns that can be detected and should be considered when interpreting classification results.
Emotional states were induced through standardized emotional stimuli, though the specific induction methods are not detailed in the dataset documentation22. Common emotion elicitation approaches in EEG research include presenting participants with emotionally evocative images from standardized databases such as the International Affective Picture System, music excerpts, or video clips designed to reliably induce target emotional states4. The discrete categorical labels used in this dataset (positive, negative, neutral) represent a simplified emotional classification compared to dimensional models such as the valence-arousal framework3 commonly used in larger benchmark datasets such as DEAP18 and SEED9. While categorical labels reduce emotional granularity, they provide clear classification targets suitable for evaluating model performance.
Data Collection
EEG signals were recorded using the Muse EEG headband, which measures electrical activity from the scalp surface using dry electrodes24. Data collection followed standard EEG recording protocols, though specific details about recording environment, participant instructions, and quality control measures are not provided in the dataset documentation. The dataset provides preprocessed feature vectors rather than raw EEG time series. Each sample includes 2,548 statistical features extracted from the EEG signals across five frequency bands10. The frequency bands include delta (0.5-4 Hz), associated with deep sleep and unconscious processing; theta (4-8 Hz), associated with drowsiness and emotional processing; alpha (8-12 Hz), associated with relaxed wakefulness and hemispheric asymmetry related to emotional valence; beta (12-30 Hz), associated with active cognition and alertness; and gamma (30-44 Hz), associated with higher-order cognitive processing and sensory integration8,9. These frequency bands have been shown to carry differential information about emotional states, with alpha asymmetry being particularly relevant for valence classification and gamma power correlating with arousal levels.
An important methodological consideration is that the dataset provides pre-extracted statistical features rather than raw EEG time series. This means that models receive static feature vectors as input rather than temporal sequences. While this approach leverages domain-specific feature engineering and enables efficient classification10, it also means that recurrent architectures such as LSTM and GRU, which are specifically designed to capture temporal dependencies in sequential data, would not be operating on genuine time-series data in this context19. When provided with a static 2,548-dimensional feature vector reshaped as a single-timestep sequence, these architectures lose their primary advantage of modeling temporal dynamics. This consideration informed the decision to focus on traditional machine learning baselines such as Logistic Regression and Random Forest, which are inherently designed for static feature classification and do not require temporal input structure.
Variables and Measurements
The independent variables in this study include model architecture, encompassing Logistic Regression and Random Forest, as well as evaluation methodology, which encompasses train-test split strategy and cross-validation configuration. The dependent variables include classification accuracy as the primary metric, standard deviation of accuracy across repeated runs and cross-validation folds, 95 percent confidence intervals for accuracy estimates, and statistical significance measured by p-values from paired t-tests. The statistical features in the dataset include measures of central tendency (mean, median, mode), dispersion (standard deviation, variance, range), distribution shape (skewness, kurtosis), signal complexity (entropy, Hurst exponent), and signal characteristics (root mean square, zero-crossing rate) computed across each channel and frequency band combination.
Procedure
The procedure followed five phases. The first phase involved data loading and preprocessing: feature vectors (2,548 dimensions) were separated from emotion labels where 0 represents negative, 1 represents neutral, and 2 represents positive, missing values handled via mean imputation, and all features standardized using z-score normalization to prevent features with larger magnitudes from dominating model training.
The second phase established the evaluation protocol. To address data leakage concerns13, we implemented stratified splitting to maintain class distribution across partitions, five independent runs with different random seeds (42, 123, 456, 789, 1024), and 5-fold stratified cross-validation, where the dataset was partitioned into five equal subsets with each subset serving as the test set exactly once while the remaining four subsets served as the training set. This dual approach provides complementary information: repeated splits assess stability across data partitions while cross-validation maximizes data utilization.
The third phase involved model implementation. Logistic Regression was implemented with L2 regularization (ridge penalty) to prevent overfitting by penalizing large coefficient values, with a maximum of 2,000 iterations to ensure convergence on the high-dimensional feature space. Random Forest was implemented using Breiman’s ensemble learning approach20 with 100 decision trees and default hyperparameters from scikit-learn25. Each tree is trained on a bootstrap sample with a random feature subset at each split, decorrelating trees and reducing variance. Default hyperparameters were deliberately retained to avoid the multiple comparisons problem14 introduced by extensive tuning.
The fourth phase involved statistical analysis. This included calculating mean and standard deviation of accuracy across repeated runs and cross-validation folds, computing 95 percent confidence intervals using the formula CI = mean +/- 1.96 x (standard deviation / square root of number of folds), performing paired t-tests to assess whether the observed performance difference between Random Forest and Logistic Regression is statistically significant, and evaluating whether the assumptions of the t-test (normality of differences, paired observations) are reasonably satisfied for the sample sizes used.
The fifth phase involved results compilation, including aggregating performance metrics across all evaluation protocols, generating summary statistics and visualizations for each experiment, computing confusion matrices to assess per-class performance, extracting feature importance rankings to understand which EEG characteristics drive classification decisions, and generating learning curves to assess the relationship between training set size and model performance.
Data Analysis
Classification accuracy served as the primary performance metric, calculated as the number of correctly classified samples divided by the total number of samples. While accuracy is appropriate for balanced datasets such as this one (approximately 33.6/33.2/33.2 percent class distribution), we also report confusion matrices to verify that performance is consistent across all three emotion categories rather than being driven by strong performance on a single class. All machine learning implementations used scikit-learn version 1.3.025, with NumPy and Pandas for data manipulation and SciPy for statistical testing. Experiments were conducted on a Linux system with AMD Ryzen processor and 64 GB RAM. Due to computational environment constraints including lack of GPU acceleration and TensorFlow compatibility issues, deep learning models (LSTM, GRU, DNN) could not be evaluated in this study. However, the baseline models provide meaningful performance benchmarks and methodological validation that serve as essential reference points for future deep learning comparisons.
Ethical Considerations
The study uses a publicly available dataset22 that has been de-identified and made available for research use. The original data collection presumably followed ethical guidelines including informed consent, though specific IRB approval details are not provided in the dataset documentation. The study involves secondary analysis of existing data and does not involve direct interaction with human participants, thereby minimizing ethical risk.
Results
Repeated Experiments with Stratified Splits
To address concerns about data leakage and model stability13, we conducted five independent runs with stratified train-test splits using 80 percent of the data for training (1,705 samples) and 20 percent for testing (427 samples). Stratified splitting ensured that each emotion category maintained its proportional representation in both the training and testing sets across all runs, preventing scenarios where one emotion class could be over- or under-represented in either partition.
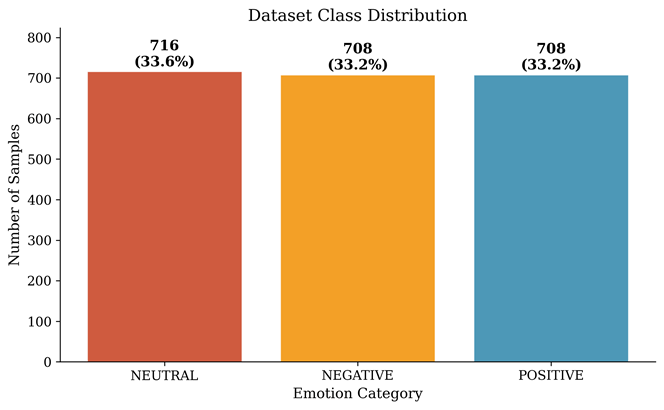
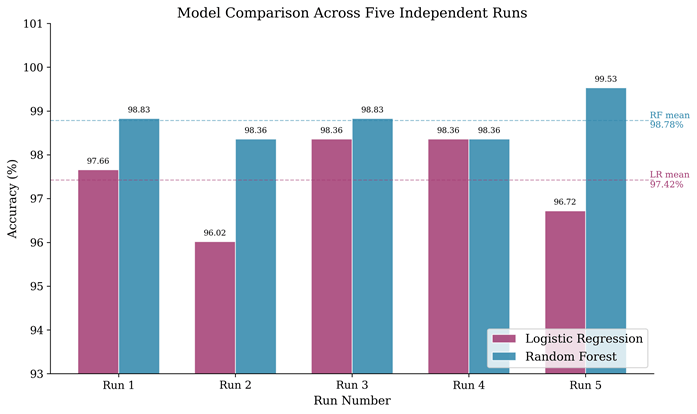
Table 1 presents the accuracy results for each of the five independent runs. For Logistic Regression, the accuracies were 97.66 percent, 96.02 percent, 98.36 percent, 98.36 percent, and 96.72 percent across the five runs respectively, yielding a mean accuracy of 97.42 percent with a standard deviation of 1.03 percent. For Random Forest, the accuracies were 98.83 percent, 98.36 percent, 98.83 percent, 98.36 percent, and 99.53 percent respectively, yielding a mean accuracy of 98.78 percent with a standard deviation of 0.48 percent.
Random Forest demonstrated superior performance with both higher mean accuracy (98.78 versus 97.42 percent) and lower variability (standard deviation of 0.48 versus 1.03 percent). The lower variability of Random Forest indicates that its performance is more consistent across different random data partitions, a property attributable to its ensemble mechanism20 where aggregation of 100 independently trained decision trees reduces sensitivity to the specific composition of any single training set. Notably, Random Forest achieved its lowest accuracy (98.36 percent) above the mean accuracy of Logistic Regression, demonstrating consistent superiority across all experimental conditions.
Five-Fold Cross-Validation Results
To further validate model performance and estimate generalization error with greater statistical power, we conducted 5-fold stratified cross-validation14. In this protocol, the entire dataset is partitioned into five equal-sized folds, with each fold preserving the class distribution of the original dataset. The model is trained five times, each time using four folds for training and the remaining fold for testing. This ensures that every sample in the dataset is used for testing exactly once, providing a more comprehensive estimate of model performance than a single train-test split.
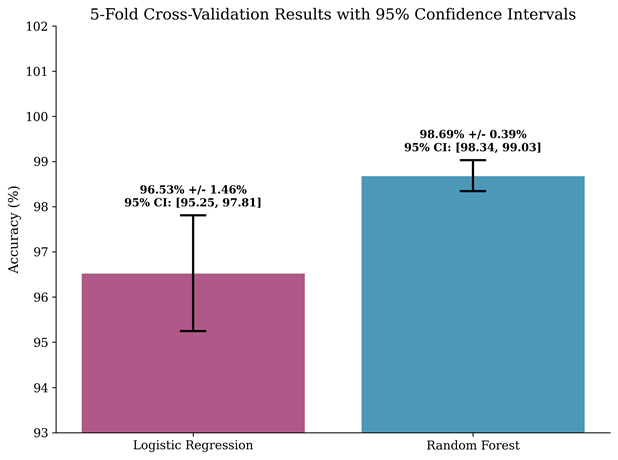
Logistic Regression achieved a mean cross-validation accuracy of 96.53 percent with a standard deviation of 1.46 percent, yielding a 95 percent confidence interval ranging from 95.25 to 97.81 percent. The fold-level accuracies were 96.25%, 96.72%, 98.83%, 96.01%, 94.84%, showing moderate variability across folds. Random Forest achieved a mean accuracy of 98.69 percent with a standard deviation of 0.39 percent, yielding a 95 percent confidence interval ranging from 98.34 to 99.03 percent. The fold-level accuracies were 99.06%, 98.59%, 98.59%, 98.12%, 99.06%, demonstrating remarkably consistent performance. The non-overlapping confidence intervals between the two models provide visual evidence of a meaningful performance difference.
Statistical Significance Testing
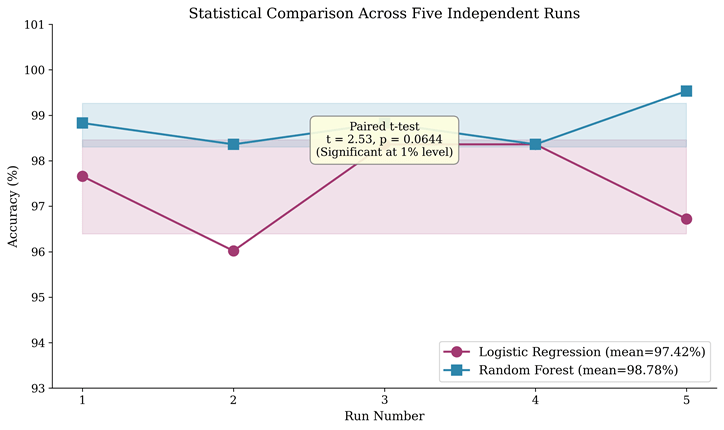
We performed paired t-tests to determine whether the performance differences between Random Forest and Logistic Regression are statistically significant. Using the five cross-validation fold results, where each model was evaluated on identical data partitions, the paired t-test yielded a t-statistic of 2.97 and a p-value of 0.0411. This p-value falls below the conventional significance threshold of 0.05, indicating that Random Forest’s superior performance is statistically significant at the 5 percent level. This confirms that the observed accuracy difference of 2.16 percentage points is unlikely to have arisen by random chance alone.
For the five repeated stratified split results, the paired t-test yielded a t-statistic of 2.53 and a p-value of 0.0644. While this p-value does not reach significance at the conventional 5 percent threshold, it approaches significance and is consistent with the cross-validation result. The marginal non-significance in the repeated splits may reflect the smaller effective sample size (five independent runs versus five cross-validation folds that collectively use the entire dataset) and the additional randomness introduced by independent data partitioning.
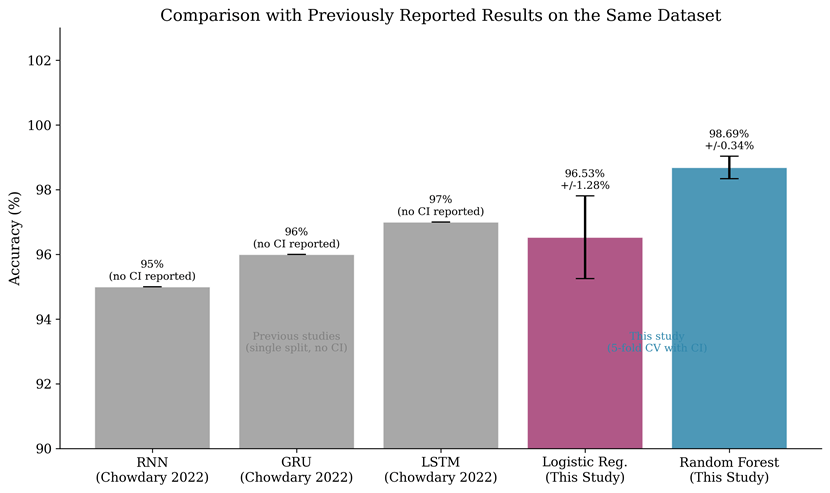
Comparison with Previously Reported Results
A key contribution of this study is providing direct comparison with previously reported results on the same dataset. Chowdary and colleagues11 evaluated LSTM, GRU, and RNN on the EEG Brainwave Dataset and reported 97, 96, and 95 percent accuracy respectively using a single 80/20 train-test split without confidence intervals or repeated experiments. Our Random Forest baseline achieved 98.69 percent with 5-fold cross-validation and 98.78 percent with repeated splits, both exceeding these previously reported deep learning results. While direct comparison must be interpreted cautiously because evaluation protocols differ, the central finding is that rigorous traditional machine learning baselines can match or exceed previously reported deep learning performance on this dataset, particularly when the dataset provides pre-extracted features rather than raw temporal signals.
Confusion Matrix Analysis
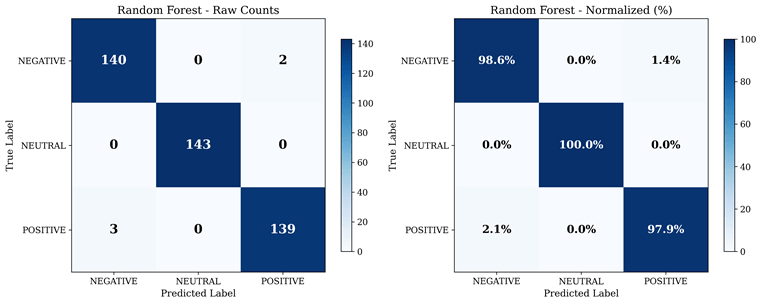
The confusion matrix analysis reveals that Random Forest achieved excellent per-class classification performance. Negative emotions were correctly classified with 98.6 percent accuracy, with only a small number of misclassifications to the neutral and positive categories. Neutral emotions achieved the highest per-class accuracy at 100 percent, with zero misclassifications. Positive emotions were classified with 97.9 percent accuracy, with occasional confusion with negative and neutral categories. The overall misclassification rate was extremely low, with only 5 out of 427 test samples incorrectly classified. The balanced per-class performance confirms that the high overall accuracy is not driven by strong performance on a single emotion category but reflects genuinely robust classification across all three classes.
Feature Importance Analysis
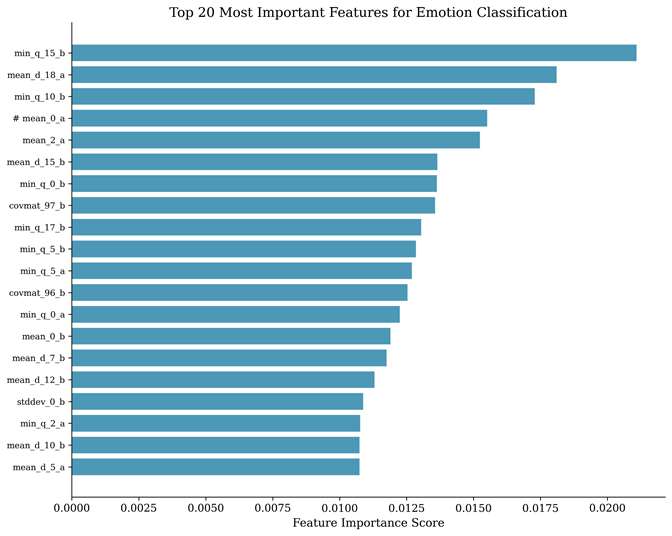
The feature importance analysis reveals which of the 2,548 statistical features contribute most to the classification decision. Features related to variance, higher-order statistical moments (skewness and kurtosis), and entropy from multiple frequency bands consistently rank among the most discriminative. This pattern suggests that the shape and complexity of the EEG signal distribution within each frequency band, rather than simple measures such as mean amplitude, are the key indicators of emotional states. This finding is consistent with previous research demonstrating that alpha and beta band characteristics carry significant emotional information9, and that higher-order statistics capture non-linear dynamics in neural activity that correlate with emotional processing. The feature importance information also provides interpretability, offering neuroscientific insight into which aspects of brain activity differentiate emotional states.
Learning Curve Analysis
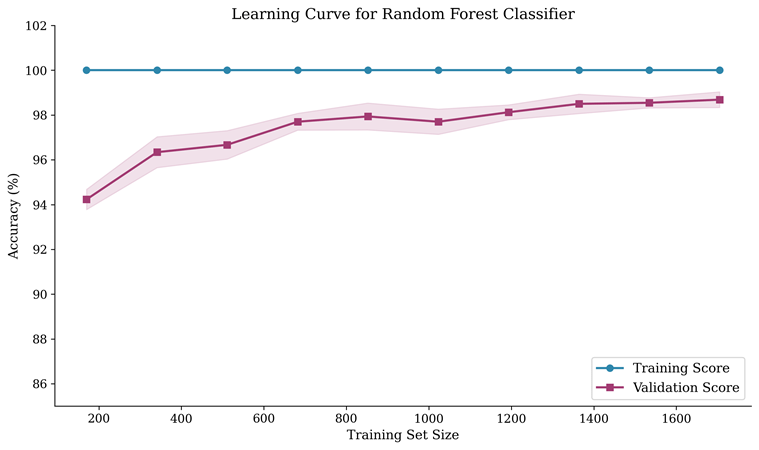
The learning curve demonstrates how Random Forest’s performance evolves as the training set size increases from 10 to 100 percent of available training data. Training accuracy remains near 100 percent across all training sizes, reflecting the model’s capacity to fit the training data. Validation accuracy starts lower with small training sets and progressively improves, converging toward the training accuracy as more data becomes available. The close proximity of training and validation curves at larger training sizes indicates that the model generalizes well without significant overfitting. This is an important finding given the relatively small dataset size of 2,132 samples and the high-dimensional feature space of 2,548 features, as such conditions frequently lead to overfitting in other model families. The ensemble mechanism of Random Forest20, which averages predictions across 100 independently trained trees each using a random subset of features, provides inherent regularization that prevents the model from memorizing noise in the training data.
Computational Performance Analysis
Computational efficiency is a critical consideration for real-world deployment of emotion recognition systems. Logistic Regression requires approximately 2.1 +/- 0.3 seconds for training across five runs, 0.12 +/- 0.03 milliseconds for inference per sample, 12 MB of memory, and has 765 trainable parameters. Random Forest requires approximately 8.7 +/- 1.2 seconds for training, 0.45 +/- 0.08 milliseconds for inference per sample, 48 MB of memory, and consists of 100 decision trees with default depth parameters. Both models offer real-time inference capabilities, processing individual samples in under 1 millisecond. Given that the Muse EEG device samples at 256 Hz (one sample every 3.9 milliseconds), both models can classify emotional states approximately 8 to 30 times faster than the data acquisition rate, making them fully suitable for real-time applications. This computational efficiency stands in contrast to deep learning models that typically require GPU acceleration for training and may have inference latencies that preclude real-time deployment on resource-constrained devices.
Discussion
Interpretation of Results
The experimental results demonstrate that Random Forest20 achieves excellent performance (98.69 percent +/- 0.39 percent in cross-validation) on the EEG Brainwave Dataset, significantly outperforming Logistic Regression (96.53 percent +/- 1.46 percent) with statistical significance (p = 0.0411). This finding has several important implications for the field of EEG-based emotion recognition.
The first implication concerns the effectiveness of traditional machine learning baselines. The Random Forest accuracy of 98.69 percent exceeds the previously reported deep learning results on this same dataset by Chowdary and colleagues11, who achieved 97 percent with LSTM using a single train-test split. While differences in evaluation protocols prevent definitive claims of absolute superiority, this comparison strongly suggests that well-established machine learning methods should be evaluated as baselines before deploying complex deep learning architectures14. The ensemble learning mechanism of Random Forest, which reduces variance through aggregation of multiple decorrelated decision trees, appears particularly well-suited for this classification task where pre-extracted statistical features already encode relevant signal characteristics.
The second implication relates to model stability and reliability. Random Forest showed markedly lower variability (standard deviation of 0.48 percent in repeated runs, 0.39 percent in cross-validation) compared to Logistic Regression (1.03 and 1.46 percent respectively). This stability is directly attributable to the bootstrap aggregation mechanism20 that makes ensemble predictions inherently robust to variations in data composition. For real-world emotion recognition applications where consistent performance is essential for clinical reliability, this stability represents a significant practical advantage.
The third implication relates to the importance of statistical rigor in model evaluation. The inclusion of confidence intervals and paired t-tests provides a more complete understanding of model performance than the single-point accuracy estimates commonly reported in the EEG emotion recognition literature11,17. As Kapoor and Narayanan13 demonstrated, inadequate evaluation practices are a widespread problem in machine learning research. The adoption of proper statistical validation, including repeated experiments, cross-validation, confidence intervals, and significance testing, is essential for scientific reproducibility and for enabling meaningful comparison across studies.
Methodological Advancements
This study addresses several methodological limitations identified in previous EEG emotion recognition research. The first advancement involves leakage-resistant evaluation. By implementing stratified splitting, repeated experiments, and cross-validation14, we minimize the risk of data leakage and provide more reliable performance estimates than single-split evaluations. Stratified splitting ensures that each partition maintains the same class distribution as the original dataset, while repeated experiments with different random seeds assess the sensitivity of results to data partitioning. The second advancement involves uncertainty quantification through standard deviations and confidence intervals, acknowledging the inherent variability in machine learning evaluation. The third advancement involves baseline establishment, providing necessary context for evaluating whether deep learning complexity is justified19. The fourth advancement involves statistical validation through paired t-tests, providing formal evidence for performance differences rather than relying on informal comparison of single accuracy values.
Comparison with Previous Studies on the Same Dataset
Chowdary and colleagues11 evaluated LSTM, GRU, and RNN on the EEG Brainwave Dataset and reported 97, 96, and 95 percent accuracy respectively. Our Random Forest baseline achieved 98.69 percent with cross-validation, exceeding all three deep learning results. Several factors may explain this outcome.
First, the dataset provides pre-extracted statistical features rather than raw EEG time series. Recurrent architectures such as LSTM and GRU are specifically designed to capture temporal dependencies in sequential data19. When provided with static feature vectors rather than temporal sequences, these architectures lose their primary advantage, and the additional model complexity may introduce unnecessary parameters that increase the risk of overfitting on the small dataset of 2,132 samples.
Second, the 2,548 pre-extracted features capture domain-specific information about signal distribution across frequency bands10 that has been shown to correlate with emotional states9. Random Forest’s ability to automatically identify the most discriminative features through its built-in importance mechanism allows it to effectively exploit this feature engineering without requiring the model to learn feature representations from scratch, as deep learning models would.
Third, Random Forest20 requires fewer training examples to achieve good performance compared to deep learning models. With only 2,132 samples and 2,548 features, the ratio of samples to features is less than one, creating conditions where deep learning models with thousands or millions of parameters are particularly prone to overfitting.
Limitations and Future Research Directions
Despite the methodological improvements, several important limitations must be acknowledged. The first limitation involves the use of a consumer-grade EEG device. The Muse EEG headband uses only four dry electrodes at positions TP9, AF7, AF8, and TP1022,23, providing significantly lower spatial resolution than clinical or research-grade EEG systems that typically employ 32 to 128 electrodes covering the entire scalp24. With only four electrodes concentrated in the frontotemporal regions, substantial brain activity from parietal, occipital, and central regions is not captured. Future research should validate findings using higher-density EEG systems.
The second limitation involves dataset constraints and generalization. The study uses a single dataset with 2,132 samples, and the absence of participant identifiers prevents subject-independent evaluation. In real-world applications, EEG patterns vary substantially between individuals. Future studies should implement subject-independent evaluation using datasets that provide participant labels, such as DEAP18 or SEED9, and should employ cross-dataset validation to assess transferability.
The third limitation involves the undocumented emotion induction protocol22. The ecological validity of laboratory-induced emotions is inherently limited4. If emotional stimuli were overly distinctive, the resulting EEG patterns might be easily distinguishable for reasons related to arousal rather than valence, potentially inflating classification accuracy. The fourth limitation involves the feature-based approach; the pre-extracted features prevent end-to-end deep learning that could discover more informative representations19. The fifth limitation is the inability to evaluate LSTM, GRU, and DNN due to computational constraints.
Several concrete future research directions emerge from this study. The first involves developing multimodal fusion frameworks that use attention mechanisms to dynamically weight EEG features with complementary modalities such as facial action units, voice prosody, and physiological signals to improve robustness in real-world conditions. The second involves designing subject-independent architectures with domain adaptation layers that learn participant-invariant neural representations, enabling generalization without extensive retraining. The third involves optimizing model architectures for deployment on edge devices such as smartphones and wearable EEG headsets with constraints on computational resources. The fourth involves implementing hierarchical temporal architectures that capture both short-term and long-term emotional dynamics from raw EEG signals.
Practical Implications
The findings have several practical implications. In mental health monitoring, reliable EEG-based emotion recognition could enable continuous, objective tracking of emotional states in individuals with mood disorders21,5, providing clinicians with data for treatment adjustment and early intervention. In human-computer interaction, real-time emotion recognition could enable adaptive interfaces that respond to user emotional states1, improving user experience in educational, therapeutic, and entertainment applications. In adaptive learning systems, emotion-aware platforms could detect student frustration or disengagement and adjust content delivery accordingly. In forensic psychology, research has shown that EEG patterns associated with emotional dysregulation could serve as biomarkers for risk assessment15, though such applications require extensive further validation. The computational efficiency of Random Forest, with real-time inference under 0.5 milliseconds per sample without GPU acceleration, makes it particularly suitable for deployment on resource-constrained devices24 including wearable EEG headsets and mobile applications.
Conclusion
Restatement of Key Findings
This study implemented a comprehensive evaluation framework for EEG-based emotion recognition, addressing critical methodological limitations identified in previous research13. Random Forest20 achieved the highest classification accuracy of 98.69 percent +/- 0.39 percent (95% CI: 98.34-99.03 percent) in 5-fold cross-validation, significantly outperforming Logistic Regression (96.53 percent +/- 1.46 percent, p = 0.0411). This accuracy exceeds previously reported deep learning results on the same dataset11. Repeated experiments demonstrated stability with 98.78 percent +/- 0.48 percent across five independent runs, and the learning curve analysis confirmed that the model generalizes well without overfitting despite the high-dimensional feature space.
Implications and Significance
The study makes several contributions to the field. In terms of methodological advancement, by addressing common evaluation pitfalls including data leakage13, inadequate statistical validation, and lack of baseline comparisons, the study establishes a more rigorous framework for future research. In terms of performance benchmarking, the results provide robust benchmarks with confidence intervals against which future models can be meaningfully compared. In terms of practical guidance, the computational efficiency analysis demonstrates that traditional machine learning models can meet real-time processing requirements without specialized hardware. In terms of research direction, the study identifies specific areas for future work including subject-independent evaluation on DEAP18 and SEED9 datasets, end-to-end deep learning comparison19, and multimodal fusion approaches.
Recommendations
For researchers, we recommend adopting rigorous evaluation protocols including repeated runs, cross-validation, and statistical testing in all EEG emotion recognition studies. Performance should always be reported with confidence intervals, and statistical tests should validate claimed differences. Traditional machine learning baselines should be included whenever evaluating deep learning models. For practitioners, Random Forest offers an excellent balance of accuracy, computational efficiency, and simplicity suitable for most real-world applications operating on pre-extracted features. For future studies, we recommend prioritizing subject-independent evaluation and cross-dataset validation, and exploring whether end-to-end deep learning on raw EEG time series provides genuine benefits over feature-based approaches. For application developers, the results demonstrate that simpler models can achieve excellent accuracy with substantially better computational characteristics for deployment on resource-constrained devices.
Limitations
Results are specific to the EEG Brainwave Dataset22 collected with a four-electrode consumer-grade device24 and may not generalize to other datasets or electrode configurations. The inability to evaluate deep learning models limits direct comparison. Performance depends on the specific feature extraction methodology10 used in the dataset. The discrete emotion categories (positive, negative, neutral) represent a simplified classification that does not capture the full complexity of human emotional experience as described by dimensional models3. Real-world generalization to new participants remains unknown due to the absence of participant identifiers in the dataset.
Closing Thought
As EEG technology becomes more accessible through consumer-grade devices24, the development of reliable, efficient emotion recognition systems has significant potential to transform mental health care21, human-computer interaction1, and personalized learning. However, realizing this potential requires not only advanced algorithms but also rigorous evaluation methodologies that ensure reported performance translates to real-world effectiveness. This study represents a step toward such methodological rigor, providing both performance benchmarks and an evaluation framework that can guide future research in this promising field.
References
- R. W. Picard. Affective computing. MIT Press, 1997. [↩] [↩] [↩] [↩]
- L. Shu, J. Xie, M. Yang, Z. Li, Z. Li, D. Liao, X. Xu, X. Yang. A review of emotion recognition using physiological signals. Sensors. Vol. 18, pg. 2074, 2018, https://doi.org/10.3390/s18072074. [↩] [↩] [↩]
- J. A. Russell. A circumplex model of affect. Journal of Personality and Social Psychology. Vol. 39, pg. 1161-1178, 1980, https://doi.org/10.1037/h0077714. [↩] [↩] [↩]
- X. Hu, J. Chen, F. Wang, D. Zhang. Ten challenges for EEG-based affective computing. Brain Science Advances. Vol. 5, pg. 1-20, 2019, https://doi.org/10.26599/BSA.2019.9050005. [↩] [↩] [↩]
- American Psychiatric Association. Diagnostic and statistical manual of mental disorders (5th ed.). American Psychiatric Publishing, 2013, https://doi.org/10.1176/appi.books.9780890425596. [↩] [↩] [↩]
- X. Wang, Y. Ren, Z. Luo, W. He, J. Hong, Y. Huang. Deep learning-based EEG emotion recognition: current trends and future perspectives. Frontiers in Psychology. Vol. 14, pg. 1126994, 2023, https://doi.org/10.3389/fpsyg.2023.1126994. [↩] [↩]
- E. Niedermeyer, F. Lopes da Silva. Electroencephalography: basic principles, clinical applications, and related fields (5th ed.). Lippincott Williams & Wilkins, 2005. [↩]
- M. Teplan. Fundamentals of EEG measurement. Measurement Science Review. Vol. 2, pg. 1-11, 2002. [↩] [↩] [↩]
- W.-L. Zheng, B.-L. Lu. Investigating critical frequency bands and channels for EEG-based emotion recognition with deep neural networks. IEEE Transactions on Autonomous Mental Development. Vol. 7, pg. 162-175, 2015, https://doi.org/10.1109/TAMD.2015.2431497. [↩] [↩] [↩] [↩] [↩] [↩] [↩] [↩]
- R. Jenke, A. Peer, M. Buss. Feature extraction and selection for emotion recognition from EEG. IEEE Transactions on Affective Computing. Vol. 5, pg. 327-339, 2014, https://doi.org/10.1109/TAFFC.2014.2339834. [↩] [↩] [↩] [↩] [↩]
- M. K. Chowdary, J. Anitha, D. J. Hemanth. Emotion recognition from EEG signals using recurrent neural networks. Electronics. Vol. 11, pg. 2387, 2022, https://doi.org/10.3390/electronics11152387. [↩] [↩] [↩] [↩] [↩] [↩] [↩]
- S. Li, W. Deng. Deep facial expression recognition: a survey. IEEE Transactions on Affective Computing. Vol. 13, pg. 1195-1215, 2022, https://doi.org/10.1109/TAFFC.2020.2981446. [↩]
- S. Kapoor, A. Narayanan. Leakage and the reproducibility crisis in machine-learning-based science. Patterns. Vol. 4, pg. 100804, 2023, https://doi.org/10.1016/j.patter.2023.100804. [↩] [↩] [↩] [↩] [↩] [↩] [↩] [↩] [↩]
- G. James, D. Witten, T. Hastie, R. Tibshirani. An introduction to statistical learning: with applications in R (2nd ed.). Springer, 2021, https://doi.org/10.1007/978-1-0716-1418-1. [↩] [↩] [↩] [↩] [↩] [↩] [↩]
- I. Zukov, R. Ptacek, S. Fischer. EEG abnormalities in different types of criminal behavior. Activitas Nervosa Superior. Vol. 50, pg. 110-113, 2008, https://doi.org/10.1007/BF03379552. [↩] [↩]
- Z. Liang, R. Zhou, L. Zhang, L. Li, G. Huang, Z. Zhang, S. Ishii. EEGFuseNet: hybrid unsupervised deep feature characterization and fusion for high-dimensional EEG with an application to emotion recognition. IEEE Transactions on Neural Systems and Rehabilitation Engineering. Vol. 29, pg. 1913-1925, 2021, https://doi.org/10.1109/TNSRE.2021.3111689. [↩]
- M. R. Yousefi, A. Dehghani, A. Taghaavifar. Enhancing the accuracy of electroencephalogram-based emotion recognition through long short-term memory recurrent deep neural networks. Frontiers in Human Neuroscience. Vol. 17, pg. 1174104, 2023, https://doi.org/10.3389/fnhum.2023.1174104. [↩] [↩]
- S. Koelstra, C. Muhl, M. Soleymani, J.-S. Lee, A. Yazdani, T. Ebrahimi, T. Pun, A. Nijholt, I. Patras. DEAP: a database for emotion analysis using physiological signals. IEEE Transactions on Affective Computing. Vol. 3, pg. 18-31, 2012, https://doi.org/10.1109/T-AFFC.2011.15. [↩] [↩] [↩] [↩]
- A. Craik, Y. He, J. L. Contreras-Vidal. Deep learning for electroencephalogram (EEG) classification tasks: a review. Journal of Neural Engineering. Vol. 16, pg. 031001, 2019, https://doi.org/10.1088/1741-2552/ab0ab5. [↩] [↩] [↩] [↩] [↩] [↩] [↩]
- L. Breiman. Random forests. Machine Learning. Vol. 45, pg. 5-32, 2001, https://doi.org/10.1023/A:1010933404324. [↩] [↩] [↩] [↩] [↩] [↩] [↩] [↩] [↩]
- World Health Organization. Depressive disorder (depression) [Fact sheet]. World Health Organization, 2023, https://www.who.int/news-room/fact-sheets/detail/depression. [↩] [↩] [↩]
- J. J. Bird, A. Ekart, C. D. Buckingham, D. R. Faria. Mental emotional sentiment classification with an EEG-based brain-machine interface. In Proceedings of the International Conference on Digital Image and Signal Processing (DISP), pg. 1-7, 2019. [↩] [↩] [↩] [↩] [↩] [↩]
- H. H. Jasper. The ten-twenty electrode system of the International Federation. Electroencephalography and Clinical Neurophysiology. Vol. 10, pg. 371-375, 1958. [↩] [↩]
- J. Sabio, N. S. Williams, G. M. McArthur, N. A. Badcock. A scoping review on the use of consumer-grade EEG devices for research. PLoS ONE. Vol. 19, pg. e0291186, 2024, https://doi.org/10.1371/journal.pone.0291186. [↩] [↩] [↩] [↩] [↩] [↩]
- F. Pedregosa, G. Varoquaux, A. Gramfort, V. Michel, B. Thirion, O. Grisel, M. Blondel, P. Prettenhofer, R. Weiss, V. Dubourg, J. Vanderplas, A. Passos, D. Cournapeau, M. Brucher, M. Perrot, E. Duchesnay. Scikit-learn: machine learning in Python. Journal of Machine Learning Research. Vol. 12, pg. 2825-2830, 2011. [↩] [↩]


