
Abstract
Diabetic Retinopathy (DR) is a leading cause of preventable blindness worldwide. Automated classification using deep learning can improve screening scalability, but the severe class imbalance inherent in clinical DR datasets — where healthy retinal images vastly outnumber those of advanced disease — biases models toward the majority class and suppresses detection of clinically critical minority grades. This study systematically evaluates how loss function design interacts with model architecture for multi-class DR severity classification under class imbalance. Using the Kaggle Diabetic Retinopathy Detection dataset (35,126 retinal fundus images across five severity grades), we compared two transfer learning architectures — ResNet-18 and VGG-16 — under three loss functions: standard Cross-Entropy, Weighted Cross-Entropy, and Focal Loss. Experiments were conducted with stratified train/validation/test splits (70/15/15), early stopping based on validation loss, and three random seeds for statistical reliability. VGG-16 with standard Cross-Entropy achieved the highest overall accuracy (83.1 +/- 0.2%) and quadratic weighted kappa (0.737 +/- 0.006), but with near-zero sensitivity for Mild DR (1.8%). Weighted Cross-Entropy improved balanced accuracy from 0.491 to 0.545 for VGG-16 and detection of Severe DR from 40.2% to 70.0%, but reduced overall accuracy to 61.6 +/- 11.7% with high variance across seeds. Focal Loss over-corrected, collapsing both architectures to approximately 14% accuracy by suppressing majority class predictions entirely. These results demonstrate that loss function design creates a fundamental trade-off between majority and minority class performance in multi-class DR classification, and that no single configuration achieves uniformly strong detection across all severity grades.
Keywords: Diabetic Retinopathy, Artificial Intelligence, Machine Learning, Deep Learning, Convolutional Neural Networks, Transfer Learning, Medical Image Classification, Class Imbalance, Weighted Cross-Entropy Loss, Focal Loss, ResNet-18, VGG-16.
Introduction
Diabetic Retinopathy (DR) is one of the most serious microvascular complications of diabetes and a major cause of preventable blindness in working-age adults worldwide1. According to the International Diabetes Federation’s 11th Edition Diabetes Atlas, approximately 589 million adults aged 20 to 79 currently live with diabetes globally, making up 11.1% of the adult population, with this number projected to reach 853 million by 20502. A systematic review and meta-analysis by Teo et al. (2021) estimated that around 22.27% of people with diabetes have DR, translating to roughly 103 million affected adults in 2020, with this figure projected to rise to 160.50 million by 20453. Vision-threatening DR, the most advanced form, affects an estimated 6.17% of the global diabetic population3. These trends are particularly concerning in low- and middle-income countries, where over 80% of people with diabetes live, and access to specialist eye screening is limited2,4.
Screening programs that enable early diagnosis can effectively prevent visual impairment; however, the conventional approach of manually analyzing retinal fundus images by an ophthalmologist is time-consuming and not easily scalable to large populations1. Artificial intelligence, specifically deep learning, presents a means to automate DR detection. Since the breakthrough of AlexNet (Krizhevsky et al., 2012), which demonstrated the power of deep Convolutional Neural Networks (CNNs) on the ImageNet large-scale image database (Deng et al., 2009), CNNs have shown exceptional capabilities across image classification tasks5,6. In medical image analysis, CNNs can automatically learn complex hierarchical representations from raw pixel data, eliminating the need for hand-crafted features7.
Gulshan et al. (2016) demonstrated in a landmark study involving over 100,000 retinal images that deep learning models could achieve sensitivity and specificity comparable to board-certified ophthalmologists for detecting referable DR8. Gargeya and Leng (2017) extended this work with a fully data-driven approach that achieved an AUC of 0.97, with 94% sensitivity and 98% specificity on cross-validation, and validated externally on the MESSIDOR 2 and E-Ophtha databases9. Ting et al. (2017) confirmed deep learning’s effectiveness across diverse populations, showing clinically acceptable performance for detecting referable DR and related eye diseases10. Pratt et al. (2016) applied CNNs directly to retinal fundus images using pre-trained architectures, demonstrating that transfer learning could enhance classification accuracy while significantly reducing training time11. Li et al. (2019) introduced attention mechanisms that enabled models to focus on clinically relevant regions such as micro-aneurysms and hemorrhages, improving both detection performance and interpretability12. Surveys by Lakshminarayanan et al. (2021) documented over 114 studies on AI-based DR detection published between 2016 and 2021, highlighting the rapid growth and clinical potential of this field13.
Transfer learning, which leverages features learned from large-scale datasets like ImageNet6 to improve performance on smaller domain-specific datasets, has become the dominant approach in medical image classification. A review by Kim and Tran (2022), examining 121 studies, found that deep models such as ResNet and Inception were the most frequently used architectures, and feature extraction was the most common transfer learning strategy14. For DR classification, transfer learning helps models generalize despite the limited size and imbalanced nature of clinical datasets11,15.
Image pre-processing and data augmentation also play critical roles in model performance. Techniques such as image normalization, contrast enhancement, and geometric augmentations help reduce noise and imaging artifacts while improving generalization7. Shorten and Khoshgoftaar (2019) surveyed data augmentation techniques for deep learning, emphasizing its importance in medical imaging where labeled data is scarce16.
Despite these advances, the challenge of class imbalance remains a significant barrier to reliable DR classification. In publicly available datasets such as the Kaggle DR dataset, the majority of images depict healthy retinas (Class 0), while images of advanced DR stages are severely underrepresented17. Voets, Mollersen, and Bongo (2019) demonstrated that this imbalance causes DR classification models to exhibit a strong bias toward predicting the majority class, resulting in poor sensitivity for the clinically critical minority classes15. Several strategies have been proposed to mitigate this problem, including weighting the loss function, applying Focal Loss (Lin et al., 2017), and performing data augmentation to oversample minority classes16,18. However, prior studies have not systematically compared how different loss function designs — standard Cross-Entropy, Weighted Cross-Entropy, and Focal Loss — interact with different transfer learning architectures for multi-class DR severity classification. Specifically, it remains unclear whether the benefits of loss reweighting generalize across architectures, and whether more aggressive reweighting strategies like Focal Loss outperform simpler approaches.
This study addresses that gap. We evaluate two architecturally distinct CNN models — ResNet-18 and VGG-16 — under three loss function configurations, using a rigorous experimental framework with stratified data splits, early stopping, and statistical testing across multiple random seeds. By reporting a comprehensive panel of metrics including accuracy, balanced accuracy, macro-F1, Cohen’s Kappa, quadratic weighted kappa (QWK), per-class sensitivity and precision, and ordinal error analysis, we provide a thorough assessment of the trade-offs introduced by each configuration. Our study offers practical guidance for designing loss functions in imbalanced medical image classification tasks, contributing to the development of more equitable automated DR screening systems, particularly in resource-limited settings where trained ophthalmologists are scarce2.
Methods
Dataset
Our study uses the Kaggle Diabetic Retinopathy Detection dataset17, which consists of 35,126 high-resolution color retinal fundus images sourced from the EyePACS telemedicine screening platform. Each image was graded by a trained clinician into one of five severity levels based on the International Clinical Diabetic Retinopathy Disease Severity Scale: 0 (No DR), 1 (Mild non-proliferative DR), 2 (Moderate non-proliferative DR), 3 (Severe non-proliferative DR), and 4 (Proliferative DR).
The dataset exhibits a pronounced class imbalance, as shown in Table 115. Class 0 (No DR) accounts for approximately 73.5% of all images (25,810 images), while the most clinically critical classes — Severe DR (873 images, 2.5%) and Proliferative DR (708 images, 2.0%) — together represent less than 4.5% of the dataset. This distribution mirrors real-world screening populations, where most patients show no signs of DR, but it poses a significant challenge for training models that must accurately detect the rarer, more severe cases.
| Class | Label | Image count | Percentage |
| 0 | No DR | 25,810 | 73.5 |
| 1 | Mild | 2,443 | 7.0 |
| 2 | Moderate | 5,292 | 15.1 |
| 3 | Severe | 873 | 2.5 |
| 4 | Proliferative | 708 | 2.0 |
| Total | 35,126 | 100 |
Data Splitting
To ensure rigorous evaluation and prevent data leakage, the dataset was split into three stratified subsets: training (70%, approximately 24,575 images), validation (15%, approximately 5,266 images), and test (15%, approximately 5,266 images). Stratified sampling preserved the original class distribution across all three subsets. The validation set was used during training to monitor convergence and implement early stopping, while the held-out test set was used exclusively for final performance evaluation. This three-way split addresses a common methodological limitation in DR classification studies, where the absence of a separate validation set can lead to overfitting to test data15.
Pre-processing
All fundus images were resized to 224 x 224 pixels to match the input dimensions required by both architectures19,20. Pixel intensity values were normalized using the ImageNet channel-wise mean (0.485, 0.456, 0.406) and standard deviation (0.229, 0.224, 0.225), a standard practice when using transfer learning to ensure the input distribution matches what the pre-trained weights expect7,14.
To reduce overfitting and improve generalization, data augmentation was applied to the training set only16. Augmentations included random horizontal flipping to account for left- and right-eye symmetry, random rotation of up to 15 degrees to simulate variation in camera orientation, random resized cropping (scale 0.85 to 1.0) to introduce spatial variation, and random adjustments to brightness and contrast (factor 0.2) to account for differences in imaging conditions across clinical sites. No augmentation was applied to the validation or test sets to ensure unbiased evaluation.
Model Architecture
We employed a transfer learning approach using CNN architectures pre-trained on the ImageNet dataset6,21 as feature extractors14. In both architectures, the original final classification layer (designed for ImageNet’s 1,000-class output) was replaced with a new fully connected layer with five output units corresponding to the five DR severity grades. All pre-trained convolutional layers were fine-tuned during training to allow the learned features to adapt to the retinal imaging domain.
ResNet-18
The first architecture was ResNet-18 (He et al., 2016), an 18-layer deep residual network containing approximately 11 million parameters19. ResNet architectures introduce residual connections — shortcut paths that skip one or more layers — enabling the network to learn residual functions rather than direct mappings. This design mitigates the vanishing gradient problem that commonly affects deep networks, allowing effective training of deeper architectures with stronger representational capacity19. The relatively compact size of ResNet-18 makes it well-suited for transfer learning on moderately sized datasets, offering a balance between model capacity and the risk of overfitting.
VGG-16
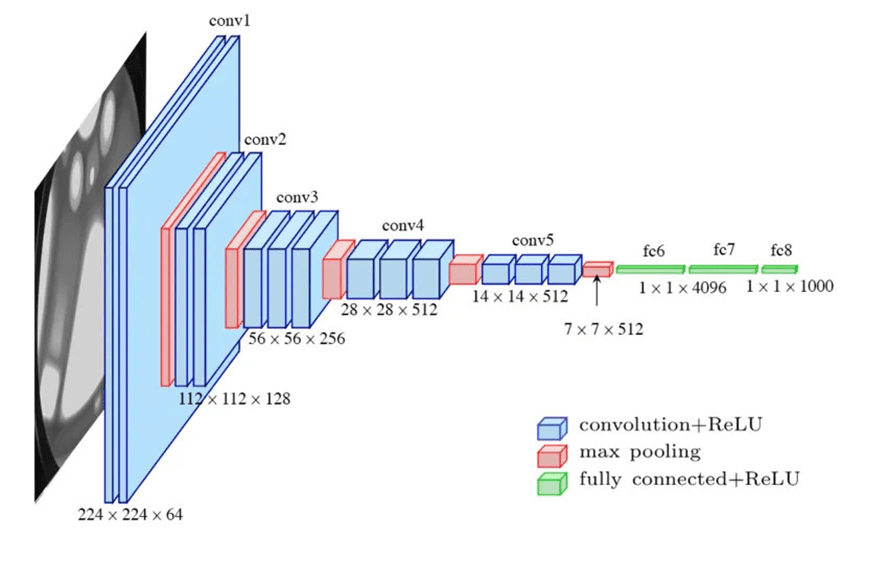
The second architecture was VGG-16 (Simonyan and Zisserman, 2014), a 16-layer network containing approximately 138 million parameters20. VGG-16 uses a uniform stack of 3 x 3 convolutional filters with max pooling layers for spatial downsampling, demonstrating that network depth with small filter sizes is a critical factor for strong classification performance20. While VGG-16’s larger parameter count provides greater representational capacity, it also increases computational cost and the potential for overfitting compared to ResNet-18.
The use of two architecturally distinct models — one based on residual learning and one on conventional deep stacking — enables a controlled comparison of how architectural design interacts with loss function strategy in the context of imbalanced DR classification.
Loss Functions
To investigate the impact of loss function design on classification performance under class imbalance, we evaluated three loss functions.
Standard Cross-Entropy Loss
Treats all classes equally, computing the negative log-likelihood of the correct class prediction without adjusting for class frequency. Under severe class imbalance, this causes the model to optimize predominantly for the majority class, resulting in poor sensitivity for minority classes15.
Weighted Cross-Entropy Loss
Applies a multiplicative penalty inversely proportional to each class’s frequency, increasing the loss incurred when the model misclassifies underrepresented classes. The class weights were computed using the formula:

where  is the total number of training samples,
  is the number of classes (5), and
  is the number of training samples in class c. The resulting weights are shown in Table 2. Classes with fewer samples receive proportionally higher weights; for instance, Proliferative DR (Class 4) receives a weight of approximately 9.92, roughly 37 times greater than No DR (Class 0, weight 0.27), ensuring the model incurs a substantially higher loss when it misclassifies these rare but clinically critical cases.
| Class | Label | Sample Count () | Weight ( ) ) |
| 0 | No DR | 25,810 | 0.27 |
| 1 | Mild | 2,443 | 2.88 |
| 2 | Moderate | 5,292 | 1.33 |
| 3 | Severe | 873 | 8.05 |
| 4 | Proliferative | 708 | 9.92 |
Table 2 | Computed class weights for Weighted Cross-Entropy Loss. No DR (Class 0): 0.27; Mild (Class 1): 2.88; Moderate (Class 2): 1.33; Severe (Class 3): 8.06; Proliferative (Class 4): 9.92.
Focal Loss (Lin et al., 2017)
Focal Loss was originally designed for dense object detection to address extreme class imbalance18. It modifies the standard Cross-Entropy Loss by adding a modulating factor  that down-weights the loss contribution from well-classified examples, focusing training on hard, misclassified samples. We used
  (the original recommended value) with class weights as the alpha parameter to combine frequency reweighting with the focal modulation.
This weighting strategy was chosen over alternatives because it directly addresses the frequency imbalance without requiring changes to the data distribution (as in oversampling) or the model architecture. Focal Loss was included as an additional comparison point to evaluate whether the more aggressive, adaptive reweighting outperforms the simpler inverse-frequency approach.
Optimization and Training
All experiments were implemented in PyTorch22 and trained using the Adam optimizer23 with a learning rate of  and weight decay of
  . The batch size was set to 128. Training continued for a maximum of 50 epochs with early stopping based on validation loss (patience of 7 epochs), meaning training halted if the validation loss did not improve for 7 consecutive epochs, and the model weights from the best-performing epoch were retained for evaluation.
The learning rate was selected based on standard recommendations for fine-tuning pre-trained models with the Adam optimizer23. Weight decay was applied as L2 regularization to mitigate overfitting. Early stopping was implemented to address overfitting concerns and to ensure that reported results reflect the model’s best generalization performance rather than degraded last-epoch performance.
The full factorial combination of two architectures (ResNet-18, VGG-16) and three loss functions (standard Cross-Entropy, Weighted Cross-Entropy, Focal Loss) yields six experimental configurations, each evaluated across three random seeds for a total of 18 training runs.
Statistical Testing
To assess the reliability and variability of results, each of the six experimental configurations was trained and evaluated across three random seeds (42, 123, 456), yielding 18 total experimental runs. All reported metrics represent the mean and standard deviation across seeds. This approach provides a measure of performance variability and reduces the risk that reported results are artifacts of a single favorable data split.
Evaluation Metrics
Performance was assessed using a comprehensive panel of metrics:
Overall metrics
Accuracy, balanced accuracy, macro-F1 score, weighted-F1 score, Cohen’s Kappa24, and quadratic weighted kappa (QWK).
Per-class metrics
True positive rate (TPR/sensitivity), positive predictive value (PPV/precision), F1 score, false positive rate (FPR), negative predictive value (NPV), and specificity for each of the five DR severity grades.
Ordinal metrics
Because DR severity is an ordinal scale, misclassifying a patient by one grade (e.g., Mild as Moderate) is clinically less concerning than misclassifying by four grades (e.g., No DR as Proliferative). We therefore report mean absolute error (MAE) of the grade predictions, the proportion of exact matches, the proportion of predictions within one grade of the true label, and the full distribution of absolute grade errors.
Hardware and Reproducibility
All experiments were conducted on an NVIDIA A100-SXM4-40GB GPU using PyTorch 2.10.0 with CUDA 12.8. Total training time across all 18 runs was approximately 16 hours. Individual run times averaged 49 minutes for ResNet-18 configurations and 75 minutes for VGG-16 configurations.
Results
Overall Performance
Table 3 presents the overall performance metrics for all six configurations, averaged across three random seeds.
Column key: VGG+CE = VGG-16 + Standard CE; Res+CE = ResNet-18 + Standard CE; VGG+WCE = VGG-16 + Weighted CE; Res+WCE = ResNet-18 + Weighted CE; VGG+FL = VGG-16 + Focal Loss; Res+FL = ResNet-18 + Focal Loss.
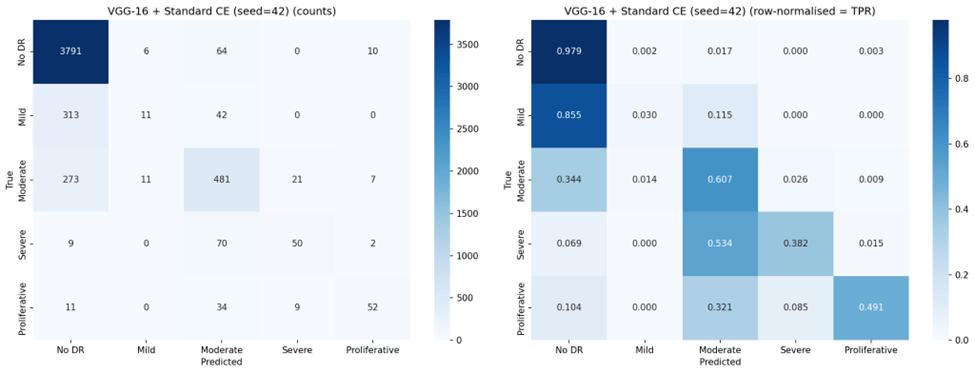
VGG-16 with standard Cross-Entropy achieved the highest overall accuracy (83.1%), QWK (0.737), macro-F1 (0.525), and lowest MAE (0.256). ResNet-18 with standard Cross-Entropy was the second-best performer across most metrics. Weighted Cross-Entropy improved balanced accuracy for both architectures (from 0.491 to 0.545 for VGG-16; from 0.449 to 0.523 for ResNet-18), but at a substantial cost to overall accuracy and with notably higher variance across seeds, indicating training instability. Focal Loss produced the poorest overall performance, reducing both architectures to approximately 14% accuracy — below the 20% expected from random classification across five classes.
Per-Class Sensitivity
Table 4 reports the per-class true positive rate (sensitivity), revealing the core trade-off introduced by each loss function.
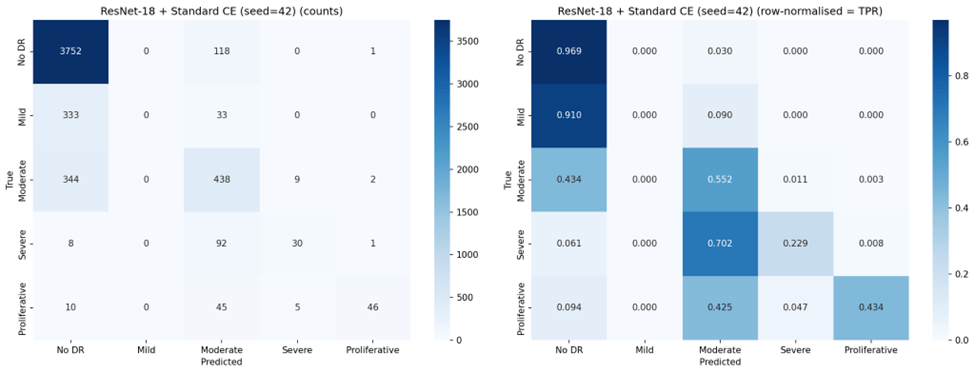
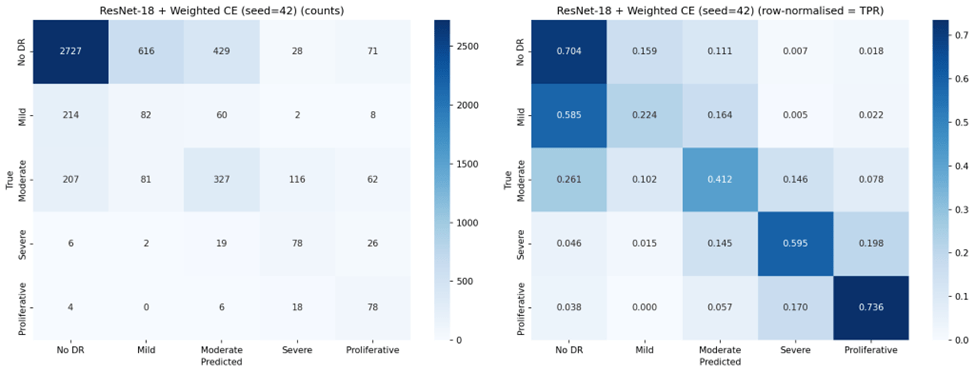
Under standard Cross-Entropy, both architectures achieved very high sensitivity for No DR (96-97%) but nearly zero sensitivity for Mild DR (0.2-1.8%), confirming the majority class bias. Weighted Cross-Entropy substantially improved sensitivity for the clinically critical Severe (70.0% for VGG-16, up from 40.2%) and Proliferative classes (67.6%, up from 43.1%), but reduced No DR sensitivity from 97.4% to 69.1% for VGG-16 and from 96.1% to 43.9% for ResNet-18. Notably, the high standard deviations for Weighted Cross-Entropy configurations (e.g., 0.196 for ResNet-18 No DR TPR) indicate substantial instability across seeds.
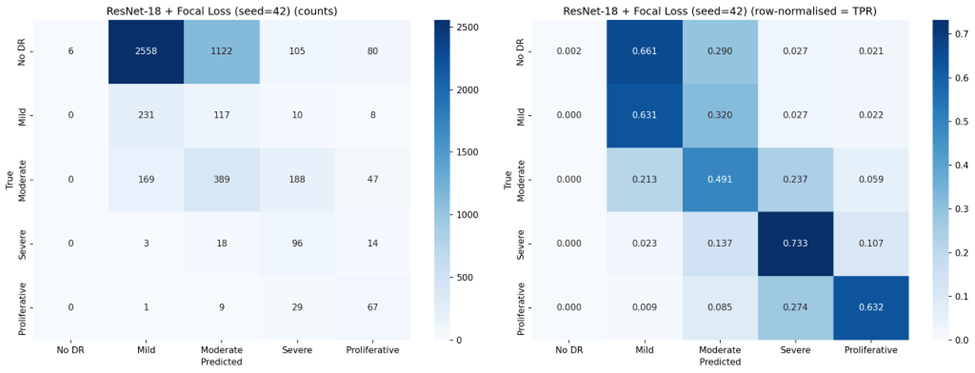
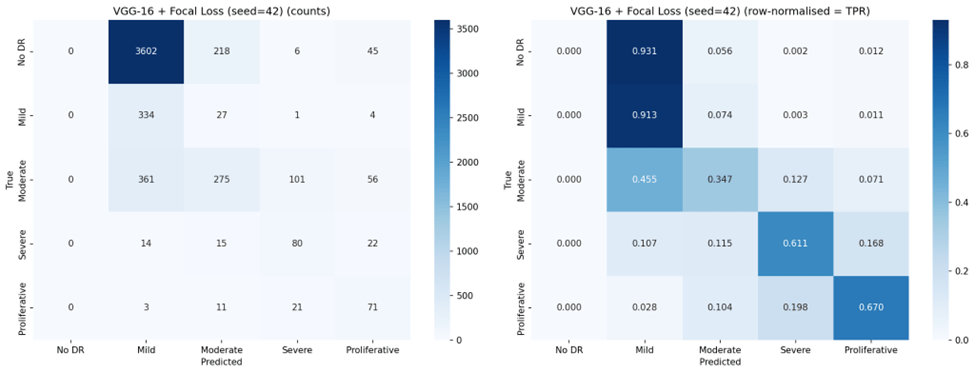
Focal Loss exhibited the most extreme behavior: VGG-16 with Focal Loss achieved the highest Mild DR sensitivity of any configuration (88.3%) and strong Severe DR sensitivity (68.7%), but completely failed to detect No DR (0.0% TPR across all seeds). This represents a complete inversion of the majority class bias — the model learned to ignore the largest class entirely.
Per-Class Precision
Table 5 reports positive predictive value (precision) for each class.
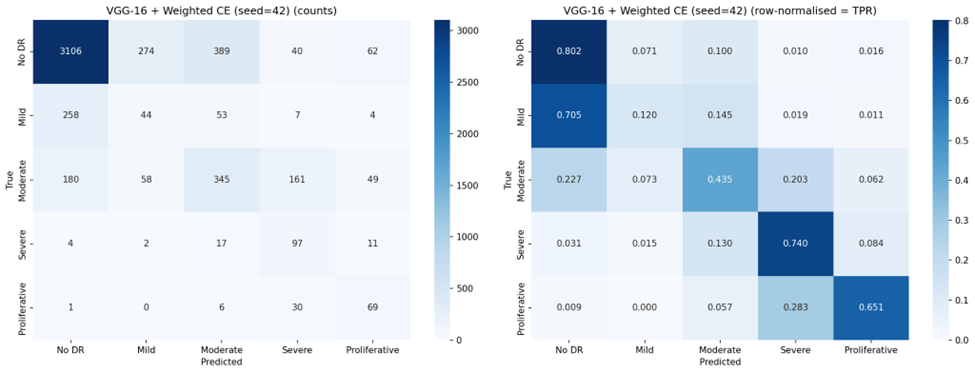
An inverse relationship between sensitivity and precision emerged across configurations. Standard Cross-Entropy produced high precision for Proliferative DR (87.8% for ResNet-18, 77.2% for VGG-16) but with low sensitivity for that class. Weighted Cross-Entropy improved minority class sensitivity but substantially reduced precision for those same classes — for example, Severe DR precision dropped from 57.4% to 29.0% for VGG-16, meaning that while the model detected more true Severe cases, it also generated many more false positives. This trade-off is clinically significant: in a screening program, low precision means many healthy or mildly affected patients would be unnecessarily referred for specialist follow-up.
Confusion Matrices
Representative confusion matrices from seed 42 for all six configurations are shown in Figures 2 through 7.
Ordinal Error Analysis
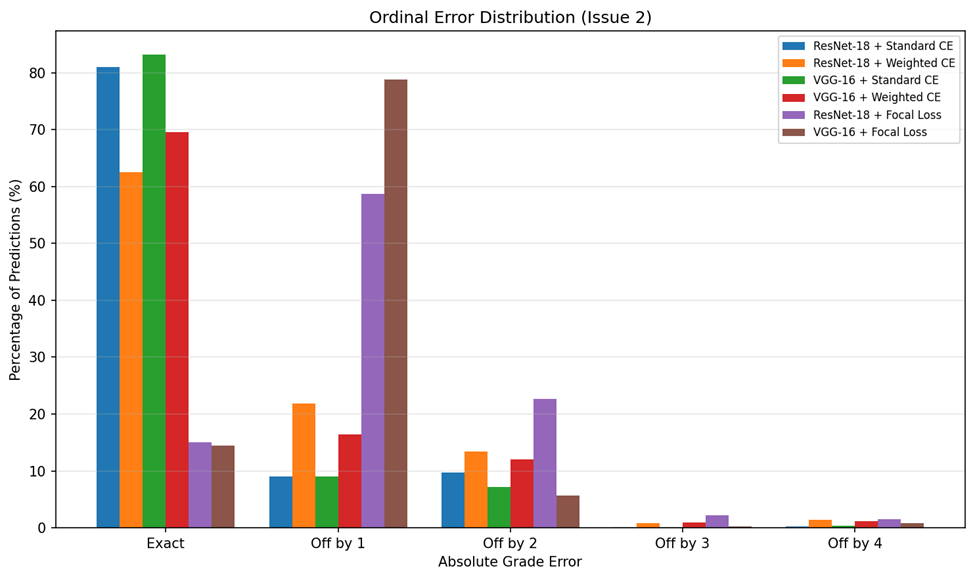
Because DR severity follows an ordinal scale, the magnitude of misclassification errors matters clinically: an off-by-one error (e.g., Mild classified as Moderate) is far less concerning than an off-by-four error (e.g., No DR classified as Proliferative). Table 6 summarizes the ordinal error analysis.
VGG-16 with standard Cross-Entropy achieved the lowest MAE (0.256), indicating that when it does make errors, they tend to be small — predominantly off-by-one grade misclassifications. By contrast, Focal Loss configurations produced MAE values near or exceeding 1.0, meaning that on average every prediction was off by at least one full severity grade. The ordinal error distribution is visualized in Figure 8.
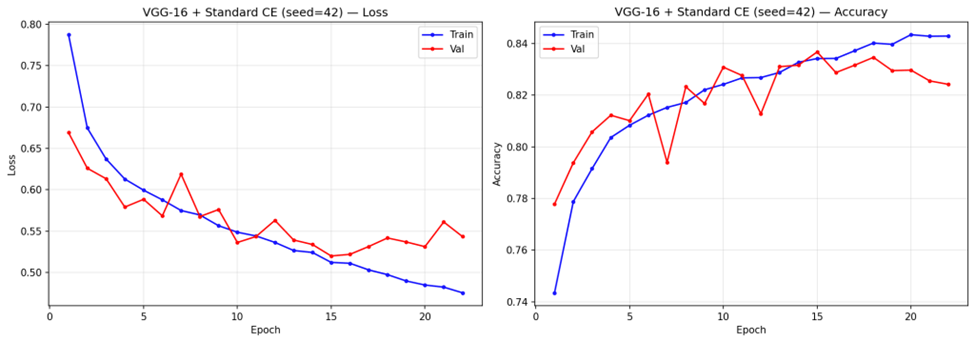
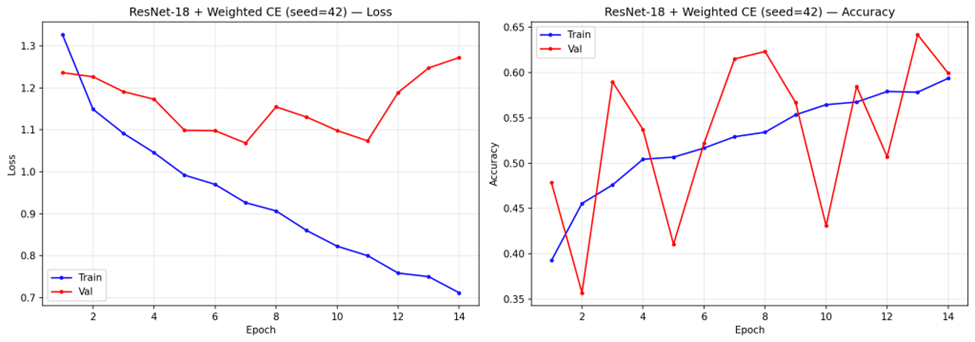
Training Dynamics
Analysis of training convergence (representative curves shown in Figure 9) revealed notable differences across configurations. Under standard Cross-Entropy, VGG-16 trained for 14-16 epochs before stopping early, with steady convergence in both training and validation loss. ResNet-18 with standard Cross-Entropy converged faster, stopping at 7-8 epochs. Weighted Cross-Entropy configurations stopped at similar epoch counts (6-7 for ResNet-18, 13-14 for VGG-16) but exhibited more volatile validation loss trajectories.
Discussion
Key Findings
This study demonstrates that loss function design is the dominant factor governing the trade-off between majority and minority class performance in multi-class DR classification. However, contrary to the expectation that loss reweighting would uniformly improve classification, our results reveal a more nuanced picture: each loss function configuration occupies a distinct point on the sensitivity-precision trade-off curve, and no single configuration achieves uniformly strong performance across all severity grades.
VGG-16 with standard Cross-Entropy emerged as the strongest overall performer, achieving the highest accuracy (83.1%), QWK (0.737), and lowest ordinal MAE (0.256). Its higher QWK indicates that it preserves ordinality better than any other configuration — when it makes errors, they tend to be small. However, this comes at the cost of near-zero sensitivity for Mild DR (1.8%), meaning it effectively cannot distinguish Mild DR from No DR, a clinically concerning blind spot since Mild DR represents the earliest detectable stage of disease progression.
Weighted Cross-Entropy Loss improved balanced accuracy for both architectures (from 0.491 to 0.545 for VGG-16; from 0.449 to 0.523 for ResNet-18), and substantially increased sensitivity for Severe DR (from 40.2% to 70.0% for VGG-16) and Proliferative DR (from 43.1% to 67.6%). This confirms that inverse-frequency weighting can redirect the model’s attention toward underrepresented classes15. However, this redistribution came at significant cost: overall accuracy dropped by 21.5 percentage points for VGG-16 and 36.1 percentage points for ResNet-18, and the high standard deviations (11.7% and 13.5% respectively) indicate that Weighted Cross-Entropy training is substantially less stable across random seeds than standard Cross-Entropy. Precision for minority classes also dropped markedly (e.g., Severe DR precision from 57.4% to 29.0% for VGG-16), meaning that while more true positive cases were detected, the false positive burden also increased substantially.
Focal Loss and Over-Correction
Focal Loss, despite its theoretical appeal for addressing class imbalance18, produced the poorest results in our experiments. Both architectures collapsed to approximately 14% accuracy, with VGG-16 achieving 0.0% sensitivity for No DR across all three seeds and ResNet-18 achieving 0.1%. This represents a complete failure mode where the focal modulation, combined with class weights, caused the model to entirely suppress predictions for the majority class. The model effectively learned that it could minimize its focal-weighted loss by focusing on minority classes and ignoring the 73.5% of samples that are No DR.
This finding is important because Focal Loss has been widely recommended for imbalanced classification tasks18. Our results suggest that in contexts with extreme class imbalance (73:1 ratio between the largest and smallest classes), Focal Loss with and class weights over-corrects, and that the simpler Weighted Cross-Entropy approach, while imperfect, produces more usable models. Future work should investigate whether lower gamma values or the removal of class weights from Focal Loss would produce more balanced results.
Architectural Comparison
VGG-16 outperformed ResNet-18 under standard Cross-Entropy across all metrics, likely due to its larger parameter count (138M vs. 11M) providing greater representational capacity for learning the subtle features that distinguish DR grades20. Under Weighted Cross-Entropy, VGG-16 maintained higher accuracy (61.6% vs. 44.2%) and lower variance, suggesting that its greater capacity also confers more stable training under loss reweighting. However, under Focal Loss, both architectures failed similarly, indicating that the loss function — not the architecture — was the dominant factor in the collapse.
The comparison between ResNet-18 and VGG-16 under both standard and weighted loss (a fully controlled 2×2 comparison) confirms that while architecture matters, the choice of loss function has a larger effect on the classification profile. VGG-16 with standard Cross-Entropy ( ) substantially outperformed ResNet-18 with Weighted Cross-Entropy (
 ), demonstrating that a well-performing architecture with a simple loss function outperforms a less capable architecture with a theoretically superior loss function.
Clinical Implications
The results highlight a fundamental tension in DR screening system design. Standard Cross-Entropy produces models optimized for the most common clinical scenario (No DR) but that are nearly blind to the earliest stage of disease (Mild DR). This is problematic for screening programs, where the goal is to identify disease at the earliest possible stage for timely intervention. Weighted Cross-Entropy improves detection of advanced disease stages but introduces an unacceptable false positive burden on the largest patient group — a No DR sensitivity of 43.9% for ResNet-18 means that more than half of healthy patients would be incorrectly flagged for follow-up, overwhelming referral pathways.
In practice, the choice of configuration should depend on the clinical objective. For a primary screening program where the cost of missing severe disease is high, VGG-16 with Weighted Cross-Entropy (70.0% Severe DR sensitivity) may be preferred despite its lower overall accuracy. For a triage system where preserving ordinal accuracy and minimizing unnecessary referrals is paramount, VGG-16 with standard Cross-Entropy (,  ) is the stronger choice.
Mild DR Detection
Across all configurations, Mild DR (Class 1) remained the most difficult class to detect. The best sensitivity for Mild DR under any non-Focal configuration was 46.1% (ResNet-18 + Weighted CE), with most configurations achieving below 30%. This is consistent with the clinical reality that Mild DR features — scattered micro-aneurysms — are subtle and visually similar to artifacts or normal retinal variation8,12. Improving Mild DR detection likely requires approaches beyond loss function modification, such as attention mechanisms12, higher-resolution imaging, or specialized feature engineering focused on micro-aneurysm detection.
Connection to Prior Work
Our findings extend the work of Voets, Mollersen, and Bongo (2019), who identified class imbalance as a critical barrier to reliable DR classification but did not compare different loss function strategies15. We provide quantitative evidence that while loss reweighting can shift the classification profile, it does so through redistribution rather than uniform improvement. The transfer learning approach we employed is consistent with recommendations from Kim and Tran (2022)14, and our multi-class formulation presents a substantially harder task than the binary classification addressed by Gulshan et al. (2016)8 and Gargeya and Leng (2017)9.
Our results also align with broader findings in the class imbalance literature: that no single technique fully resolves the imbalance problem for multi-class tasks, and that combined strategies — potentially including oversampling, curriculum learning, and ordinal-aware loss functions — may be necessary for further progress16,18.
Limitations
Several limitations apply to this study. First, computational constraints restricted the number and depth of architectures evaluated; deeper models such as ResNet-50 or ensemble approaches may yield improved performance. Second, although we evaluated three loss functions, other strategies such as class-balanced loss, label smoothing, or ordinal regression losses were not tested and may offer different trade-off profiles. Third, our evaluation was limited to a single dataset (Kaggle DR Detection); external validation on an independent dataset such as MESSIDOR9 or APTOS would significantly strengthen the generalizability of these findings. Fourth, the model lacks interpretability — clinicians cannot inspect which retinal features drive the classification decision. Explainable AI tools such as Grad-CAM25 or attention visualizations12 would be valuable additions. Fifth, the training instability observed with Weighted Cross-Entropy (reflected in high standard deviations) suggests that more sophisticated training schedules, such as learning rate warmup or curriculum learning, may be needed to stabilize weighted loss training.
Closing Thought
This study demonstrates that loss function design is the most accessible lever for modifying the classification behavior of transfer learning models in imbalanced multi-class DR classification. However, our results also show that current approaches force a trade-off between majority and minority class performance: improving detection of rare, clinically critical severity grades comes at the cost of overall accuracy and model stability. VGG-16 with standard Cross-Entropy remains the strongest overall performer, while Weighted Cross-Entropy offers a viable alternative when minority class detection is the clinical priority. Focal Loss, as configured in this study, is not recommended for this task. Future work should explore hybrid strategies that combine loss reweighting with data-level approaches such as oversampling and augmentation, evaluate ordinal-aware loss functions that respect the severity scale structure, incorporate Explainable AI tools to support clinical adoption, and validate findings on external datasets to confirm generalizability.
Acknowledgement
The author is grateful to Dr. Shesha Bhushan for providing valuable feedback on the research. The author is thankful to Alex Goodall, PhD candidate at Imperial College, London for his mentorship and guidance throughout the research process. The author is grateful for the support and encouragement from his family in this research endeavor.
References
- International Diabetes Federation. IDF Diabetes Atlas, 7th edition. Brussels, Belgium: International Diabetes Federation, 2015. [↩] [↩]
- D. J. Magliano, E. J. Boyko; IDF Diabetes Atlas Committee. IDF Diabetes Atlas. 11th edition. Brussels: International Diabetes Federation, 2025. [↩] [↩] [↩]
- Z. L. Teo, Y. C. Tham, M. Yu, M. L. Chee, T. H. Rim, N. Cheung, M. M. Bikbov, Y. X. Wang, Y. Tang, Y. Lu, I. Y. Wong, D. S. W. Ting, G. S. W. Tan, J. B. Jonas, C. Sabanayagam, T. Y. Wong, C. Y. Cheng. Global prevalence of diabetic retinopathy and projection of burden through 2045: systematic review and meta-analysis. Ophthalmology. Vol. 128, pg. 1580-1591, 2021. [↩] [↩]
- J. W. Y. Yau, S. L. Rogers, R. Kawasaki, et al. Global prevalence and major risk factors of diabetic retinopathy. Diabetes Care. Vol. 35, pg. 556-564, 2012. [↩]
- A. Krizhevsky, I. Sutskever, G. E. Hinton. ImageNet classification with deep convolutional neural networks. Advances in Neural Information Processing Systems. Vol. 25, 2012. [↩]
- J. Deng, W. Dong, R. Socher, L. J. Li, K. Li, L. Fei-Fei. ImageNet: a large-scale hierarchical image database. Proceedings of the IEEE Conference on Computer Vision and Pattern Recognition. pg. 248-255, 2009. [↩] [↩] [↩]
- Y. LeCun, Y. Bengio, G. Hinton. Deep learning. Nature. Vol. 521, pg. 436-444, 2015. [↩] [↩] [↩]
- V. Gulshan, L. Peng, M. Coram, M. C. Stumpe, D. Wu, A. Narayanaswamy, S. Venugopalan, K. Widner, T. Madams, J. Cuadros, et al. Development and validation of a deep learning algorithm for detection of diabetic retinopathy in retinal fundus photographs. JAMA. Vol. 316, pg. 2402-2410, 2016. [↩] [↩] [↩]
- R. Gargeya, T. Leng. Automated identification of diabetic retinopathy using deep learning. Ophthalmology. Vol. 124, pg. 962-969, 2017. [↩] [↩] [↩]
- D. S. W. Ting, C. Y. L. Cheung, G. Lim, et al. Development and validation of a deep learning system for diabetic retinopathy and related eye diseases using retinal images from multiethnic populations with diabetes. JAMA. Vol. 318, pg. 2211-2223, 2017. [↩]
- H. Pratt, F. Coenen, D. M. Broadbent, S. P. Harding, Y. Zheng. Convolutional neural networks for diabetic retinopathy. Procedia Computer Science. Vol. 90, pg. 200-205, 2016. [↩] [↩]
- T. Li, Y. Gao, K. Wang, S. Guo, H. Liu, H. Kang. Diagnostic assessment of deep learning algorithms for diabetic retinopathy screening. Information Sciences. Vol. 501, pg. 511-522, 2019. [↩] [↩] [↩] [↩]
- V. Lakshminarayanan, H. Kheradfallah, A. Sarkar, J. J. Balaji. Automated detection and diagnosis of diabetic retinopathy: a comprehensive survey. Journal of Imaging. Vol. 7, pg. 165, 2021. [↩]
- S. H. Kim, H. H. Tran. Transfer learning for medical image classification: a literature review. BMC Medical Imaging. Vol. 22, pg. 69, 2022. [↩] [↩] [↩] [↩]
- M. Voets, K. Mollersen, L. A. Bongo. Replication study: development and validation of deep learning algorithm for detection of diabetic retinopathy in retinal fundus photographs. arXiv preprint arXiv:1803.04337, 2018. [↩] [↩] [↩] [↩] [↩] [↩] [↩]
- C. Shorten, T. M. Khoshgoftaar. A survey on image data augmentation for deep learning. Journal of Big Data. Vol. 6, pg. 60, 2019. [↩] [↩] [↩] [↩]
- E. Dugas, J. Jared, W. Cukierski. Diabetic retinopathy detection. Kaggle, 2015. [↩] [↩]
- T. Y. Lin, P. Goyal, R. Girshick, K. He, P. Dollar. Focal loss for dense object detection. Proceedings of the IEEE International Conference on Computer Vision. pg. 2980-2988, 2017. [↩] [↩] [↩] [↩] [↩]
- K. He, X. Zhang, S. Ren, J. Sun. Deep residual learning for image recognition. Proceedings of the IEEE Conference on Computer Vision and Pattern Recognition. pg. 770-778, 2016. [↩] [↩] [↩]
- K. Simonyan, A. Zisserman. Very deep convolutional networks for large-scale image recognition. arXiv preprint arXiv:1409.1556, 2014. [↩] [↩] [↩] [↩]
- O. Russakovsky, J. Deng, H. Su, et al. ImageNet large scale visual recognition challenge. International Journal of Computer Vision. Vol. 115, pg. 211-252, 2015. [↩]
- A. Paszke, S. Gross, F. Massa, A. Lerer, J. Bradbury, G. Chanan, T. Killeen, Z. Lin, N. Gimelshein, L. Antiga, et al. PyTorch: an imperative style, high-performance deep learning library. Advances in Neural Information Processing Systems. Vol. 32, 2019. [↩]
- D. P. Kingma, J. Ba. Adam: a method for stochastic optimization. arXiv preprint arXiv:1412.6980, 2014. [↩] [↩]
- J. Cohen. A coefficient of agreement for nominal scales. Educational and Psychological Measurement. Vol. 20, pg. 37-46, 1960. [↩]
- R. R. Selvaraju, M. Cogswell, A. Das, R. Vedantam, D. Parikh, D. Batra. Grad-CAM: visual explanations from deep networks via gradient-based localization. Proceedings of the IEEE International Conference on Computer Vision. pg. 618-626, 2017. [↩]


