
Abstract
The formation of our beautiful planet Earth and the solar system it belongs toand the existence of the solar system in the universe, have long been a popular topic in astronomy. In this review, the formation of stars and planetary systems is discussed. To further illustrate the component of star clusters that include various stars, the introduction to the Hertzsprung-Russell diagram is included. To gain a deeper understanding of the Hertzsprung-Russell diagram, a Hertzsprung-Russell diagram is plotted for the Pleiades cluster, in which the luminosity of the stars ranges from 0.1 L☉ to 1000 L☉1.
Keywords: Star formation and evolution, planetary system, Hertzsprung-Russel diagram, Pleiades cluster
Introduction And Theoretical Background
This paper will be introducing the formation and evolution of stars, while including explanations about how planetary systems form. The framework of the Hertzsprung-Russell diagram 2 is then generally introduced, and is later utilized to plot the Hertzsprung-Russell diagram for the Pleiades cluster 3. Now the theoretical background of the life of a star, the formation of planetary systems and the Hertzsprung-Russell diagram is introduced.
Protostar
Molecular clouds are also called star nurseries; they include regions that contain a wide range of densities (from a few tens of molecules per centimeter to more than one million per centimeter)2. The “probability of density function (PDF)” reveals how mass is distributed throughout the cloud, while  represents the local normalized density, which includes contributions from turbulent fluctuations. Meanwhile,
  represents the inverse of the average density, excluding turbulent fluctuations, with both quantities normalized to the edge density. The width
  of the log-normal distribution typically varies with position
  , indicating that can be considered a function of . When a giant molecular cloud gets cold, the gas clumps. These clumps then bump into each other and accrete more matter, causing a high-density pocket to form. This results in the increasing opacity of the outer layer. When the mass of the pocket increases, the gravitational force of the pocket is strengthened, leading to the collapse of the pocket. Since the pressure of the pocket increases, the temperature then increases. The changing pressure in this heating is called thermal pressure. Based on the ideal gas law, the thermal pressure is directly proportional to the density of the molecules and the temperature. During the collapse, the pressure increases while the temperature increases at the same time. The increasing pressure counteracts the gravity. The aggregation of molecules then condenses into a rotating ball of super-hot gas. The initial stage of the protostar, which is the ‘seed’ for the following development of a large primordial star, is when the mean temperature of the star is 100 K . At this stage, the initial radius of the protostar can be defined by the equation in 2 , where represents the mass of the protostar1.
(1) 
The molecular cloud is collapsing due to the gravitational pull, and the gravitational pull causes the protostar to gather gas and dust from the molecular cloud continually until it reaches its final mass. The time for the stop of contraction is determined by the thermal pressure. In this case, the protostar becomes a pre-main-sequence star.
Pre-main-sequence
The phase after the protostar is formed and before the star steps into the main sequence is called pre-main-sequence. In this section, the pre-main-sequence of stars is discussed separately for low-mass stars and high-mass stars.
Low-mass star
The star with a mass above  and under the threshold for hydrogen burning which is
  is defined as a low-mass star. The pre-main-sequence is where a protostar is formed and is contracting to reach the critical temperature for hydrogen fusion which indicates the beginning of main sequence. The central temperature, which is the temperature of the core, is at
  K when the deuterium fusion is onset. The effective temperature
  and luminosity
  do not show significant variation range comparing to the ones at the very beginning of main sequence. When the central temperature reaches
  K, He
K, He is completely converted to He
 .
.
Coming to the end of deuterium fusion, quasi-hydrostatic contraction (a process where the pressure of the protostar and the gravitational pull of the protostar are not perfectly balance, causing contraction of the protostar) starts to counteract with the energy loss due to the halt of deuterium fusion3. While the energy released by the quasi-hydrostatic state halts the contraction of the star from its opaque outer layer, shock waves then eject some of the outer layer. For a star with mass ranging from  to
to  , the ejected mass is negligible, and its limit is
  or
or  4. Even when the quasi-hydrostatic state takes over the deuterium fusion, light elements in the core are still undergoing fusion, although the energy released by fusions of this kind is negligible in terms of affecting the star. As the core temperature increases, the radiative opacity decreases, indicating a degradation in the radiative gradient. A radiative core is formed when the radiative opacity is superior than the adiabatic one.
Even when the quasi-hydrostatic state takes over the deuterium fusion, light elements in the core are still undergoing fusion, although the energy released by fusions of this kind is negligible in terms of affecting the star. As the core temperature increases, the radiative opacity decreases, indicating a degradation in the radiative gradient. A radiative core is formed when the radiative opacity is superior than the adiabatic one. When the core temperature reaches about  K, the He fusion starts, while the fusion of C
 is about to begin simultaneously. These fusions are located in the core, where the temperature increases rapidly, causing the convective zone to spread out. In comparison, the radiative core has denser mass. The motion of the core consume a part of the energy released by the nuclear fusion, resulting in a decrease in luminosity. The energy loss is compensated by the C fusion. Proton-proton chain reaction happens after fusion. However, in stars with masses below
  , the proton-proton chain dominates hydrogen fusion during the main sequence. These stars do not undergo significant C fusion until much later evolutionary stages, if at all. These stars then step on to the main sequence. For stars that have the mass greater than , the core keeps contracting until the temperature reaches the threshold for CN cycle that can compensate for its energy loss. The luminosity reaches a peak just before the star steps in to main sequence5.
High-mass star
High mass stars are stars that have the mass between  to
to  6. The general pre-main-sequence is the most significant difference between high-mass stars and low-mass stars in pre-main-sequence is that the contraction period of the high-mass star is shorter than its accretion period for stars with mass higher than . The intense radiation field of the molecular cloud is where the high-mass star is originated. With the effect of evaporated ice mantle and sputtered grains in parallel, the opacity of the high-mass star reduces. Consequently, this leads to a halt of accretion for stars over
  . An alternative solution is that the core pressure is much higher than the radiation pressure, which suppresses that contraction. Based on the equation in (3) (the radiation pressure is represented by
  ,
,  represents the star luminosity and
  represents the star radius). For high-mass stars, the core pressure (
 ) dominates due to gravitational compression, while depends on temperature and scales with luminosity and radius via
  7. Thus, remains subdominant to .
(2) 
Main Sequence
In the beginning of the nuclear fusion, which means the star is the zero-age main sequence(ZAMS), the star is only a hydrogen-burning object8. As it evolves, the star increases the helium-to-hydrogen ratio in the core, and simultaneously starts a gradual move from the main sequence. The star speeds up to leave the main sequence when the hydrogen is exhausted. Main sequence is where the energy released by nuclear fusion counteracts with the gravitational pressure and thus reaches a balance, which is called hydrostatic equilibrium. The condition of the hydrostatic equilibrium can be be specified by the equation in (4), where  is the density,
  is the gravitational potential, and
  is the pressure9. The importance of hydrostatic equilibrium is to maintain the star in a stable condition. ‘Stable’ means the balance of pressure from the fusion and the gravitational pull of the core is reached, and the star remains fusing hydrogen.
(3) 
Similar to the formation phase of the star, in the main sequence, the more massive the star is, the more rapid its evolution is. This is because the more massive the star is, the higher its core temperature and pressure are, despite having a less dense core due to radiation pressure support. The nuclear fusion rate scales strongly with these conditions10. In addition, the more massive the star is, the more gravitational pressure it experiences. Thus, the
greater pressure again leads to the increase of density and temperature of the core, fueling the nuclear fusion.
Post-main sequence
When the hydrogen is exhausted, the gravitational force becomes dominant. The exhaustion of hydrogen disables the nuclear fusion, causing no internal pressure to counteract the gravitational force. The core contracts until electron degeneracy pressure (the quantum mechanical resistance to compression caused by the Pauli exclusion principle) balances gravitational collapse, or until the core temperature reaches reaches  K, enabling helium fusion. Starting from this point, the evolution of a star depends on its mass, angular momentum, chemical composition and if it is close to a binary system11.
Low-mass star
When the nuclear fusion ends, the gravitational force takes over, causing the star to contract. The hydrogen-helium core increases in mass; however, it decreases in size since the increasing helium ash (the byproduct of hydrogen fusion) enters the star through the outer hydrogen-burning shell. Under the temperature of of  K, the helium core starts the fusion. The star then steps up into the horizontal branch of the HR diagram. The temperature reaches its peak at
  K, and then the star stops heating up. When the star reaches K, the production of heavier elements exhausts the inert helium in the core. A star that has a mass less than
  becomes a red dwarf, while a star that has the mass between
  becomes a white dwarf12.
High-mass star
However, for massive stars, shell burning, which is the fusion ignited at the shell around the core that fuses heavier elements than hydrogen, occurs due to the high gravitational pressure the star experienced because of its large mass. The significant mass of the star leads to high gravitational energy, which increases the core pressure and the core temperature greatly. The regions surrounding the core, which is the shell, then reach the temperature needed to fuse other heavier elements. This process is defined as the shell burning, which the structure of the core in shell burning is shown in Figure 1 . This process ends when the energy released by the hydrogen fusion in the core is negligible in comparison with the gravitational pull. Once the hydrogen is exhausted, the core of the star contracts under gravitational pull (more gravitational energy released in this phase), with the temperature increases. This process is defined as
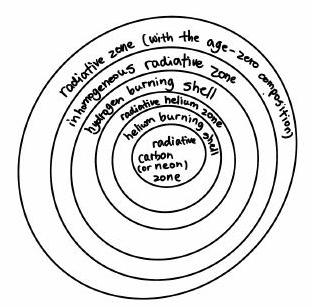
When the temperature reaches  K, it enables the onset of helium burning in the core. The hydrogen fusion starts in the shell when the energy released by helium burning at the core heats the shell up as a whole. A short period of gravitational contraction phase takes place after the exhaustion of helium, since there is no energy released by the fusion to counteract the gravitational pull. The temperature then heats up to the critical point where pure carbon fusion starts. After the carbon fusion is onset, the pure neon fusion starts. At this point, the star then has the structure shown in Figure 1. The overall structure of the star can alternatively be considered as an integration of two parts, which are the core and the envelope. The star then steps into red giant branch (RGB), or super red giant branch, and at the tip of RGB, the envelope of the star contracts and its radius decreases. For a star that has the mass less than , it becomes a red giant. A star that has the mass with
  becomes a neutron star, while a star that has the mass greater than
  collapses into a black hole.13.
Protoplanetary disk
Formation
During stellar evolution, a collapsing molecular cloud forms a protostar surrounded by a revolving protoplanetary disk. During the formation of a protostar, gas and dust from the molecular cloud are gathered to form a dense area which later collapses and becomes a protostar. The place is where the materials are densest then collapses into a protostar and the envelope disperses following the law of the conservation of angular momentum11. As the densest regions of a molecular cloud collapse under gravity, they form a protostar at the center, while
the surrounding material, due to conservation of angular momentum, flattens into a rotating protoplanetary disk, with the envelope material gradually accreting onto the protostar or being dispersed from it11. Based on the law of conservation of angular momentum 5 and 6, where  is the total mass,
  is the speed of rotation and is the total radius:
(4) 
(5) 
When there is no external torque, the angular momentum is conserved, which is the case of the collapsing molecular cloud. The angular momentum is conserved, which means the initial angular momentum equals the final one. Thus, since the mass is a constant, when speed increases, the radius decreases. The envelope becomes more dispersed, while the material in the clouds gathers together to form a disk. The disk covers a wide range (from the vicinity of the protostar to 100 ‘s AU)
The surrounding materials leftover in the formation of protostar become the ingredient of the formation of the spinning disk – the locus of planets. Thus, the protostar and its planet are made up of same ingredients that origins from the protostar formation11.
Protostars and their protoplanetary disks
The angular velocity of the core, which is the protostar, has a clear relationship with the radius of the protoplanetary disk. The relationship is presented in (7), where represents the radius of the protoplanetary disk,  represents the angular velocity of the protostar, and
  represents the time passed:
(6) 
As the time passes, when the angular rotation rate of the core increases, the centrifugal radius of protoplanetary disk increases. When the star is before the age of  yr, the disk grows fast in size and mass, and it becomes hot. After the core material is used up, the disk then decreases in temperature. There is also a relationship between the central object luminosity and the disk chemistry. The disk around low mass star lacks nitrogen, while the disk around intermediate mass star lacks CO that sticks to the cold dust grain for formation of more complex molecules. Around high-mass stars, the disk has a positive correlation of disk mass and stellar mass. However, the disk around the most massive star has a very short lifetime, which makes it difficult to detect. For low-mass star, the disk around the lower mass star has a smaller radius, which the ratio is
  . While for stars that have the mass between
  , they have no clear relationship with the disk. After the cessation of accretion and the clearing of inner disk, the whole disk undergoes rapid dissipation, that is, the process by which the material of the disk spreads out and disperses11.
Characteristics
In a wide range of different mass stars (from light, thinly distributed molecular clouds to heavy, compact stellar clusters), protoplanetary disk exists. Based on the existing research, the molecular clouds where the low mass stars form have notable consistency in average characteristic of disk across different region. These molecular clouds all have the same mid-infrared colors, spectra, mass distributions and sub-millimeter colors.
The possible explanation for this phenomenon is that except in the densest area of very young protoclusters, disk sizes are much smaller than typical distances between stars. Interactions with passing stars are not a typical significant factor in determining the evolution (however, this is not applicable in the context of close binary or multiple systems).
A universal characteristic of the protoplanetary disk is that at any particular age, the proportion of stars having disks is consistent, despite the existence of a massive star or not11.
The Hertzsprung-Russell Diagram As A Tool
The Hertzsprung-Russell diagram (HRD) is a significant tool in predicting the star’s life cycle that Ejnar Hertzsprung and Henry Norris Russel originally proposed. It is created when the stars in a cluster are found to scatter in a consistent pattern. The Hertzsprung-Russell diagram is built on the basis of the stellar evolution introduced above.
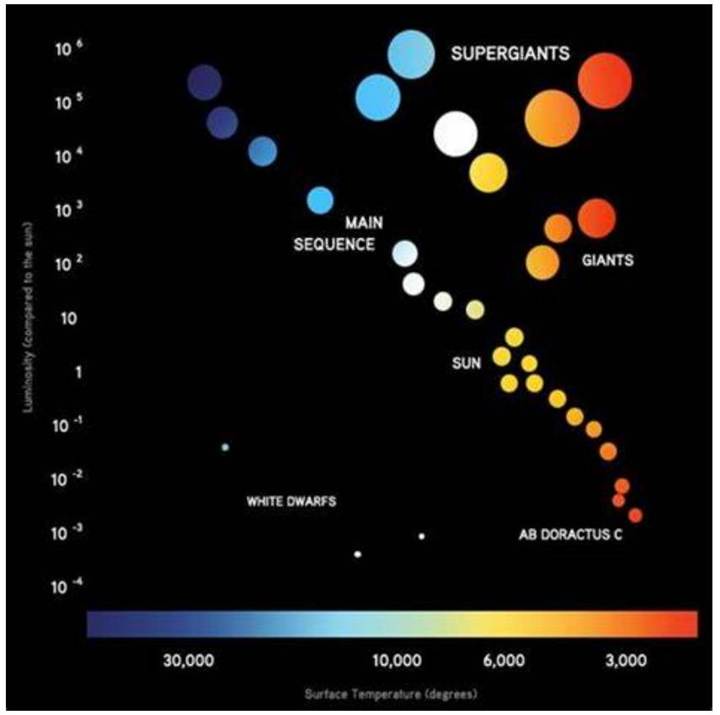
Hertzsprung-Russell diagram has surface temperature (spectral classification) as the x -axis and absolute magnitude (luminosity) as the -axis. It shows a cluster of stars in different stages of their life cycle. The size of the circle in the diagram that represents the star is in proportional with the real mass of the star. The color of the circle represents the star’s real temperature, from red to blue representing from low surface temperature to high surface temperature.
As 2 shown, the main sequence is a generally linear line from bottom right to top left, which the star with lowest temperature has the lowest luminosity and the star with highest temperature has the highest luminosity, as the color that represents the temperature from low to high ranges from red to blue. The size of the circles that represents the star’s size in the diagram ranges from small to large along with the temperature and luminosity. The size of the star represents the star mass, with larger size resulting from larger mass. Larger mass results in larger gravitational pull which leads to higher star temperature. Generally, in the main sequence, the
 .
.The white dwarf which is the final state of certain low-mass star is located below the main sequence. White dwarfs are extremely hot remnants, which enables them to emit a continuous spectrum of light. This process is called the black body radiation. The mixture of light with several wavelengths in the continuous spectrum appears to be white, which results in the white dwarf appearing with the color white. The size of the white dwarf is relatively small in comparison with the stars in the main sequence is because
The giants and super-giants are the latter states of high-mass stars, and they are located above the main sequence in the Hertzsprung-Russell diagram.They are larger in size because they are formed from high-mass stars. The high mass results in high gravitational pull which increases the pressure and leads to the high temperature and greater light emission. For supergiant stars, the mass is even greater, which leads to greater temperature and luminosity.
Illustrative Example
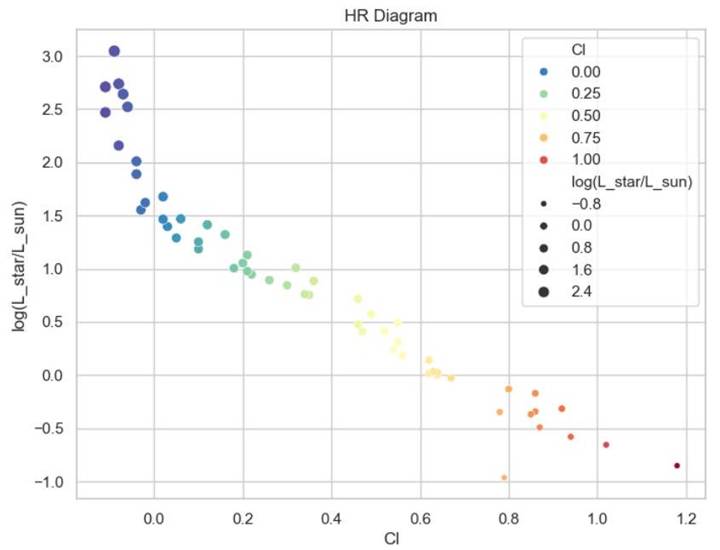
To delve deeper into Hertzsprung-Russell Diagram, real-life application of it is needed. Thus, the HRD of the Pleiades cluster, the nearest cluster from Earth is plotted. Firstly, information about the Pleiades cluster is found in the Figure 3. where the x-axis represents the color index, and the y-axis represents the luminosity of stars in . The color ranging from red to blue indicates the increase of the surface temperature of stars, and the size of the points is proportional to the logarithm of the star luminosity with respect to the Sun.
Gaia database, which gives spectroscopy, photometry, and astrometry of stars that are perceived as the main source for astronomical research14.
Using Visual Studio Code 2, the Gaia dataset is processed with Pandas and Numpy to generate a DataFrame. The workflow includes converting apparent magnitudes to absolute magnitudes, calculating luminosities, and then plotting the results in a Hertzsprung-Russell diagram using Seaborn. Specifically, Numpy is imported for numerical calculations. The apparent magnitude is converted into the absolute magnitude by plugging in the data from the data frame to 8. M refers to absolute magnitude, m refers to apparent magnitude, and d refers to the distance from Earth to the Pleiades cluster (in pc). Since the distance to Pleiades cluster from Earth is much greater than the overall size of the Pleiades cluster, the distance variations between stars in the cluster are negligible. According to modern observation from Gaia, the distance to the Pleiades cluster is considered to be 136.2pc15.
 . The color ranging from red to blue indicates the increase of the surface temperature of stars, and the size of the points is proportional to the logarithm of the star luminosity with respect to the Sun.
Lastly, the HR diagram for the pleiades cluster, which has CI (color index) as its x-axis (While color index (CI) is not the same as temperature, it serves as a reliable proxy in observational astronomy due to their strong correlation. Initial tests reveal unexplained skew in the temperature conversion process, so I choose to plot CI directly on the x-axis for transparency and consistency, while noting its limitations.), and  as its y-axis, is plotted. By using Seaborn, the approximate color and relative size of the stars in the Pleiades cluster are directly shown in the diagram 3.14.
Using Visual Studio Code 2, the Gaia dataset is processed with Pandas and Numpy to generate a DataFrame. The workflow includes converting apparent magnitudes to absolute magnitudes, calculating luminosities, and then plotting the results in a Hertzsprung-Russell diagram using Seaborn.
Specifically, Numpy is imported for numerical calculations. The apparent magnitude is converted into the absolute magnitude by plugging in the data from the data frame to 8. M refers to absolute magnitude, m refers to apparent magnitude, and d refers to the distance from Earth to the Pleiades cluster (in pc). Since the distance to Pleiades cluster from Earth is much greater than the overall size of the Pleiades cluster, the distance variations between stars in the cluster are negligible. According to modern observation from Gaia, the distance to the Pleiades cluster is considered to be 136.2pc15.
(7) 
(8) 
Lastly, the HR diagram for the pleiades cluster, which has CI (color index) as its x-axis (While color index (CI) is not the same as temperature, it serves as a reliable proxy in observational astronomy due to their strong correlation. Initial tests reveal unexplained skew in the temperature conversion process, so I choose to plot CI directly on the x-axis for transparency and consistency, while noting its limitations.), and as its y-axis, is plotted. By using Seaborn, the approximate color and relative size of the stars in the Pleiades cluster are directly shown in the diagram 3.
Conclusion
In conclusion, this paper gives a general idea on the formation of the planetary system including the formation of the star and its planets. Since the goal is to give general idea, in the stellar evolution block, only the most general types of stellar evolution are elaborated, while asymptotic giant branch evolution, planetary nebula formation, and detailed nucleosynthesis processes are deliberately left out. On a larger scale, the information of the star cluster types of stars and their distribution are given by introducing the Hertzsprung-Russell diagram. The data from a specific star cluster the Pleiades cluster is analyzed and then plotted as a Hertzsprung-Russell diagram, showcasing the application of it.
References
- Nakano, T., Ohyama, N., & Hayashi, C. 1968, Prog. Theor. Phys., 39, 1448 [↩] [↩]
- Chevance, M., Kruijssen, J. M. D., Vazquez-Semadeni, E., et al. 2020, SSRv, 216, 50 orestini, M. 1994, A&A, 285, 473 [↩]
- Bailey, A., Stone, J. M., & Fung, J. 2024, MNRAS, 534, 1127 Capozziello, S., De Laurentis, M., Odintsov, S., & Stabile, A. 2011, PhRvD, 83, 064004 [↩]
- Narita, S., Nakano, T., & Hayashi, C. 1970, Prog. Theor. Phys., 43, 942 [↩]
- Forestini, M. 1994, A&A, 285, 473 [↩]
- Motte, F., Bontemps, S., & Louvet, F. 2018, ARA&A, 56, 41 [↩]
- Forestini, M. 1994, A&A, 285, 473 [↩]
- Backs, F., Brands, S. A., Ramírez-Tannus, M. C., et al. 2024, A&A, 690, A113 [↩]
- Capozziello, S., De Laurentis, M., Odintsov, S., & Stabile, A. 2011, PhRvD, 83, 064004 [↩]
- Gasques, L., Afanasjev, A., Aguilera, E., et al. 2005, PhRvC, 72, 025806 Hayashi, C., & Cameron, R. C. 1962, NASA Report [↩]
- Williams, J. P., & Cieza, L. A. 2011, ARA&A, 49, 67 [↩] [↩] [↩] [↩] [↩] [↩]
- Iben, I., Jr. 1974, ARA&A, 12, 215 [↩]
- Hayashi, C., & Cameron, R. C. 1962, NASA Report [↩]
- Prusti, T., et al. 2016, A&A, 595, A1 [↩] [↩]
- Dahm, SE., 2015, The Astrophysical Journal, 813, 2 [↩] [↩]


