
Abstract
Pass-event logs from Tottenham Hotspur and FC Barcelona’s 2021–2022 league seasons (38 matches each) were analysed to quantify how midfield ball possession influences match outcomes. Markov-chain transition modelling yielded steady-state vectors showing victories are characterised by a 45 % midfield share—roughly ten percentage points higher than defeats—and by a shorter mean return time to the midfield zone (2.23 vs 2.86 transitions). Principal component analysis indicated that pass volume (PC1) and midfield possession (PC2) together explain 75 % of the variance, underscoring their tactical importance. Weighting transition probabilities by pass-path length suggested that a 3-2-3-2 structure maximises midfield involvement. Data reliability was confirmed through double coding (Cohen’s κ = 0.85). Although factors such as individual skill, in-game tactical adjustments, and environmental conditions were not modelled, the analytical framework demonstrates that enhancing midfield circulation measurably increases the probability of victory.
Keywords: Markov chain; soccer analytics; midfield possession; principal component analysis; mean return time; formation optimization; transition probability
Introduction
Background and Context
Research on soccer tactics shows that formations and positional roles shape match flow and ultimately determine results. Midfielders, who link attack and defence, have been explored mainly through qualitative lenses1. Yet quantitative work that applies probabilistic or econometric methods remains limited.
Rationale and Objectives
Earlier studies have focused on network metrics or regression models; few have integrated Markov-chain transition modelling with principal component analysis (PCA) to assess how positional ball-possession shares influence outcomes2. The present study fills this gap by rigorously quantifying the strategic value of midfield possession.
Scope and Limitations
The analysis draws on 38 Premier-League matches played by Tottenham Hotspur and 38 La-Liga matches played by FC Barcelona during the 2021–2022 season. Dynamic factors such as individual skill, player fatigue, opponent tactics, and real-time tactical adjustments are excluded from the model.
Literature Review
Passing-Network Analysis in Soccer
highlighted the importance of hub nodes within team passing networks3, while demonstrating that network centrality is positively correlated with match outcomes4.
Markov-Chain Modelling
Introduced a Markov-chain framework to predict tactical flow5, and proposed a statistical procedure for testing the Markov property in sports data6.
Principal Component Analysis and Match Metrics
applied principal component analysis to reduce the dimensionality of match statistics and identify the key factors that separate winning from losing teams7.
Position-Specific Performance Indicators
used regression analysis to confirm a strong association between midfielder work-rate and match results, underscoring the strategic value of the midfield zone8.
Data and Methods
Dataset Overview
Three internally generated Excel workbooks underpin the quantitative analyses (Table 1). formation.xlsx records weighted pass-path lengths for every candidate line-up and is used to test formation hypotheses; real_count.xlsx contains raw counts of passes between the four Positions (forward, midfielder, defender, goalkeeper) and feeds the Markov-chain model; real_pca.xlsx compiles eleven match statistics—shots, shots on target, overall possession, number of passes, pass accuracy, fouls, yellow cards, red cards, offsides, corner kicks, and midfielder possession—for principal-component analysis (PCA).
| Dataset | Description | Usage |
| formation.xlsx | Pass-distance matrix by formation | Formation optimisation |
| real_count.xlsx | Pass counts between Position | Transition-matrix & steady-state analysis via Markov chain |
| real_pca.xlsx | Eleven key match statistics (shots, sot,bp,pn,pp..) | PCA of decisive factors |
Data-Reliability Verification
After the initial data collection, two independent analysts double-coded every pass event. Inter-rater agreement reached Cohen’s κ = 0.85 (95 % CI 0.80 – 0.90, p < 0.001), a level classified as “almost perfect,” justifying subsequent modelling.
Construction of the Transition-Probability Matrix
Using real_count.xlsx, a transition-probability matrix (TPM) was built to quantify ball-movement patterns among positions. For each match, the observed number of passes from position i to position j (nij) was divided by the row total, yielding the transition probability pij (Equation 1).

Extraction of the Steady-State Vector
The steady-state vector  , derived from the TPM
  , represents the long-run share of ball possession for each position. From , the mean return time (MRT) for position
  was calculated as
  , allowing comparison of ball-recovery ability between positions

Principal Component Analysis (PCA)
Principal component analysis was conducted to identify the main axes of variation linking match outcomes (win, draw, loss) with performance indicators. The eleven variables in the “real game stat” sheet of real_pca.xlsx—shots, shots on target (sot), ball possession (bp), number of passes (pn), pass accuracy (pp), fouls (f), yellow cards (yc), red cards (r), offsides (o), corner kicks (c), and midfielder possession (mbp)—were included. Component eigenvalues and loadings were inspected, with special attention to the tactical meaning of midfielder possession.
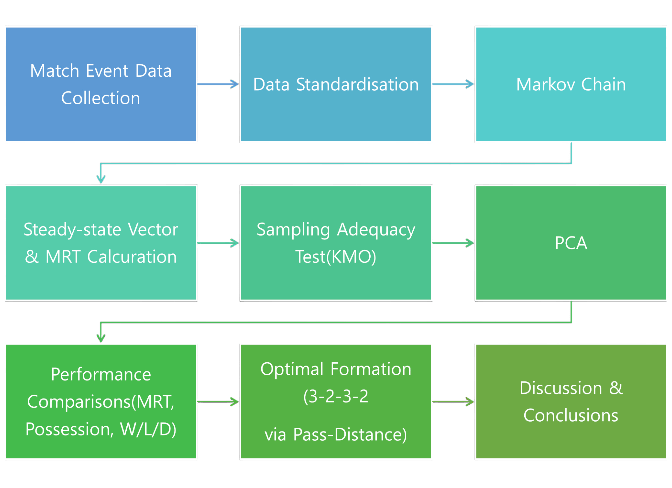
Through these three steps, the study systematically examines the effect of positional ball possession on match outcomes and objectively evaluates the importance of midfielders.
Results
Verification of Ball Possession Based on Pass Accuracy
Ball-possession was verified with reference to pass-accuracy in the Round 15 Premier-League match between Tottenham Hotspur and Norwich City in the 2021-22 season. Match statistics supplied by the official Premier-League website were analysed.

Tottenham recorded 85 % pass accuracy and 40 % possession, whereas Norwich recorded 88 % pass accuracy and 60 % possession. From these figures a transition-probability matrix was constructed; the associated steady-state vector closely matched the observed possession split, indicating the validity of the method. To verify this finding, four additional matches were selected and subjected to the same analysis; the results are summarized in Table 2.
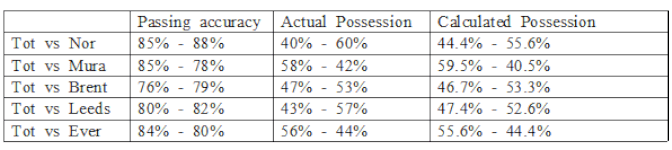
As shown in Table 2, the model’s estimates deviate from the observed possession by an average of just ±1.5 %, demonstrating that pass-accuracy data alone can yield a highly accurate measure of ball possession.
Intra-Team Ball Possession
To observe how passes were actually exchanged inside the team, every pass in the same Tottenham–Norwich match was independently coded by two observers for the full 90 minutes. Cohen’s κ was 0.85 (95 % CI 0.80–0.90, p < 0.001), confirming almost-perfect agreement and validating the dataset. Table 3 lists the raw pass counts among our four positional zones and the opponent’s zone.

Using these figures, passing probabilities are calculated, organised into a transition-probability matrix, and visualised as a heat map.

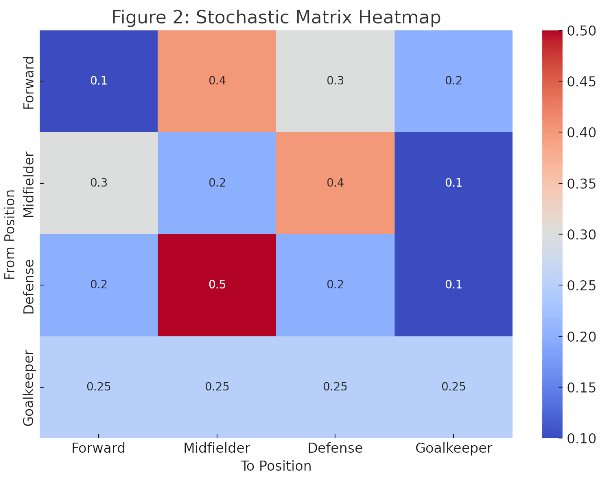
The matrix is ‘irreducible’ (e.g., F → D = 0.03, D → M = 0.11) and ‘aperiodic’ (self-transition M → M = 0.12 > 0), satisfying the prerequisites of a Markov chain.
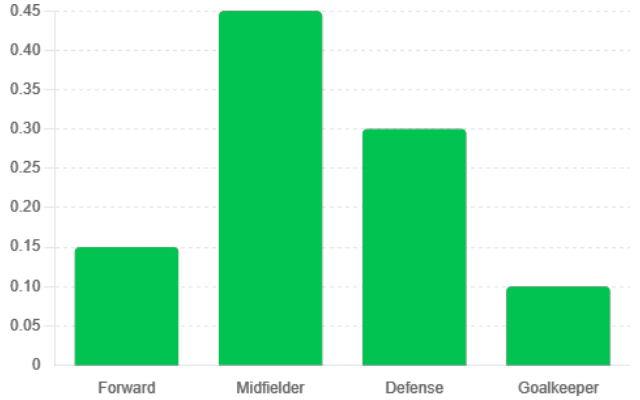
Because P is strongly connected and aperiodic, the Perron–Frobenius theorem guarantees a unique positive eigenvector π. After normalising π and excluding the opponent zone, the values were converted to percentages, yielding the steady-state estimate of positional possession. The resulting vector (Table 5) and its accompanying graph show that midfielders hold the largest share of possession, confirming their central strategic role.

Positional Possession and Mean Return Time
Each playing position was first encoded as an integer label (forward = 1, midfielder = 2, defender = 3, goalkeeper = 4). Using these codes, transition counts between positions were tallied for all 76 league matches contested by Tottenham Hotspur and FC Barcelona in the 2021–22 season; the results were stored in real_count.xlsx. From these counts a transition-probability matrix was built, and the corresponding steady-state vector was obtained.

The steady-state vector was then used to compute the mean return time. Mean return time is defined as the reciprocal of the average element of the steady-state vector and represents the time required for the ball to cycle back so that each position group can reorganise tactically. A shorter mean return time for midfielders indicates that the team can regain possession and reset more quickly, thereby raising the likelihood of winning. In fact, as shown in the table below, winning matches exhibit a markedly shorter mean return time for midfielders, whereas the other positions display longer values, implying that passes were directed to midfielders more frequently.
| Position | Forward | Midfielder | Defender | Goalkeeper |
| Mean return time | 5.420 | 2.165 | 3.459 | 15.873 |
Comparison of Positional Possession & Mean Return Time by Match Result
For every match, the steady-state vector was sorted into win, loss, or draw categories to explore how positional ball possession influences the final result. The vectors belonging to each category were averaged to obtain the positional possession shares, and the associated mean return times were then calculated.
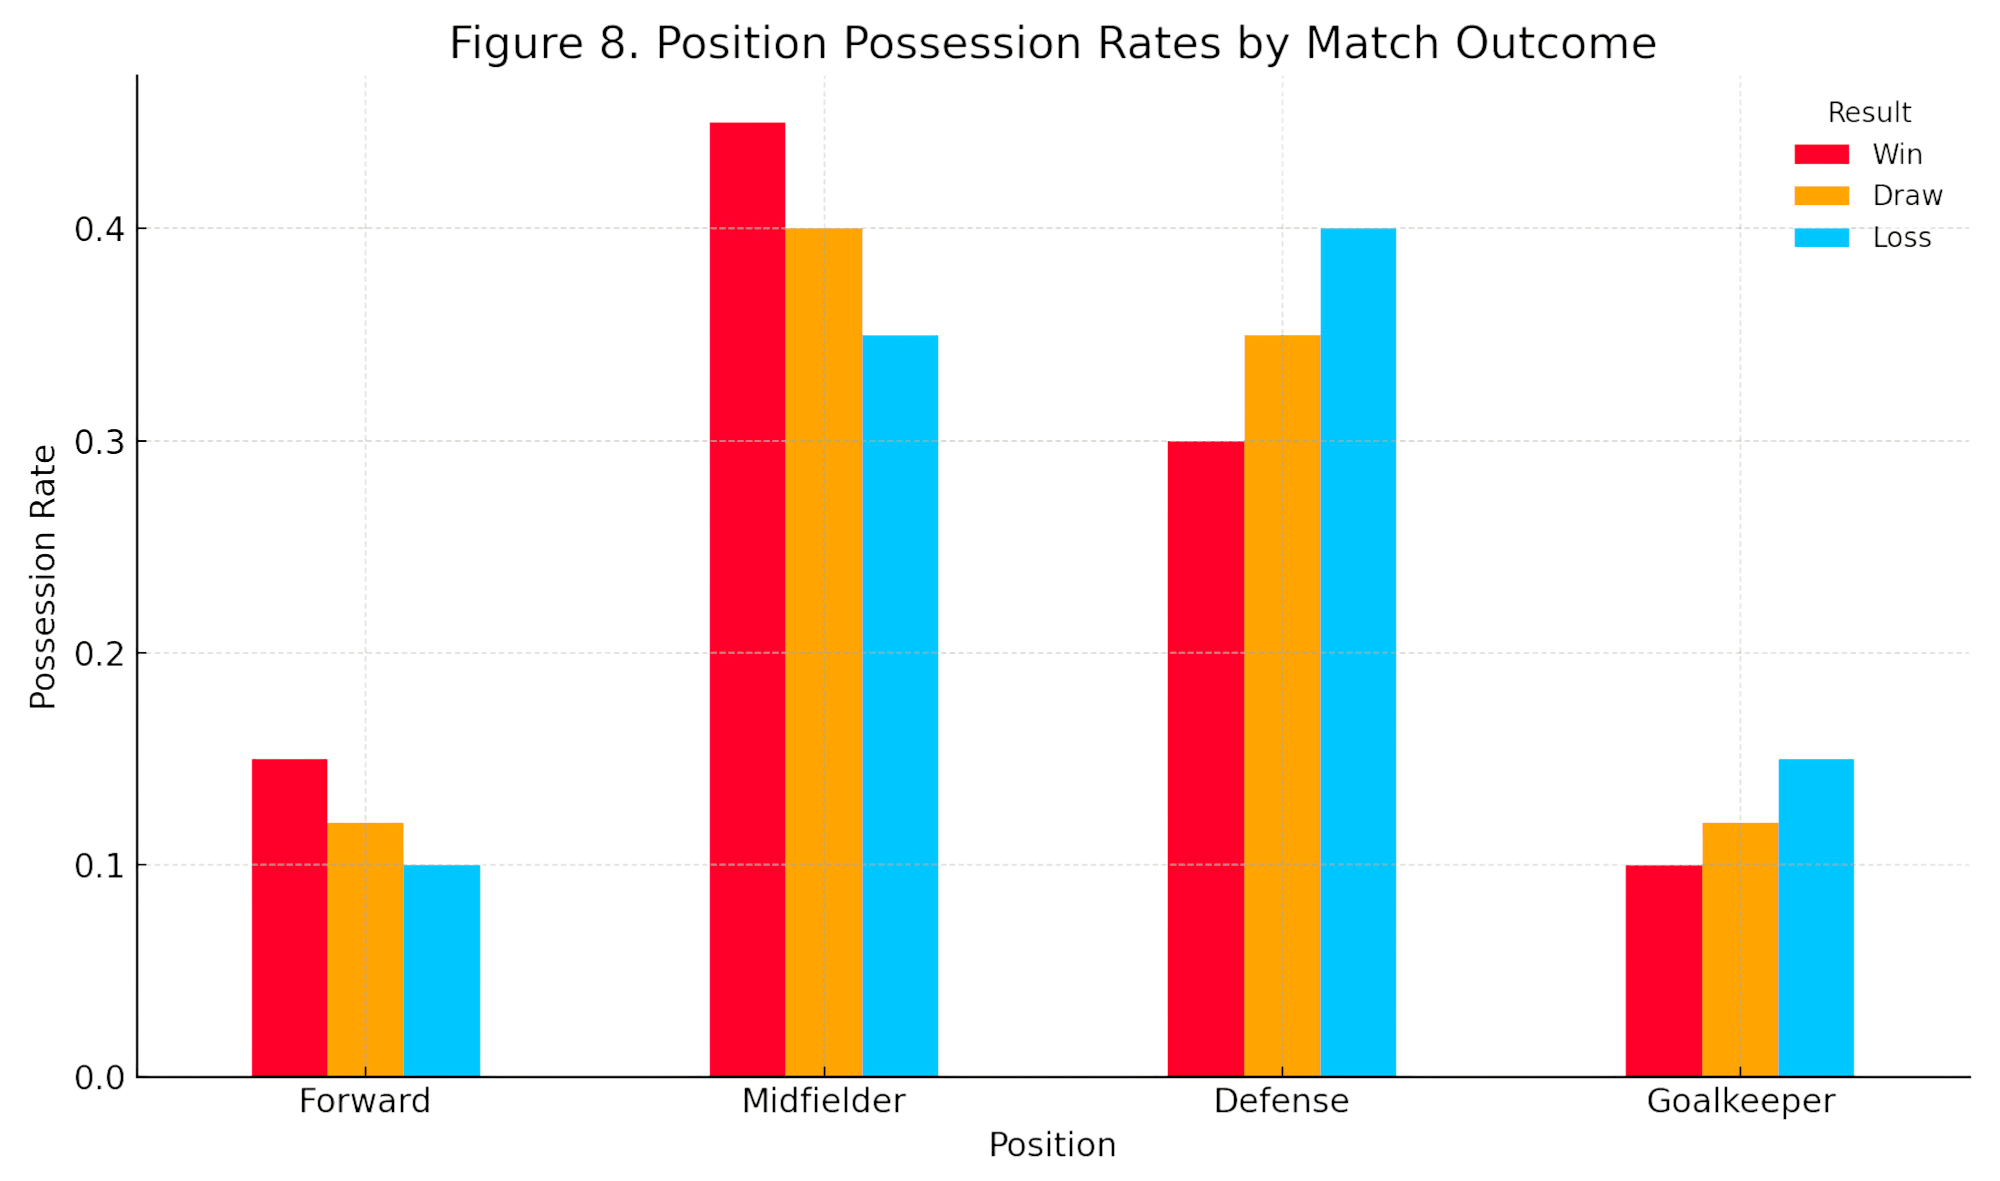
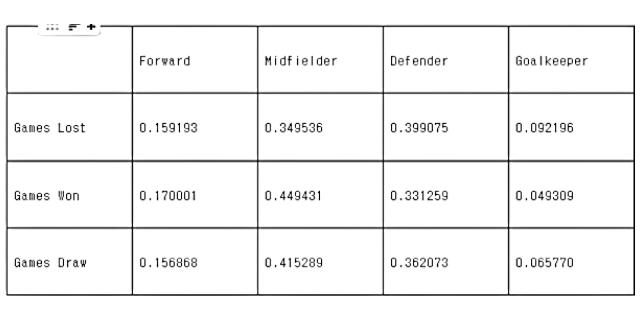


Figure 7 and Table 7 together with Figure 8 and Table 8 reveal two key patterns. First, the goalkeeper’s share of ball possession in lost matches is roughly twice that in victories, indicating that more opposition shots forced the goalkeeper into frequent contact with the ball. Second, the zone showing the largest gap between wins and losses is the midfield: while victorious games exhibit a midfield share as high as 45 %, the corresponding figure drops to 34 % in defeats. These findings suggest that maintaining a high level of midfield possession markedly increases the likelihood of winning.
PCA Results
To single out the most decisive match indicators, a principal component analysis (PCA) was performed. Eleven variables were analysed—shots, shots on target (sot), overall ball possession (bp), number of passes (pn), pass accuracy (pp), fouls (f), yellow cards (yc), red cards (r), offsides (o), corner kicks (c), and the midfielder-specific possession share calculated in this study (mbp). All variables are organised in real_pca.xlsx.
PCA Procedure
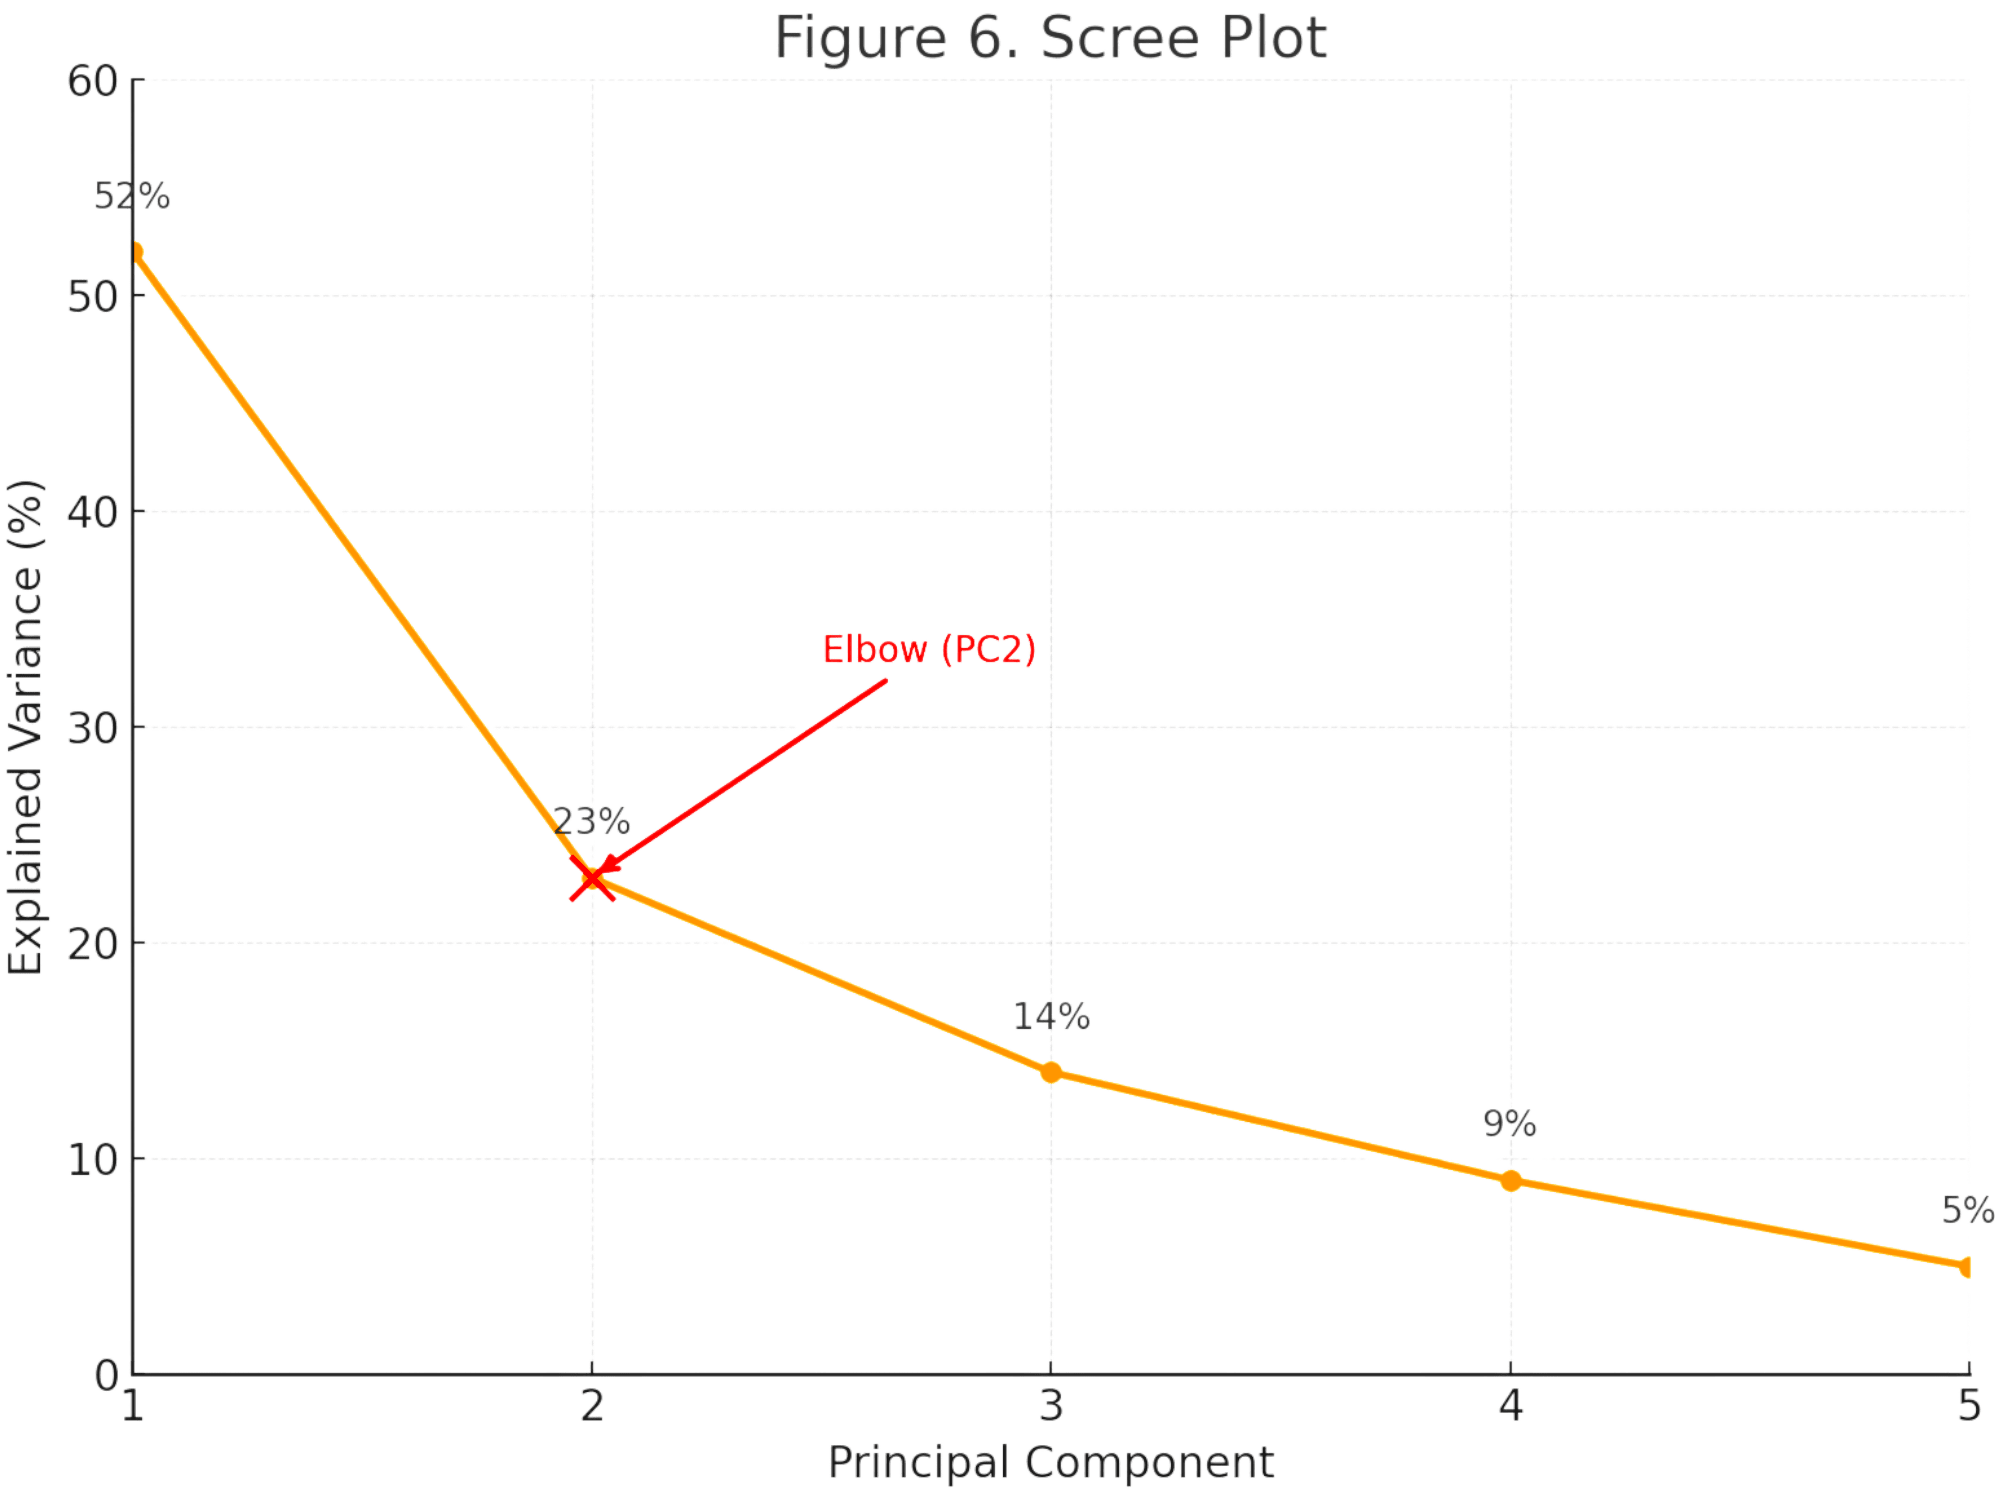
First, each variable was Z-score standardised to eliminate unit differences, after which a covariance matrix was computed. Suitability tests yielded a Kaiser–Meyer–Olkin (KMO) overall index of 0.716—classified as “middling” and therefore acceptable for PCA—and Bartlett’s test returned χ²(55) = 276.9, p < 0.001, confirming factorability. Eigenvalues were then calculated, the proportion of variance explained by each component was derived, and a scree plot was generated to determine the number of principal components to retain.

PCA Findings
The results are summarised in Table 10 and Figure 9; the scree plot shows a distinct elbow after the third component. Table 11 lists the loading values, indicating how strongly each variable contributes to a given component. The first three components together account for 89 % of the total variance, comfortably exceeding the conventional 80 % threshold, so a three-factor solution was adopted.
- PC1 explains 52 % of the variance and is dominated by the number of passes (loading = 0.995), signalling that passing volume is the most influential single metric.
- PC2 accounts for 23 % of the variance; the midfielder possession share (mbp) shows a high negative loading (-0.975), underscoring midfield control as a pivotal determinant of match outcome.
- PC3 captures 14 % of the variance and loads most heavily on pass accuracy (-0.679) and overall possession (0.559), both linked to match tempo and territorial dominance.

| shots | sot | bp | pn | pp | f | yc | r | o | c | mbp | |
| PC1 | 0.01 | 0.006 | 0.088 | 0.995 | 0.035 | -0.01 | 0.0 | 0.0 | 0.001 | 0.005 | 0.014 |
| PC2 | -0.08 | -0.12 | 0.126 | 0.001 | 0.059 | -0.089 | 0.016 | -0.012 | -0.031 | 0.024 | -0.975 |
| PC3 | -0.187 | -0.086 | 0.559 | -0.019 | -0.679 | 0.411 | 0.033 | 0.007 | 0.05 | -0.108 | 0.016 |
The principal-component analysis confirms that several key variables play a decisive role in determining match outcomes. In particular, midfielder ball possession and total pass count exert the greatest influence, indicating that strategically reinforcing the midfield zone to raise possession is an effective way to improve the probability of victory. Figure 10 presents a scatter plot of the first two principal components (PC1 and PC2), clustered by match result; winning games are generally distributed in the positive region of PC1.

Suggested Formations for Maximising Midfielder Possession
Formations Derived from Positional Ball-Possession Shares
In matches won, the average steady-state shares were forward 0.17, midfielder 0.45, defender 0.33 and goalkeeper 0.05. Rounding these ratios to whole numbers (2 : 5 : 3 : 1) points to a basic 3-5-2 shape. Depending on whether the five midfielders play above or below the centre line, this general shape can be refined into the four variants illustrated in Figure 11: 3-2-3-2, 3-3-2-2, 3-1-4-2, and 3-4-1-2.

Selecting the Most Effective Formation
Among the four candidate shapes, the one that yields the highest midfielder possession is identified through a pass-distance model:
First, measure pass distance. A pass to an adjacent teammate is assigned a distance of 1; each additional teammate traversed in the passing path adds 1. Figure 12 shows an example centred on the central defender (DC) in a 3-2-3-2.
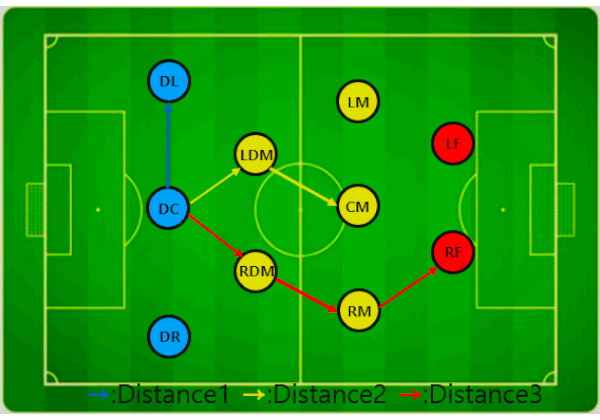
Second, count all possible passes by distance. For each formation, lines are drawn between adjacent players, the number of potential passes at each distance d is counted, and the counts are expressed as proportions. These data are collated in formation.xlsx.
Third, build a distance-weighted transition matrix. For distances ≥ 2, each probability is multiplied by the weight, reflecting the distance-dependent Markov model9 , and Opta Analyst’s finding that every extra 10 m lowers pass-success probability by ≈ 50 %10.
Finally, the steady-state vector is computed from the transition matrix, providing an estimate of positional ball possession for the formation.

Applying this procedure, the summed weights of midfielder pass paths rank as follows: 3-2-3-2 (7 747) > 3-4-1-2 (7 159) > 3-3-2-2 (6 575) > 3-1-4-2 (6 219). The steady-state vectors (Table 12) confirm that 3-2-3-2 delivers both the highest midfielder share and the greatest cumulative pass-path weight, marking it as the most effective option.
Discussion
This study demonstrates quantitatively that midfielders occupy a decisive position in soccer. When a larger share of passes is channelled into the midfield zone, the steady-state vector shows a higher midfield possession rate and the mean-return-time (MRT) analysis indicates faster ball retrieval, both of which raise the probability of victory. Principal-component analysis further singled out midfielder possession as the primary driver of match success.
By converting these findings into concrete numbers, the research proposes formations that allocate four or five players to midfield while still preserving fluid passing links. Such metrics provide coaches with an objective basis for selecting strategies and formations that fit their squad’s unique characteristics.
Several limitations must be acknowledged. The sample comprises only two clubs—Tottenham Hotspur (Premier League) and FC Barcelona (La Liga)—and 76 league matches; applying the model to other leagues or larger datasets will require recalibration. Individual skill, fitness, weather, injuries and other situational factors were excluded, so real-world outcomes may diverge from the model’s predictions.
The distance weights used in Table 12 were derived from a single league context; they may vary with tactical styles or league characteristics. Indicators such as home-versus-away status and opponent ranking could not be collected and were therefore omitted, imposing further constraints.
In addition, the absence of an observed steady distribution for cumulative possession after the 75th-minute mark limits strict statistical testing of the Markov assumption, and the dataset was too small to permit robust regression analysis—both notable shortcomings of the present work.
Nevertheless, despite these limitations, the present study can still aid tactical research in soccer, because it illustrates how teams can quantitatively diagnose and improve the phases of play that matter most to them, according to their specific circumstances—whether they rely on a group of rapid forwards, boast numerous tall aerial targets, or are an underdog whose overriding objective is simply to avoid relegation.
Future research should incorporate GPS tracking to obtain finer-grained positional data, reflect opposition tactics to enrich data diversity, and control opponent strength so that regression methods can be applied. If such extensions achieve a reasonable level of generalisability, they will further advance tactical analytics and help teams craft bespoke game plans that delight supporters while pursuing their competitive goals.
References
- R. Aquino, C. Carling, L.H. Palucci Vieira, G. Martins, G. Jabor, J. Machado, P. Santiago, J. Garganta, E. Puggina. Influence of situational variables, team formation and playing position on running performance and network analysis in Brazilian professional soccer players. Journal of Strength and Conditioning Research. 34(3), 808–817. (2020). https://doi.org/10.1519/JSC.0000000000002725. [↩]
- J. Castellano, I. Echeazarra. Network‑based centrality measures and physical demands in football regarding player position: Is there a connection? A preliminary study. Journal of Sports Sciences. 37(23), 2631–2638. (2019). https://doi.org/10.1080/02640414.2019.1589919. [↩]
- J. Gama, P. Passos, K. Davids, H. Relvas, J. Ribeiro, V. Vaz, G. Dias. Network analysis and intra-team activity in attacking phases of professional football. International Journal of Performance Analysis in Sport. 14, 692–708. (2014). https://doi.org/10.1080/24748668.2014.11868752. [↩]
- T.U. Grund. Network structure and team performance: the case of English Premier League soccer teams. Social Networks. 34, 682-690. (2012). https://doi.org/10.1016/j.socnet.2012.08.004. [↩]
- J. López Peña. A Markovian model for association football possession and its outcomes. (2014). https://arxiv.org/abs/1403.7993. [↩]
- Y. Zhang, Q. Zhang, R. Yu. Markov property of Markov chains and its test. Proceedings of the International Conference on Machine Learning and Cybernetics. 4, 1864–1867. (2010). http://dx.doi.org/10.1109/ICMLC.2010.5580952. [↩]
- A. Dellal, K. Chamari, Del P. Wong, S. Ahmaidi, D. Keller, R. Barros, G. N. Bisciotti, C. Carling. Comparison of physical and technical performance in European soccer match-play: FA Premier League and La Liga. European Journal of Sport Science. 11, 51–59. (2011). https://doi.org/10.1080/17461391.2010.481334. [↩]
- C. Lago-Peñas, A Dellal. Ball-possession strategies in elite soccer according to the evolution of match score: the influence of situational variables. Journal of Human Kinetics. 25, 93–100. (2010). https://doi.org/10.2478/v10078-010-0036-z. [↩]
- T. Narizuka, K. Yamamoto, Y. Yamazaki. Statistical properties of position-dependent ball-passing networks in football games. Physica A: Statistical Mechanics and Its Applications. 412, 157–168. (2014). https://doi.org/10.1016/j.physa.2014.06.037. [↩]
- Opta Analyst. Expected pass completion (xP): measuring the probability of a successful pass. https://theanalyst.com/eu/2021/08/expected-pass-completion-explained. (2021). [↩]


