
Abstract
Aphasia is a devastating consequence of stroke, resulting in severe language impairment that is detrimental to an individual’s social, emotional, and economic well-being. Predicting aphasia severity is difficult with current methods such as Western Aphasia Battery (WAB) which is extremely resource and time-intensive and requires the presence of a speech and language pathologist. There is also a need to look beyond behavioral and communicative data to additional critical information such as patient demographics and neural characteristics. In this study, we used and compared 5 types of machine learning models with optimization on a clinical data set of patients with chronic post-stroke aphasia to automatically predict their aphasia severity. We also made our AI explainable using game theory based shapley values to understand which patient factors from demographics, aphasia type, and MRI scans of stroke lesions are most predictive of aphasia severity. We found that the random forest model had the highest accuracy prediction of aphasia severity with mean accuracy of 0.7504  0.1079\%. Using AI explainability, we showed that lesion volume from MRI and patient age were the best predictors of aphasia severity. Applying this research will make the diagnosis process more efficient and less burdening on patients and healthcare providers. Interpreting explainability results will also help understand patient variability to develop tailored treatments. Our findings can provide valuable insights into factors contributing to an individual patient’s aphasia severity, allowing healthcare providers to create more personalized treatment and rehabilitation that can better suit patients’ needs.
Key words: Post stroke aphasia, language neuroscience, machine learning, explainable AI
Introduction
Aphasia is a severe language and communication disorder most often caused by a stroke. One-third of stroke victims develop aphasia, and over two million people in the United States suffer from post-stroke aphasia1. Those with aphasia have difficulties speaking, understanding speech, reading, writing, and may be incapable of communication. It has damaging consequences on a patient’s emotional well-being, leading to a loss of freedom and disrupting daily life2, potentially causing depression and social isolation3.
The diagnosis process for determining aphasia severity is time-consuming and tedious. Western Aphasia Battery (WAB) is mostly commonly used by speech-language pathologists to assess the linguistic skills of adults with aphasia. It tests for both verbal and nonverbal language and is used to identify and classify the type of aphasia as well as its severity. However, this method is not efficient or feasible for all patients. With over 8 subsets and 32 tasks, it can take over two hours4, and along with the rigor of the testing, it can place a burden on patients, families, and the healthcare team. Additionally, it can induce financial strains on patients and families, with the evaluation being too expensive to be accessible to all patients5. This calls for the need for quicker and more efficient methods of diagnosis that can test for aphasia severity.
Even with those diagnostic methods, it is difficult for healthcare providers to predict whether the aphasia will affect patients short or long-term, as some can recover in a few days or weeks while others may take years, decades, or suffer lifelong6. Most diagnostics and treatments focus on behavioral aspects of patients and their ability to communicate, disregarding important neural factors and an individual’s demographic profile7. Additionally, there is significant unexplained variability in language recovery for each individual6. This is due to aphasia treatment being effective at the group level but varying significantly among individuals. This makes the task of recovery prediction difficult and has called for further research with a holistic approach to better understand how different factors affect an individual for personalized rehabilitation1.
There is a gap in knowledge on how individual profiles lead to varying aphasia severity levels, making it difficult to diagnose and treat aphasia. This study takes a novel approach towards developing personalized treatment through the use of explainable AI, one of the first few applications in aphasia severity research, making this study clinically usable. Previous studies have mainly focused on acute aphasia, less than 6 months post stroke8,9,10. However, this study advances existing work by focusing on chronic stroke, which is important to research because it takes up a much larger period of a patient’s life. This study also compares 5 different models to identify which machine learning approach will lead to the best predictions of aphasia severity, providing a foundation for future work.
By using machine learning to create models that can predict the severity of aphasia and find the most important factors in determining severity, more optimal treatment can be used to tailor to each patient’s need, making recovery more manageable. The goal is to make the lives of patients, families, and healthcare providers easier by providing a tool to efficiently diagnose the severity of aphasia and reduce the current uncertainty and frustration surrounding aphasia treatment and recovery. Different variables of stroke characteristics and patient demographics can affect aphasia severity, and this study will help understand the connection to help create more personalized treatment options with a more comprehensive understanding of each individual, thereby making the recovery process easier.
When comparing 5 different AI models in predicting an individual’s aphasia severity based on patient demographics and stroke severity, we expect our best-optimized model to exceed 70% accuracy. Given dataset constraints and prior knowledge about AI model architecture, we expect random forest to perform best in this research context. Further, we expect the lesion volume to have the most significant effect on aphasia severity and aphasia type, sex, and race to have the least effect.
This is a retrospective study on publicly available data of chronic aphasia patients, taking in factors including aphasia type, age of stroke, lesion volume, sex, race, and wab days (days after stroke). 5 machine learning models were used, and parameters were tuned to get the best-fit model to determine the highest accuracy of aphasia severity prediction.
Results
| Model | Accuracy | Precision | Recall | F-1 Score | AUC-ROC |
| Logistic Regression | 0.5960 0.1012 | 0.6399 0.1059 | 0.5960 0.1012 | 0.5765 0.1121 | 0.6084 0.1006 |
| K-Nearest Neighbor | 0.6857 0.1164 | 0.7086 0.1251 | 0.6857 0.1164 | 0.6845 0.1136 | 0.6851 0.1173 |
| Support Vector Classifier | 0.7136 0.0626 | 0.7272 0.0756 | 0.7136 0.0626 | 0.7051 0.0685 | 0.7004 0.0750 |
| Random Forest | 0.7504 0.1079 | 0.7724 0.1161 | 0.7504 0.1079 | 0.7464 0.1089 | 0.7460 0.1134 |
| Neural Network | 0.5353 0.0759 | 0.7570 0.0016 | 0.5353 0.0759 | 0.3766 0.0844 | 0.5000 0.0000 |
Note: All of the metrics in the table are from a ten-fold cross validation with the standard deviation. AUC-ROC = Area Under the Receiving Operating Characteristic Curve.
Analysis of Machine Learning Models
Logistic Regression
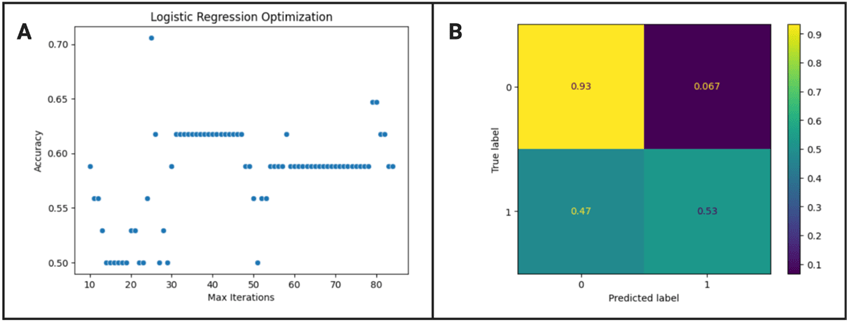
The optimized max iteration value of the logistic regression model was 25 as shown in figure 1 A, resulting in a ten-fold cross validation accuracy mean and standard deviation of 0.5960 0.1012 %. Based on figure 1 B, there is a high true positive and negative, meaning patients are likely to be correctly diagnosed, but the model is a lot more likely to call severe cases as severe rather than non-severe cases as non-severe. According to Delong’s test, the logistic regression model is statistically different from the random forest model (z score = -6.065, p < 0.01) and neural network model (z score = -6.222, p < 0.001), but not significantly different from the KNN model (z score = 0.672, p = 0.502) and SVC model (z score = -3.181, p = 0.0015).
K-Nearest Neighbor

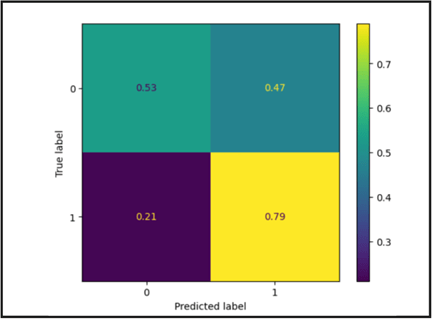
According to figure 2 A, the optimized neighbor number of the KNN model was 25, resulting in a cross validation accuracy of 0.6857 0.1164%. Based on figure 2 B, there is a high true positive and negative, meaning the model is likely to correctly diagnose severity. While the model is more likely to correctly diagnose non-severe aphasia as non severe, the prediction of non-severe and severe aphasia is overall balanced. From the Delong’s test, it can be seen that the KNN model is significantly different from the random forest model (z score = -5.861, p < 0.01) and neural network (z score = -7.179, p < 0.01) but not significantly different from SVC (z score = -2.824, p = 0.0047) and logistic regression.
Support Vector Classifier
The cross validation accuracy of the SVC model was 0.713 0.0626%. Based on figure 3, there is a high true positive and negative. However, the model is significantly more likely to call non-severe cases as not severe compared to severe cases as severe. According to DeLong’s test, the SVC model is statistically different from the random forest model (z score = -4.617, p < 0.01) and neural network (z score = 12.622, p < 0.01) but not statistically different from the logistic regression and KNN models.
Random Forest
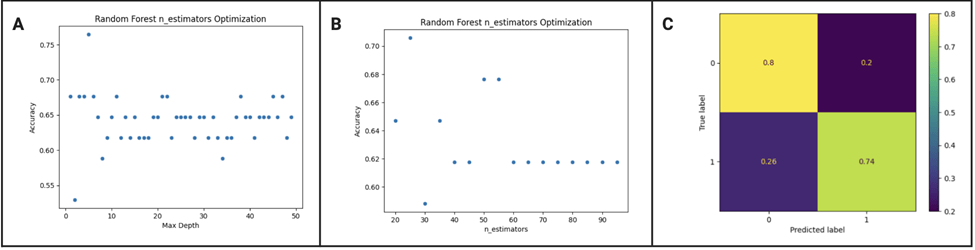
We tested a range of values for max depth and number of estimators and found that the best max depth was 22 and the best number of estimators was 55. With those parameters, the random forest classifier trained using tenfold validation gave a mean accuracy of 0.7504 0.1079%. Based on figure 4 C, there is a significantly high true positive and negative, meaning the predictions are likely correct. The model is slightly more likely to call severe aphasia as severe compared to calling non-severe aphasia as non-severe, but the diagnosis is generally balanced. The random forest model performed significantly better than the other models in every aspect of the accuracy report including accuracy, precision, recall, f-1 score, and AUC-ROC as shown in table 1. This is supported by DeLong’s test which gave a p value < 0.01 when compared to every other model, showing how the performance of the model is statistically better. The cross validation scores also show that the random forest model is performing well across different subsets of data[1] .
Neural Network

The neural network model was not optimized due to the constraints of a small data set. Even when the model was optimized with a different number of hidden layer sizes, it still didn’t perform optimally, with the mean cross validation accuracy at 0.5353 0.0759%. The significantly low performance of the neural network model is also supported by the DeLong’s test, which resulted in a p value < 0.01 when compared to the other machine learning models.
Explainability of Random Forest Model

In figure 6 A, we can see that lesion volume is the most significant predictor of aphasia severity, with a smaller lesion volume predicting less severity and a higher lesion volume being associated with more impairment. Aphasia type and age at stroke are also significant predictors of severity, with smaller ages diagnosing less severe aphasia and larger ages identifying severe aphasia. Additionally, different types of aphasia are associated with different severity of aphasia. WAB days (days post stroke) show some correlation to prediction but much less significant. The initial days are scattered between severe and non severe while the later days are leaning towards more severe. The plot shows that sex and race aren’t as significant in the severity prediction. Figure 6 B shows how lesion volume and aphasia type are significantly more predictive than the rest of the features as the error bars do not overlap with the other features. Age at stroke and days post stroke are also significantly different from race and sex. [1]

The relationships of the key features are shown in figure 7. The strong correlation of lesion volume reinforces the idea that lesion volume does have a significant effect on severity prediction. The downward linear trend clearly shows that a greater lesion volume results in higher severity while a smaller lesion volume results in less severity. Age also has a strong correlation, and older patients have more severe aphasia compared to younger patients. WAB days creates an inverse parabolic curve. At the start of the graph, the data is inconsistent because it’s difficult to predict whether a patient will have severe or non severe aphasia during the beginning stages. However, as the WAB days increase further, there is a downward trend where the model predicts more severe aphasia. For WAB type, the model shows that anomic and conduction aphasia are less severe while global and wernicke aphasia are more concentrated towards being severe. This aligns with the literature as anomic aphasia is a milder form, where patients are able to speak and use correct grammar but struggle to find the right word, and this aligns with the model.[1] Global aphasia is also known to be one of the most severe forms of aphasia as it affects all aspects of language.11. Additionally, for female patients, the data is more spread out while the prediction for male patients is leaning towards not severe. However, this is not as significant.
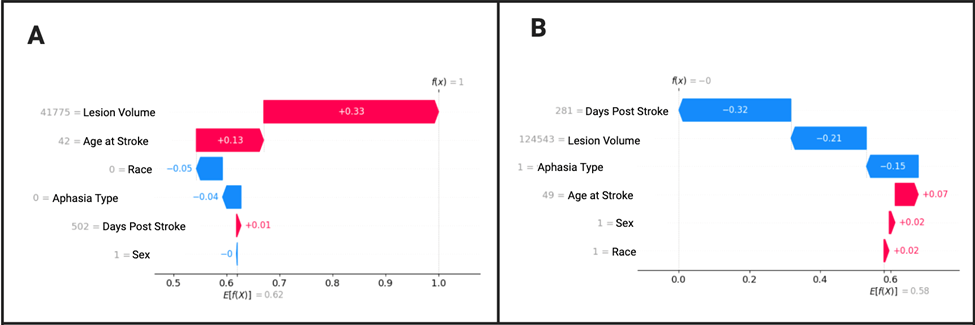
Figure 8 A displays a correct prediction of a non-severe patient. Lesion volume is clearly the greatest predictor of severity level. Age at stroke is also a factor, although much less. Race and wab type have barely any significance, and wab days and sex have almost no significance in predicting severity, and are even pushing the diagnosis of the patient towards more severe. For figure 8 B, a patient is correctly diagnosed with severe aphasia with WAB days being the most significant predictor followed by lesion volume. WAB type also has a minor role.
Discussion
In this study, we successfully created 5 optimized machine learning models with feature explainability. Based on optimization results, the highest performing model was random forest with the best accuracy of 76.47%, higher than other studies in the literature. We have also applied cutting edge explainability work, making our results transparent and trustable. The insights from feature importance means that the model can be applied and implemented in healthcare, expediting the diagnosis process and paving the way for personalized treatment and rehabilitation.
This research extends beyond prior models in the literature by achieving notable accuracy and incorporating explainability techniques that enhance clinical applicability . Day et al. (2021) applied natural language processing and machine learning to classify aphasia severity based on discourse transcripts, achieving 73% classification accuracy with a random forest model.12. Kristinsson et al. (2021) used multimodal neuroimaging classification to predict aphasia severity with support vector regression models1. However, their study did not focus on classification accuracy or explainability. Lee at al. (2021) used diffusor tensor imaging to classify aphasia severity based on language-related white matter integrity but did not include machine learning explainability methods to show the importance of individual features13. In contrast to these works, our study not only achieves a high classification accuracy but also uniquely incorporates SHAP-based explainability to identify key predictive features, such as lesion volume and age. By combining strong model performance with interpretability, this study encourages others to use tree based classification models with explainability in healthcare applications to address a critical gap in clinical transparency.
As hypothesized, out of all the models, the random forest model is the most likely to diagnose severe aphasia patients as severe and non-severe aphasia patients as non-severe. Even with the slight imbalance of severe aphasia being more likely to be called as severe, in an actual diagnosis situation, patients are better off having a misdiagnosis of severe aphasia as extra treatment is safer than less treatment. In addition, the model predicted both severe and nonsevere aphasia with similar precision, recall, and f-1 score, making the model the most reliable. The high performance of the random forest model could be due to the reduction of overfitting through averaging multiple decision trees, making the model robust while maintaining higher accuracy especially with a smaller dataset in this study. Additionally, internal cross validation is built into the random forest model through bootstrapping, where each tree within the forest takes a random subset of data and features to prevent overfitting.
Explainability results show stroke lesion volume to be the most significant predictor of aphasia severity. This has confirmed insights from prior literature suggesting that larger, more severe strokes have led to worse outcomes14. In addition to the type of aphasia, patient age was also shown to have an association with aphasia severity, where younger patients were more resilient and had less impairments. This is insightful in clinical decision making as a strong predictive role of lesion volume can help healthcare practitioners identify patients at a higher risk of persistent aphasia, allowing for early intervention with intensive speech-language therapy for those with larger lesions. Similarly, recognizing the effect of age will guide the tailoring of rehabilitation plans as older patients may need more rigorous treatment and support. When considering the role of time elapsed post stroke in severity prediction, the results showed that less time makes prediction more difficult. However, a longer amount of time is a more significant predictor given that patients who have aphasia for more time tend to have more severe aphasia. This may be explained by the fact that the data is from a cohort that volunteered to participate in long term research, so someone with chronic deficits would be more likely to be captured by this data collection rather than someone who has recovered. Although temporal factors are not the most relevant to this research, future work could investigate them more systematically by looking at different temporal factors across many different patients which would inform rehabilitation planning. Regarding treatment implications, there is evidence that the first three months post-stroke have a critical period of neuroplasticity, in which patients are most responsive to therapy15. This suggests that early intervention could have more successful long term outcomes. Future studies could use a more representative data set including patients with different times lapsed after stroke, various ages, and different types of aphasia. While sex had no significance in the aggregate according to the SHAPley values, when testing individual trials in decision making, it was shown to be the second greatest factor considered in predicting severe aphasia for an individual patient. This raises important questions about potential bias for gender, which the literature suggests does have a small but significant effect in prediction. Women are more likely than men to get post stroke aphasia, which aligns with the findings from this study.
The insights from this study will be beneficial for future translations in clinical settings, as we created an automatic diagnosis for aphasia severity with a successful prediction rate of over 76% that is more efficient than current methods. By using machine learning to accelerate the diagnosis process, it alleviates the burden on speech-language pathologists, patients, and families. This is a research model that has not been deployed to the clinic. However, it has a high translational potential because it requires information that is easily accessible. The random forest model can easily be deployed through a website or an app where a clinician or patient could securely input their information and receive the model’s predictions. However, clinical validation for how useful the predictions would be is a necessary step before deployment. Patient privacy will also be an important consideration. Integration with electronic health records could improve the workflow.
The use of explainability allows healthcare providers to understand individual profiles of patients to create personalized treatment and reduce uncertainty surrounding recovery. It can help healthcare professionals by providing them with insights to make informed and accurate decisions. By taking into account individual characteristics and demographic profiles, clinicians will be able to provide patients with personalized treatment programs that are likely to work. When rehabilitation and treatment are tailored to an individual’s severity level, it results in the most improvement in recovery for a patient. Additionally, it informs healthcare providers on what features the model is using so that they can trust it when making clinical judgments. Making distinctions between patient subgroups also gives clinicians an expectation on how patients will recover as younger people with smaller lesions are predicted to do better and recover more quickly while older people with larger lesions might need more support when receiving treatment.By researching aphasia patients with chronic stroke rather than acute, it advances the literature by moving towards understanding and alleviating an otherwise overlooked aspect of aphasia that has impaired individuals for a large portion of their life.
The limitations of this research include the constraint of a smaller dataset, especially in the context of machine learning, which limited the methods to using more basic models to prevent overfitting and lowered the performance of more complex models such as neural network. Neural network models are prone to overfitting, resulting in poor generalization of data16. In our case, this occured due to an extremely small dataset (N = 168), resulting in the neural network memorizing data17. In the future, with larger datasets, convolutional neural networks could be used to boost performance. This was secondary analysis on publicly available data which means we were constrained by the original dataset18 which was obtained from people participating in research and therefore was not representative of the average post stroke aphasia population but more so of people who were more likely to participate in research. Additionally, only lesion volume was used from neuroimaging, so future studies could incorporate the use of more images to widen the scope of factors for prediction, such as multimodal imaging which integrates multiple neuroimaging techniques, giving more accurate predictions and tailored treatment. This study also only accounted for a patient’s aphasia severity at one point in time, so further studies could test for aphasia severity at multiple points of patient recovery because recovery progress fluctuates over time, and predicting future aphasia would be helpful for patients. This research could also be developed to study the change from acute to chronic aphasia, so that it could predict the severity of a patient not just currently, but also at a future point in time. Additionally, it was not feasible to break the data up into multiple classes in this study due to the small sample size. However, this is not uncommon as other studies predicting severity have classified the data similarly into two classes19. However, future studies could predict levels of severity such as mild, moderate, and severe instead of only predicting severe vs non severe aphasia. This study ultimately provides the foundation for future work, showing the importance of significant features such as lesion volume which can be studied further.
This study highlights the potential of machine learning in expediting the diagnostic process of aphasia severity with efficiency and enabling personalized rehabilitation approaches. The use of explainable AI is a novel approach to revolutionizing aphasia prediction, as it doesn’t just take the model but it takes the insights to open up a new field of aphasia treatment. By integrating this study in clinical practices, it advances the future of precision medicine, enhancing patient outcomes with reliability and transparency, ultimately transforming the treatment and care for individuals with aphasia.
Methods
The study used explainable machine learning in a retrospective approach to predict aphasia severity based on demographic, clinical, and neural factors.
The data was obtained from a publicly available dataset, Aphasia Recovery Cohort, from OpenNeuro, pre-collected by original researchers, containing clinical, demographic, and neuroimaging information on patients with chronic post-stroke aphasia18. The dataset is fully anonymized, and all data collected was approved by the Institutional Review Board at the University of South Carolina, making it usable for public sharing. The study included 168 participants from the dataset, excluding participants with missing values and those with a WAB AQ, aphasia severity level, of over 90. The exclusion of WAB AQ > 90 is common in research and was done to remove patients who have such mild aphasia that they can be considered non-impaired20. After data pre-processing, patients were categorized into severe aphasia, with WAB AQ (severity level) less than 50 and non-severe aphasia, with WAB AQ greater than 50. This clinical threshold is an extremely common clinical practice and is supported by other studies who have chosen a WAB AQ of 50 to be the shift between severe and moderate aphasia21,6. Everything was coded in Python 3 using Google Collaboratory, and Python libraries pandas and sklearn were utilized. The code can be made available upon request.
The input feature variables of the data include sex, age at stroke, race, wab days, lesion volume, and wab types. These features were selected based on prior research on aphasia severity which have shown their importance. It has been consistently found in the literature that lesion related factors, age at stroke, and time post stroke are associated with language impairment severity22’23. Only lesion volume was considered from neuroimaging because it was the only available metric available in the dataset. Future data should include complex metrics of the imaging that will enable future analysis using connectivity, white matter tractography, and additional modalities including functional imaging. Lesion volume of each patient was extracted using FMRIB Software Library (FSL) and command line to calculate the lesion volume from MRI brain imaging data. While other demographic and health factors such as sex and race have shown more inconsistent results24, some studies have found that including these factors can lead to a better understanding of individual variations in aphasia severity beyond just lesion factors, therefore leading to more holistic treatment25. The features were used as inputs to predict the output variable of binarized wab aq, aphasia severity, and the highest performing model was used to analyze relationships between the features and aphasia severity.
Data preprocessing was completed to clean the dataset, making it usable for this study. The dataset includes 230 participants, and after dropping missing values, there were 195 participants. The participants that were excluded had empty columns for either race or WAB type, where the information for those inputs was not in the dataset. There are 8 features including participant id, sex, age at stroke, race, wab days, wab aq (severity), wab type, and rounded lesion volume. Categorical variables in this dataset were encoded using label encoding, which assigns each category a unique integer because the categorical variables were binary or were manageable as integers. This was done using LabelEncoder from the sklearn.preprocessing module. A binarized column was created for aphasia severity, where wab aq greater than 50 is 1, and WAB aq less than 50 is 0. 0 is severe, and 1 is not severe. Participants with wab aq greater than 90 were dropped (27 participants) which made the total participants 168. 70 participants had severe aphasia, and 98 participants did not have severe aphasia. A label encoder was used for input data, where female is 0 and male is 1, and for race, black is 0, and white is 1. Regarding WAB type, anomic is 0, broca is 1, conduction is 2, global is 3, transcortical is 4, and wernicke is 5. These encoded values were then used as numerical input features in the machine learning model.
The input feature variables of the data include sex, age at stroke, race, wab days, lesion volume, and wab types, and other columns of binarized wab aq, wab type, and participant id were dropped. The output was binarized wab aq, which is aphasia severity. A train test split was done with a test size of 0.2 and a random state of 5. Stratified sampling was also done, so there is the same ratio of two groups in training and testing, and the classes have equal weight. The X_train dimension was (134, 6), and the percentage was 80%. The X_test dimension was (34, 6), and the percentage was 20%. The y_train dimension was (134,0), and the y_test dimension was (34,).
Using the same train test split, 5 machine learning classification models were developed. Logistic regression, k-nearest neighbor, support vector classifier, random forest, and neural network models were developed and optimized, and parameters were tuned to get the highest accuracy.
Machine Learning Models

Logistic Regression Model
A logistic regression model is a statistical algorithm used to predict the probability of a binary outcome based on multiple input features. It fits a sigmoid function to the data and returns the output between 0 and 1 for prediction31.
K-Nearest Neighbor (KNN) Model
The k-nearest neighbor model is a non-parametric method that makes predictions based on the similarity of data points in a given dataset. It works by finding the k-nearest neighbors to a data point, and the output is determined by the majority class among the nearest neighbors32.
Support Vector Classifier (SVC) Model
A support vector classifier is a type of support vector machine model that finds the optimal hyperplane that separates data points belonging to different classes33.
Random Forest
The random forest model takes random subsets of the training data and creates multiple decision trees, and at each split in the tree, a random subset of the features is considered. The final prediction is the result of a majority vote across all trees34.
Neural Network
A neural network consists of an input layer, hidden layers, and an output layer. During forward propagation, data passes through these layers, with each neuron calculating a weighted sum of inputs, adding a bias, and applying an activation function. In backpropagation, the network calculates the error (loss) and adjusts the weights using gradients to minimize the loss. This process repeats iteratively, allowing the network to learn patterns and improve its predictions over time35.
Optimizing Models
The Logistic Regression model was optimized for the number of max iterations (range 10-85); KNN for number of neighbors (range 3-100, increment 2); Random Forest for max depth (range 1-50) and nearest neighbors (range 1-100); and Neural Network for hidden layer sizes using both a range from 50-500 (increment 20) and [(2,4,6,8),(3000,300,300),(16,32,64,128,256)].
Analyzing Model Performance
To analyze the results, the models were trained using tenfold cross-validation, where the dataset is split into ten parts, with nine parts used for training and one for testing in each iteration. This was done to ensure that evaluation metrics were not biased by a specific train-test split and that models generalize well to unseen data. After completing the cross-validation, the mean values of accuracy, precision, recall, F-1 score, and area under the receiving operating characteristic curve (AUC-ROC) were calculated and compared among each model to identify the highest performing model based on the numerous metrics. DeLong’s test was also performed to evaluate the statistical significance in model comparison.
In this study, accuracy, which refers to the fraction of correct predictions over total predictions, was used as a baseline metric to see which model generally is performing the best. However, given the slightly imbalanced nature of the dataset, precision, recall, and F-1 score were also compared for each model to ensure the suitability of each model’s performance.
Precision refers to the accuracy of positive predictions, and a higher precision indicates fewer false positives, meaning the model is less likely to incorrectly label a negative outcome as positive36. In the context of this study, positive refers to non-severe aphasia, and negative refers to severe aphasia. Evaluating precision is important in this study because it helps ensure that severe cases are not mistakenly identified as non-severe. Maximizing precision reduces the risk of false positives, which is critical for making sure that individuals with severe aphasia are not overlooked and receive the appropriate level of treatment.
![\[\text{Precision} = \frac{\text{True Positive}}{\text{True Positive} + \text{False Positive}}\]](https://nhsjs.com/wp-content/ql-cache/quicklatex.com-0fd30b74aa653fd89479546b969b1773_l3.png "Rendered by QuickLaTeX.com")
Recall refers to how well a model can predict true positive cases. A higher recall score indicates a model is more likely to predict all positive cases and has a lower false negative, meaning it is less likely to miss positive cases37. In this study, a higher recall score indicates that the model is likely to correctly predict non-severe aphasia, which is a less important metric to evaluate in this study as predicting the severe cases is more important.
![\[\text{Recall} = \frac{\text{True Positive}}{\text{True Positive} + \text{False Negative}}\]](https://nhsjs.com/wp-content/ql-cache/quicklatex.com-a6878cf4545b7308afebd9b78b17be3e_l3.png "Rendered by QuickLaTeX.com")
F-1 score combines precision and recall into a single value. It is calculated using a confusion matrix, and a higher f-1 score indicates a better balance between precision and recall. Weighted average weighs the precision, recall, and f-1 scores by the number of instances in each class38. F-1 score is useful to evaluate in this study because it takes false positives and false negatives into account rather than just the number of predictions, which gives a more reliable approach in assessing the model’s performance.
Area under the receiving operating characteristic curve (AUC-ROC) is another metric that represents the probability that the model will correctly distinguish between a randomly chosen positive and negative case. This is valuable in medical classification tasks because it evaluates the model’s performance across all classification thresholds, rather than at a single decision point.
A confusion matrix is also another tool used to evaluate the performance of a model, as it compares the predictions to the actual results, helping understand where the model is making a mistake39.
True negative: the model correctly predicts a negative outcome
True positive: the model correctly predicts a positive outcome
False negative: the model incorrectly predicts the outcome as false (actually true)
False positive: the model incorrectly predicts the outcome as true (actually false)
Explainable AI
To interpret the results of the best model, explainable AI was used through SHAP to visually display the contributions of various factors in aphasia severity prediction. SHAP is a framework used for interpreting models by assigning importance values to each input feature based on Shapley values from cooperative game theory40. The results of this study were analyzed using SHAP to see how well aphasia severity can be predicted and what is the most predictive of aphasia.
Link to coding notebook: SanviC_AphasiaProjectNotebookLesions.ipynb
References
- S. Kristinsson, W. Zhang, C. Rorden, R. Newman‐Norlund, A. Basilakos, L. Bonilha, G., Yourganov, F. Xiao, A. Hillis, J. Fridriksson. Machine learning‐based multimodal prediction of language outcomes in chronic aphasia. Human Brain Mapping. 42, 1682–1698 (2020). [↩] [↩] [↩]
- K. Apostolidis, C. Kokkotis, S. Moustakidis, E. Karakasis, P. Sakellari, C. Koutra, D. Tsiptsios, S. Karatzetzou, K. Vadikolias, N. Aggelousis. Machine Learning Algorithms for the Prediction of Language and Cognition Rehabilitation Outcomes of Post-stroke Patients: A Scoping Review. Human-Centric Intelligent Systems. 4, 147–160 (2023). [↩]
- S. Spaccavento, A. Craca, M. D. Prete, R. Falcone, A. Colucci, A. D. Palma, A. Loverre. Quality of life measurement and outcome in aphasia. Neuropsychiatric Disease and Treatment. 10, 27–37 (2013). [↩]
- V. Barfod. Western aphasia battery (WAB). https://strokengine.ca/en/assessments/western-
aphasia-battery-wab/ [↩] - N. Riccardi, S. Nelakuditi, D. B. den Ouden, C. Rorden, J. Fridriksson, R. H. Desai. Discourse- and lesion-based aphasia quotient estimation using machine learning. NeuroImage: Clinical. 42, 103602 (2024). [↩]
- S. Kristinsson, A. Basilakos, D. B. den Ouden, C. Cassarly, L. A. Spell, L. Bonilha, C. Rorden, A. E. Hillis, G. Hickok, L. Johnson, N. Busby, G. M. Walker, A. McLain, J. Fridriksson. Predicting Outcomes of Language Rehabilitation: Prognostic Factors for Immediate and Long-Term Outcomes After Aphasia Therapy. Journal of Speech, Language, and Hearing Research. 66, 1068–1084 (2023). [↩] [↩] [↩]
- Y. Gu, M. Bahrani, A. Billot, S. Lai, E. J. Braun, M. Varkanitsa, J. Bighetto, B. Rapp, T. B. Parrish, D. Caplan, C. K. Thompson, S. Kiran, M. Betke. A machine learning approach for predicting post-stroke aphasia recovery: A pilot study. 13th ACM International Conference on PErvasive Technologies Related to Assistive Environments, PETRA 2020 – Conference Proceedings. 161–169. (2020). [↩]
- A. Osa García, S. M. Brambati, A. Brisebois, M. Désilets-Barnabé, B. Houzé, C. Bedetti, E. Rochon, C. Leonard, A. Desautels, K. Marcotte. Predicting Early Post-stroke Aphasia Outcome From Initial Aphasia Severity. Frontiers in Neurology. 11 (2020). [↩]
- S. Jeong, E-J. Lee, Y-H. Kim, J.C. Woo, O-W. Ryu, M. Kwon, S. U. Kwon, J. S. Kim, D-W. Kang Deep Learning Approach Using Diffusion-Weighted Imaging to Estimate the Severity of Aphasia in Stroke Patients. Journal of Stroke. 24, 108–117 (2022). [↩]
- A. E. Hillis, Y. Y. Beh, R. Sebastian, B. Breining, D. C. Tippett, A. Wright, S. Saxena, C. Rorden, L. Bonilha, A. Basilakos, G. Yourganov, J. Fridriksson. Predicting recovery in acute poststroke aphasia. Annals of Neurology. 83, 612–622 (2018). [↩]
- StrokeAssociation. Types of Aphasia. https://www.stroke.org.uk/stroke/effects/aphasia/Types-of-aphasia [↩]
- M. Day, R. K. Dey, M. Baucum, E. J. Paek, H. Park, A. Khojandi. Predicting Severity in People with Aphasia: A Natural Language Processing and Machine Learning Approach. 2021 43rd Annual International Conference of the IEEE Engineering in Medicine & Biology Society (EMBC). 2299–2302 (2021). [↩]
- J-K. Lee, M-H. Ko, S-H. Park, G-W. Kim. Prediction of Aphasia Severity in Patients with Stroke Using Diffusion Tensor Imaging. Brain Sciences. 11, 304 (2021). [↩]
- M. Thye, D. Mirman. Relative contributions of lesion location and lesion size to predictions of varied language deficits in post-stroke aphasia. NeuroImage : Clinical. 20, 1129–1138 (2018). [↩]
- R. M Lazar, D. Antoniello. Variability in Recovery from Aphasia. Current Neurology and Neuroscience Reports. 6, 497–502 (2008). [↩]
- S. Lawrence, C. L. Giles, A. C. Tsoi. Lessons in Neural Network Training: Overfitting May be Harder than Expected. Proceedings of the National Conference on Artificial Intelligence. 540-545 (1997). [↩]
- S. Vignesh. The Perfect Fit for a DNN. https://medium.com/analytics-vidhya/the-perfect-fit-for-a-dnn-596954c9ea39 (2020). [↩]
- M. Gibson, R. Newman-Norlund, L. Bonilha, J. Fridriksson, G. Hickok, A. E. Hillis, D-B. den Ouden, C. Rorden. Aphasia Recovery Cohort (ARC) Dataset. OpenNeuro (2023). [↩] [↩]
- J-K. Lee, M-H. Ko, S-H. Park, G-W. Kim. Prediction of Aphasia Severity in Patients with Stroke Using Diffusion Tensor Imaging. Brain Sciences. 11, 304 (2021). [↩]
- A. A. John, M. Javali, R. Mahale, A. Mehta, P. T. Acharya, R. Srinivasa. Clinical Impression and Western Aphasia Battery Classification of Aphasia in Acute Ischemic Stroke: Is There a Discrepancy? Journal of Neurosciences in Rural Practice. 8, 74–78 (2017). [↩]
- J-K. Lee, M-H. Ko, S-H. Park, G-W. Kim. Prediction of Aphasia Severity in Patients with Stroke Using Diffusion Tensor Imaging. Brain Sciences. 11, 304 (2021) [↩]
- J-F. Landrigan, F. Zhang, D. Mirman. A data-driven approach to post-stroke aphasia classification and lesion-based prediction. Brain. 144, 1372–1383 (2021). [↩]
- M. Thye, D. Mirman. Relative contributions of lesion location and lesion size to predictions of varied language deficits in post-stroke aphasia. NeuroImage : Clinical. 20, 1129–1138 (2018). [↩]
- K. Lice, M. V. Ogrizek, K. Škarić. The association between aphasia severity, naming, verbal fluency and demographic variables in nonfluent post-stroke aphasia. Logopedija. 14, 102-113 (2024). [↩]
- L. Johnson, S. Nemati, L. Bonilha, C. Rorden, N. Busby, A. Basilakos, R. N. Norlund, A. E. Hillis, G. Hickok, J. Fridriksson. Predictors beyond the Lesion: Health and Demographic Factors Associated with Aphasia Severity. Cortex; a journal devoted to the study of the nervous system and behavior. 154, 375–89 (2022). [↩]
- Medium. Logistic Regression Made Simple. https://amalaj7.medium.com/logistic-regression-
eb2903251107 (2021). [↩] - GeeksforGeeks. K-Nearest Neighbor(KNN) Algorithm. https://www.geeksforgeeks.org/k-nearest-neighbours/ [↩]
- L. Eliot. Leveraging AI Support Vector Machines (SVM) For Autonomous Cars. https://
lance-eliot.medium.com/leveraging-ai-support-vector-machines-svm-for-autonomous-cars-f76483bbfa6e (2019). [↩] - D. Wei. Demystifying Machine Learning Models: Random Forest. https://medium.com/@weidagang/demystifying-machine-learning-models-random-
rorest-f992dc50b427 (2024). [↩] - IBM. What is a Neural Network? https://www.ibm.com/think/topics/neural-networks (2021). [↩]
- GeeksforGeeks. Logistic Regression in Machine Learning. https://www.geeksforgeeks.org/understanding-logistic-regression/. [↩]
- GeeksforGeeks. K-Nearest Neighbor(KNN) Algorithm. https://www.geeksforgeeks.org/k-
nearest-neighbours/ [↩] - GeeksforGeeks. Support Vector Machine (SVM) Algorithm. https://www.geeksforgeeks.org/support-vector-machine
-algorithm/ [↩] - GeeksforGeeks. Random Forest Algorithm in Machine Learning. https://www.geeksforgeeks.org/random-forest-algorithm-in-
machine-learning/ [↩] - GeeksforGeeks. What is a Neural Network? https://www.geeksforgeeks.org/neural-networks-a-beginners-guide/ [↩]
- Google for Developers. Classification: Accuracy, recall, precision, and related metrics. https://developers.google.com/machine-learning/crash-course/classification/accuracy-precision-recall [↩]
- GeeksforGeeks. Precision, Recall and F1-Score using R. https://www.geeksforgeeks.org/precision-recall-and-f1-score-using-r/ [↩]
- Google for Developers. Classification: Accuracy, recall, precision, and related metrics. https://developers.google.com/machine-learning/crash-course/classification/accuracy-precision-recall [↩]
- GeeksforGeeks. Understanding the Confusion Matrix in Machine Learning. https://www.geeksforgeeks.org/confusion-matrix-machine-learning/ [↩]
- GeeksforGeeks. A Comprehensive Guide to Shapley Additive exPlanations. https://www.geeksforgeeks.org/shap-a-comprehensive-guide-to-shapley-additive-explanations/ [↩]


