
Abstract
Water rockets provide an accessible platform to study fundamental principles of physics, including Newton’s laws, momentum conservation, and projectile motion. While prior studies suggest that water mass and launch angle influence flight performance, the quantitative relationship between propellant mass and horizontal range under controlled pressure remains underexplored. This study investigates how water mass and launch angle affect the range of a 1-liter bottle water rocket and identifies the optimal fill level for maximum distance. A custom-built launcher and 1-liter plastic bottle rocket were used to conduct experiments at three launch angles (45°, 60°, 75°). Water mass was varied between Each configuration was tested in multiple trials, with horizontal distances measured and averaged. Uncertainties were calculated to account for experimental error. Data were analyzed using projectile kinematics and momentum balance models to predict the dependence of range on propellant mass. A clear quadratic relationship between water mass and horizontal range was observed. Maximum ranges occurred at intermediate water masses of 400–440 g, with measured distances of approximately 26.15 m (45°), 23.25 m (60°), and 15.4 m (75°) , closely matching predicted peaks. Distances decreased when water mass exceeded the optimum, reflecting the tradeoff between thrust duration and added weight. Range increased with launch angle across the tested set. The study confirms that bottle rocket performance is optimized at intermediate water fill levels and higher launch angles. These findings reinforce theoretical predictions, inform small-scale rocket design, and provide an accessible model for understanding aerospace principles. Limitations include wind ( traveling at 9km/h), launcher alignment, only one kind of rocket design used and a limited trial set.
Keywords: Water rocket, propellant mass, launch angle, horizontal range, projectile motion, experimental physics
Introduction
Rocketry is a central field within aerospace engineering, combining physics, engineering, and applied mathematics to study how rockets generate thrust and overcome atmospheric forces. Although modern spaceflight is highly complex, the fundamental principles of rocketry can be observed using simple experimental models such as water rockets. Water rockets offer a safe and accessible way to investigate how thrust, mass, and aerodynamics influence flight.
Understanding the performance of water rockets requires consideration of Newton’s laws of motion, conservation of momentum, and projectile motion. In particular, the amount of water used as propellant plays a critical role: while greater water mass increases propulsion time, it also increases weight, which can reduce launch velocity. Balancing these effects determines the rocket’s range.
This study investigates the impact of water mass on the horizontal distance travelled by a water rocket and how the horizontal distance depends on the angle of launch. By varying the water mass across trials at different launch angles and analyzing the resulting distances, the experiment aims to identify the relationship between propellant mass and flight performance and the launch angle with the horizontal range travelled.
My paper also aims to show the significance of understanding rocket operations. Rocketry is a very crucial part of our history, and it is vital in understanding how our solar system works1,2. The universe holds so many unanswered questions and secrets that I am determined to be a small part of this long search.
In this study, I have incorporated physics laws and information from other similar studies, which are properly cited. Due to the availability of resources and time, I was able to construct only one functioning rocket and discuss about three launch angles.
Principle of operations of a water rocket
A simple water rocket has a relatively small opening at one end of its chamber, which allows gas to escape and generates thrust in the opposite direction. This basic operation combines fundamental principles of physics, laws and engineering. More specifically, the second and third laws of Newton3,4 are applied. As water is pushed outward due to the excess amount of air pressure inside the rocket, according to Newton’s third law, an opposite force is exerted on the water rocket. Then, if the vertical component of this force exceeds the weight of the rocket, it will lift off and begin to accelerate in the direction of the net force according to Newton’s second law. If the inner pressure has a greater value than the atmospheric pressure and at the same time there is water remaining inside the rocket, it will continue to accelerate. When either the water runs out or the air pressure drops, then the rocket will begin to move under the influence of its weight, accelerating downwards5. Different combinations of air pressure and water mass inside the rocket will provide different amounts of thrust, affecting its range.
To further analyze the case of a water rocket, when mass is ejected from the rocket, a forward opposed force is applied to the rocket itself. By applying the principle of conservation of momentum, the propulsion force ΣF can be derived. This force is equal to the rate of ejection of mass multiplied by the relative ejection speed of the mass to the rocket. This derivation can be done by considering the conservation of mass of the rocket and the mass of the ejected gases as a function of the conservation of momentum.
![\[M\cdot v = M - dm \cdot (v + dv) - dm \cdot u - v - dv\]](https://nhsjs.com/wp-content/ql-cache/quicklatex.com-953dd49cbaf6a8b24398e3699689c408_l3.png "Rendered by QuickLaTeX.com")
![\[M\cdot v = M\cdot v + M\cdot dv - dm\cdot v - dm\cdot dv - dm\cdot u + dm\cdot v - dm\cdot dv\]](https://nhsjs.com/wp-content/ql-cache/quicklatex.com-3637ea17088723f72c2d4ed2b347b7f1_l3.png "Rendered by QuickLaTeX.com")
![\[0 = M\cdot dv - dm\cdot u \rightarrow M\cdot dv = dm\cdot u\]](https://nhsjs.com/wp-content/ql-cache/quicklatex.com-c49e682bfda0411b4ce4596e6be01f8e_l3.png "Rendered by QuickLaTeX.com")
![\[M\cdot \frac{dv}{dt} = \frac{dm}{dt} \cdot u \rightarrow M\cdot a = \frac{dm}{dt} \cdot u \rightarrow \Sigma F = \frac{dm}{dt} \cdot u \, (\text{eq 1})\]](https://nhsjs.com/wp-content/ql-cache/quicklatex.com-d5dcdc84e0658b2ca46c4def109a2a8c_l3.png "Rendered by QuickLaTeX.com")
Hence, using the force calculated in the previous step, the Impulse delivered during
propulsion time is:
![\[I = \Sigma F \cdot t \, (\text{eq 2})\]](https://nhsjs.com/wp-content/ql-cache/quicklatex.com-ca6ac02d2f2fc91ed1529e8efbb98590_l3.png "Rendered by QuickLaTeX.com")
If I denote as  the function of the mass of the water rocket (changing with time), then combining the two equations, the launch speed
  is:
is:
![\[I = \frac{dm}{dt} \cdot u \cdot t \rightarrow m(t)\cdot v - m(t)\cdot v_0 = \frac{dm}{dt} \cdot u \cdot t \rightarrow v = \frac{\frac{dm}{dt}\cdot u \cdot t}{m(t)} \, \text{eq 3}\]](https://nhsjs.com/wp-content/ql-cache/quicklatex.com-f8141c31cb53bb473914c30bb0ff12b4_l3.png "Rendered by QuickLaTeX.com")
The latter equation reveals that if the mass ejection rate  and the velocity
  of the expelled water are constant, then the final velocity of the rocket is inversely proportional to the total mass of the rocket. Thus, adding more water increases the thrust delivered, but the increased mass simultaneously harms the launch.
The range of the water rocket system can be predicted by the kinematic equations of a projectile motion at a launch angle 𝜃 to the ground, neglecting air resistance. Specifically, the net vertical displacement of the rocket, from launch to landing, is 0.
![\[\Delta y = 0 \rightarrow v_y \cdot t - \frac{1}{2} \cdot g \cdot t^{2} = 0 \rightarrow t = \frac{2 v_y}{g} \, (eq\,4)\]](https://nhsjs.com/wp-content/ql-cache/quicklatex.com-dc7350b42866a1bbbf47a70c77751136_l3.png "Rendered by QuickLaTeX.com")
![\[\Delta y = 0 \rightarrow v_y \, t - \frac{1}{2} g \, t^{2} = 0 \rightarrow t = \frac{2 v_y}{g} \; (\text{eq 4})\]](https://nhsjs.com/wp-content/ql-cache/quicklatex.com-b442c2fc8f1ba4ea7805c86b09be01f7_l3.png "Rendered by QuickLaTeX.com")
Thus, in the x-axis, the range could be calculated from the equation below,
![\[x = v_x \, t \rightarrow x = v_x \cdot \frac{2 v_y}{g} \rightarrow v \cos\theta \cdot \frac{2 v \sin\theta}{g} \rightarrow x = \frac{2 v^{2} \cos\theta \sin\theta}{g} \rightarrow\]](https://nhsjs.com/wp-content/ql-cache/quicklatex.com-4d2a75f3b2df13712d6ef2e54cc25440_l3.png "Rendered by QuickLaTeX.com")
![\[x = \frac{\sin 2\theta \cdot v^{2}}{g} \rightarrow x = \frac{\sin 2\theta}{g} \cdot \left( \frac{\dfrac{dm}{dt} \cdot u \cdot t}{m(t)} \right)^{2} \; (eq.5)\]](https://nhsjs.com/wp-content/ql-cache/quicklatex.com-3dd8ef4d066227d3eaf9e68cb0650830_l3.png "Rendered by QuickLaTeX.com")
This equation suggests a quadratic relationship between the range travelled and the mass inside a water rocket. This hypothesis is not only supported by the above equation; however, Studies by Pathan6
and Acciani7 also hypothesized a quadratic relationship between launch mass and rocket range under similar experimental conditions.
Methods
This is an experimental research paper, containing field work and the actual construction of a water rocket.
Tools needed
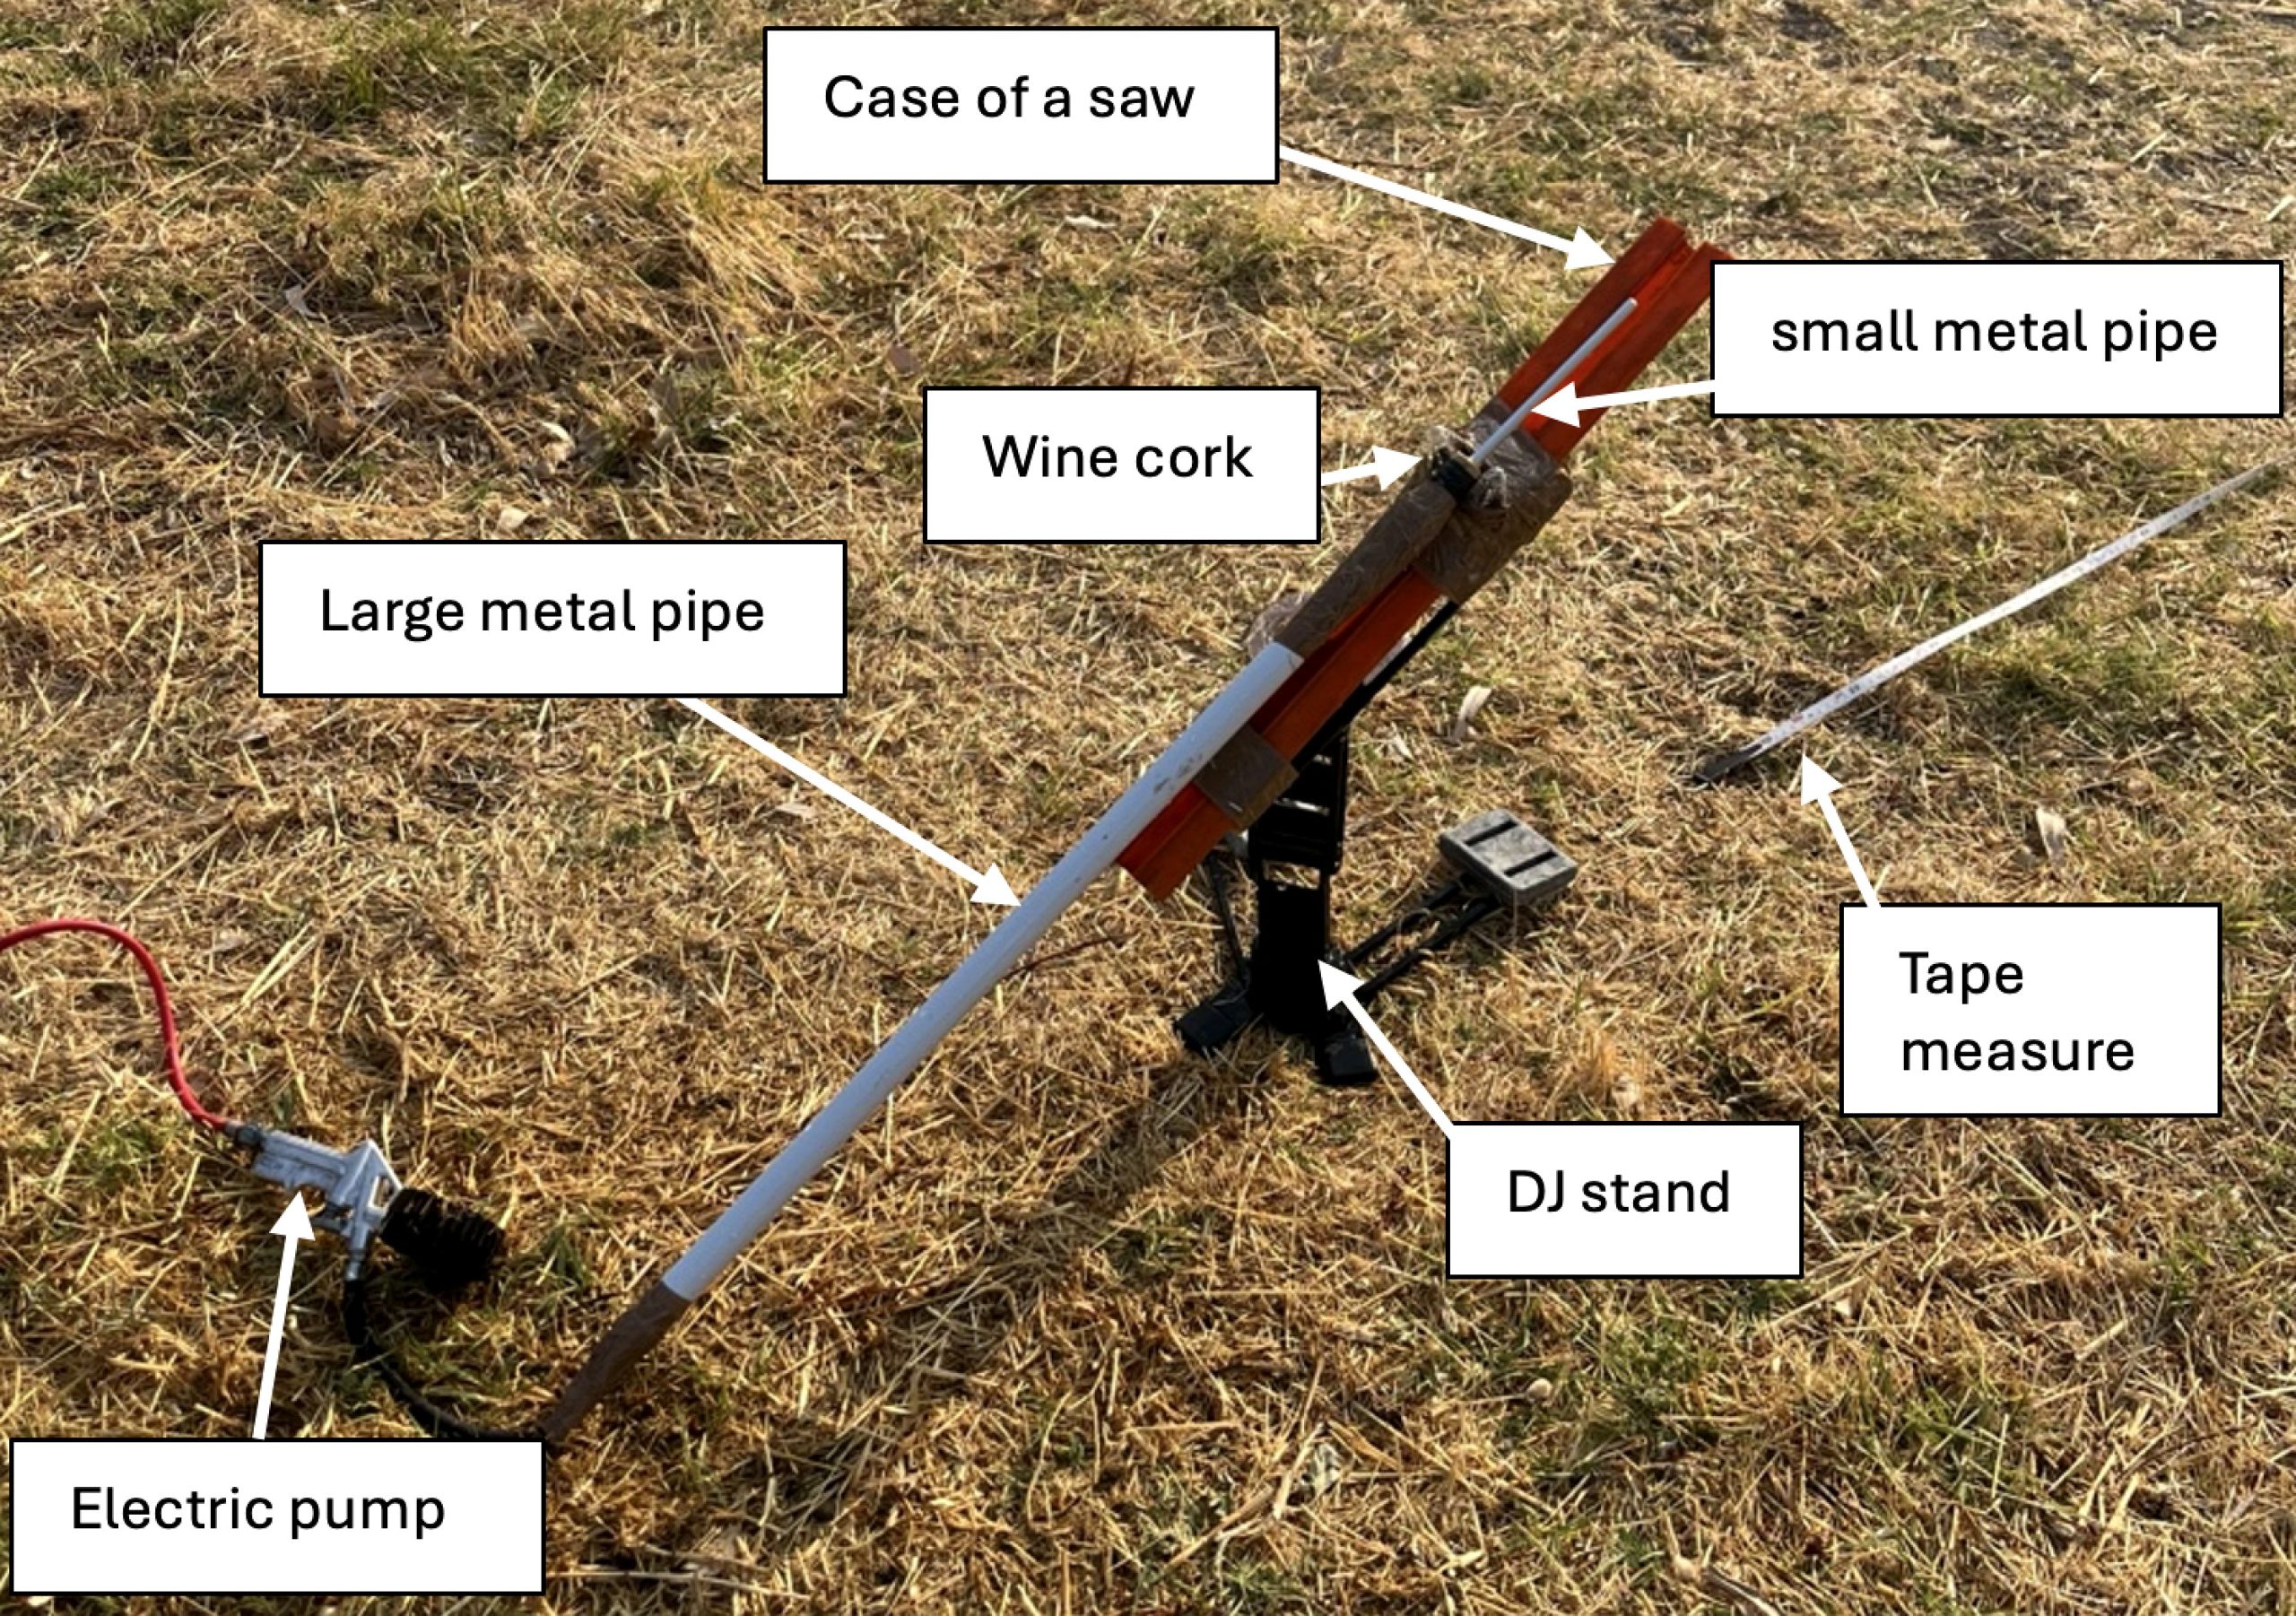
Table 1 shows all the materials and tools I used to build the launcher and the rocket.
| DJ set |
| Case of a saw tool |
| Plastic egg case |
| Metal pipe with a big opening |
| Metal pipe with small opening |
| Wine cork |
| Air pump |
| Duct tape |
| Measuring tape |
| Protractor |
| Water bottle 1L |
| Plastic for fins |
| Tennis ball |
| Measuring tape |
| Weighing scale |
| Tap water |
| Electric pump |
Construction of the launcher
The launcher was constructed in two main parts. For the first part of the launcher, a DJ stand available on-site was used as the base, allowing adjustment of both the launch angle and height. The casing of a saw tool, which was elongated, was attached to serve as the takeoff ramp. This component was secured using duct tape. Additionally, a small piece was cut from a plastic egg carton and positioned to act as a stopper, preventing the rocket from sliding downwards while the launcher was inclined as seen in picture 1.
For the second part of the launcher, we used an electric pump to generate the air pressure inside the rocket. We connected a white metal pipe with two large openings at its ends to the pump so that the air could flow into the rocket. At the opposite end of the pipe, we used a wine bottle cork to seal the rocket, trapping both the air and water while also connecting the rocket to the pipe. Finally, we drilled a hole with diameter and tightly inserted a smaller pipe with a very narrow opening through the cork and into the rocket. This smaller pipe allowed air to enter the rocket while preventing water from escaping.
Construction of the water rocket
A plastic bottle was used as the main body of the water rocket. Three plastic fins were attached to the sides of the bottle with duct tape to provide stability during flight. A tennis ball was secured to the top of the bottle to serve as a nose cone, improving stability and reducing air resistance. Duct tape was also applied to reinforce weak points in the rocket’s structure. The rocket was pressurized with water and air using a pump in order to generate thrust for launch.

Experimental procedure
The experimental procedure was carried out according to the following steps:
- We measured specific masses of water, ranging from , determining their mass using a weighing scale with a known uncertainty of .
- The water was poured into the empty plastic bottle.
- Then the cork was tightly lodged into the opening of the water rocket until a specific mark at the middle of the length of the cork, to prevent air or water from escaping.
- We used a pressure pump to inject air into the bottle until the pressure of about (forced the rocket to launch.
- After each launch, we measured the horizontal distance travelled, using a measuring tape.
- We repeated the experiment at different launch angles, using a protractor to set and record each angle of launch paying special attention inserting the cork to the specific marked point at every trial.
- All data, including distance travelled (m), air pressure (bar), water mass (g), and angle (degrees), was recorded in an Excel spreadsheet for analysis.
The above methodology and construction of both the rocket and the launcher were used to ensure efficiency and safety in the experiment. More specifically, I set the rocket to travel in the x-axis and not in the y-axis as I couldn’t find an altimeter that satisfied the needs of the experiment. Therefore, to have reliable data I measured the range which was feasible with the resources I had available. In addition, by measuring only the range travelled, the experiment involved minimal risk, as the rocket was launched away from me, ensuring no possible harmful outcome. The rocket design was similar to other studies that conducted experiments with water rockets and was obviously a very small and simple representation of a regular rocket as in general most space rockets have a few fins (mostly 3) and a nose cone to minimize air resistance.
Prior to initiating the measuring process I did some trials to determine the pressure at which the cork would pop out from the rocket as measured by the gauge meter depicted in picture 3. This instrument measures the amount of pressure beyond the atmospheric pressure, that is why it is reffered as gauge pressure. Moreover, I wanted to verify that the cork would burst out at roughly the same pressure which was measured to be The uncertainty of the launch pressure exceeds the reading uncertainty of the gauge meter intending to consider the fact that the launch was triggered at approximately without the use of a more specific launch mechanism sucha as a pressure valve.

Figure 3. Gauge meter used
Variables
As shown in Table 2, these were the variables that were considered before and after the experiment and the analysis of the data.
| Variables | Ways of measuring/controlling them |
|---|---|
| Controlled: Same initial height. | We measured the initial height of each launch using a tape measure. We also made sure to never adjust it and keep it at the same value (0.55m). |
| Controlled: Same rocket shape. | The rocket was the same (same water bottle 1L) throughout the experiment to make sure each measurement had the same aerodynamics and that the range was not affected by different shapes. |
| Controlled: Same diameter of bottle opening. | By using the same rocket, we also ensured that the exit velocity of the water due to the applied air pressure would vary, thus the same forces were applied to the rocket throughout the experiment. |
| Controlled: Same launch pressure. | Throughout the experiment the same electric pump was used. Thus, all the measurements had the same uncertainty in the pressure applied. Moreover, we were able to apply the same pressure to all the launches. If the pressure varied, then the range of the rocket would also be affected. |
| Controlled: Same source of water. | We used the same source of water for each launch (tap water). This allowed each launch to have water of the same density which allows for more uniform results. A difference in density of water could result in different volumes and thus affect results. |
| Controlled: Wind Speed. | We made sure to take measurements on the same evening. That in turn allowed me to minimize the effect of the wind present in the rocket. National website suggested that the wind speed in the air was travelling at a speed of 3km/h with approximately Beaufort 1. |
| Controlled: No friction between rocket and launcher. | By measuring tape (each of 1m), it was placed right next to the place of launch of the rocket. Therefore, it allowed the exact range launched by the rocket. Otherwise, values would be misread, thus wrong results. |
| Independent: Launch angle θ. | We changed the launch angle of the rocket to see how it affected the range launched. The values were 15°, 30°, 45°, 60°, 75°. The measured angle using a protractor of uncertainty ±2.0(5). |
| Independent: Mass of rocket (m). | We measured the initial mass of the rocket which was 130g (when the additional plastic of the fins and nose cone was inside the rocket). The weight of the rocket was measured using a weighing scale of uncertainty ±1g. The masses of water that were added to the rocket were 100g, 200g, 300g, 400g, 500g. |
Results
Raw data
The tables 3,4,5 show the raw data collected during the launches for angles of 45,60,75 degrees respectively.
| Angle ° ±0.5 | Mass of water m/g ±1 | Air pressure P/bar ±0.2 | Distance travelled 1st/m ±0.1 | Distance travelled 2nd/m ±0.1 |
|---|---|---|---|---|
| 45 | 101 | 3.2 | 17.8 | 17.5 |
| 45 | 203 | 3.2 | 18.3 | 18.1 |
| 45 | 302 | 3.2 | 22.3 | 22.1 |
| 45 | 404 | 3.2 | 23.4 | 23.1 |
| 45 | 501 | 3.2 | 21.8 | 21.5 |
Table 3: Raw data for launch at an angle of 45 degrees
| Angle ° ±0.5 | Mass of water m/g ±1 | Air pressure P/bar ±0.2 | Distance travelled 1st/m ±0.1 | Distance travelled 2nd/m ±0.1 |
|---|---|---|---|---|
| 60 | 101 | 3.2 | 18.9 | 18.3 |
| 60 | 203 | 3.2 | 17.9 | 17.5 |
| 60 | 301 | 3.2 | 21.3 | 21.1 |
| 60 | 404 | 3.2 | 21.4 | 21.2 |
| 60 | 506 | 3.2 | 21.7 | 21.6 |
Table 4: Raw data for launch at an angle of 60 degrees
| Angle ° ±0.5 | Mass of water m/g ±1 | Air pressure P/bar ±0.2 | Distance travelled 1st/m ±0.1 | Distance travelled 2nd/m ±0.1 |
|---|---|---|---|---|
| 75 | 102 | 3.2 | 12.3 | 12.1 |
| 75 | 204 | 3.2 | 12.5 | 12.3 |
| 75 | 305 | 3.2 | 14.3 | 14.1 |
| 75 | 402 | 3.2 | 13.7 | 13.4 |
| 75 | 506 | 3.2 | 14.0 | 13.7 |
Table 5: Raw data for launch at an angle of 75 degrees
Processed data
For the processed data I will calculate the average distance as well as the uncertainty,
For the processed data I will calculate the average distance as well as the uncertainty,
![\[d_{\text{avg}} = \frac{d_1 + d_2}{2}\]](https://nhsjs.com/wp-content/ql-cache/quicklatex.com-ad64dd2267a554f09aee59fbe91161b7_l3.png "Rendered by QuickLaTeX.com")
![\[d_{\text{avg}} = \frac{12.8 + 13.5}{2}\]](https://nhsjs.com/wp-content/ql-cache/quicklatex.com-163a4a9c415b6b534f20f34e60ebc905_l3.png "Rendered by QuickLaTeX.com")
![\[d_{\text{avg}} = 13.2 \text{ m}\]](https://nhsjs.com/wp-content/ql-cache/quicklatex.com-20a43732f5f98e0ac0968f8544f2e556_l3.png "Rendered by QuickLaTeX.com")
To calculate the uncertainty of the distance,
![\[\Delta d_{\text{avg}} = \frac{d_{\max} - d_{\min}}{2}\]](https://nhsjs.com/wp-content/ql-cache/quicklatex.com-6a49ee27841ee00deb11877de4b370e0_l3.png "Rendered by QuickLaTeX.com")
![\[\Delta d_{\text{avg}} = \frac{13.5 - 12.8}{2}\]](https://nhsjs.com/wp-content/ql-cache/quicklatex.com-13ae9d90d1da5bc709958374d274c67d_l3.png "Rendered by QuickLaTeX.com")
![\[\Delta d_{\text{avg}} = \pm 0.4 \text{ m}\]](https://nhsjs.com/wp-content/ql-cache/quicklatex.com-fbeea10124f3145b9e76d45c764366fb_l3.png "Rendered by QuickLaTeX.com")
![\[d_{\text{avg}} = 13.2 \pm 0.4 \text{ m}\]](https://nhsjs.com/wp-content/ql-cache/quicklatex.com-0a49fba322954a353bb6996e37998e5c_l3.png "Rendered by QuickLaTeX.com")
Similarly, for the mass of water inside the rocket,
![\[m_{\text{avg}} = \frac{m_1 + m_2}{2}\]](https://nhsjs.com/wp-content/ql-cache/quicklatex.com-d77abeb57d26392cce088fc5f69ba610_l3.png "Rendered by QuickLaTeX.com")
![\[m_{\text{avg}} = \frac{101 + 100}{2}\]](https://nhsjs.com/wp-content/ql-cache/quicklatex.com-61911c80f6b560747aea453eedc9a3d8_l3.png "Rendered by QuickLaTeX.com")
![\[m_{\text{avg}} = 100.5 \text{ g}\]](https://nhsjs.com/wp-content/ql-cache/quicklatex.com-2264870099fe257a5e5d961cc862e6f1_l3.png "Rendered by QuickLaTeX.com")
![\[\Delta m_{\text{avg}} = \frac{m_{\max} - m_{\min}}{2}\]](https://nhsjs.com/wp-content/ql-cache/quicklatex.com-1cfd9960056bc8437ef9a050a2ff78fb_l3.png "Rendered by QuickLaTeX.com")
![\[\Delta m_{\text{avg}} = \frac{101 - 100}{2}\]](https://nhsjs.com/wp-content/ql-cache/quicklatex.com-97310e3aa9153d841811ee651016bb86_l3.png "Rendered by QuickLaTeX.com")
![\[\Delta m_{\text{avg}} = \pm 0.5 \text{ g}\]](https://nhsjs.com/wp-content/ql-cache/quicklatex.com-67ab225fece3b8c229e6ed00c96cc93c_l3.png "Rendered by QuickLaTeX.com")
![\[m_{\text{avg}} = 100.5 \pm 0.5 \text{ g}\]](https://nhsjs.com/wp-content/ql-cache/quicklatex.com-b512fc11f050e341b30a993065b8ad04_l3.png "Rendered by QuickLaTeX.com")
Table 6 presents the analyzed data for an angle of 45 degrees.
| Angle °/±0.5° | Average mass of water m/g | mavg/g | Air pressurebar/±0.2 bar | Distance travelled davg/ m | davg/m |
| 45 | 100.5 | 0.5 | 3.2 | 13.2 | 0.4 |
| 45 | 202.5 | 0.5 | 3.2 | 18.1 | 0.3 |
| 45 | 301.5 | 2.5 | 3.2 | 23.7 | 0.4 |
| 45 | 401.0 | 1.0 | 3.2 | 26.2 | 0.3 |
| 45 | 503 | 2 | 3.2 | 24.3 | 0.2 |
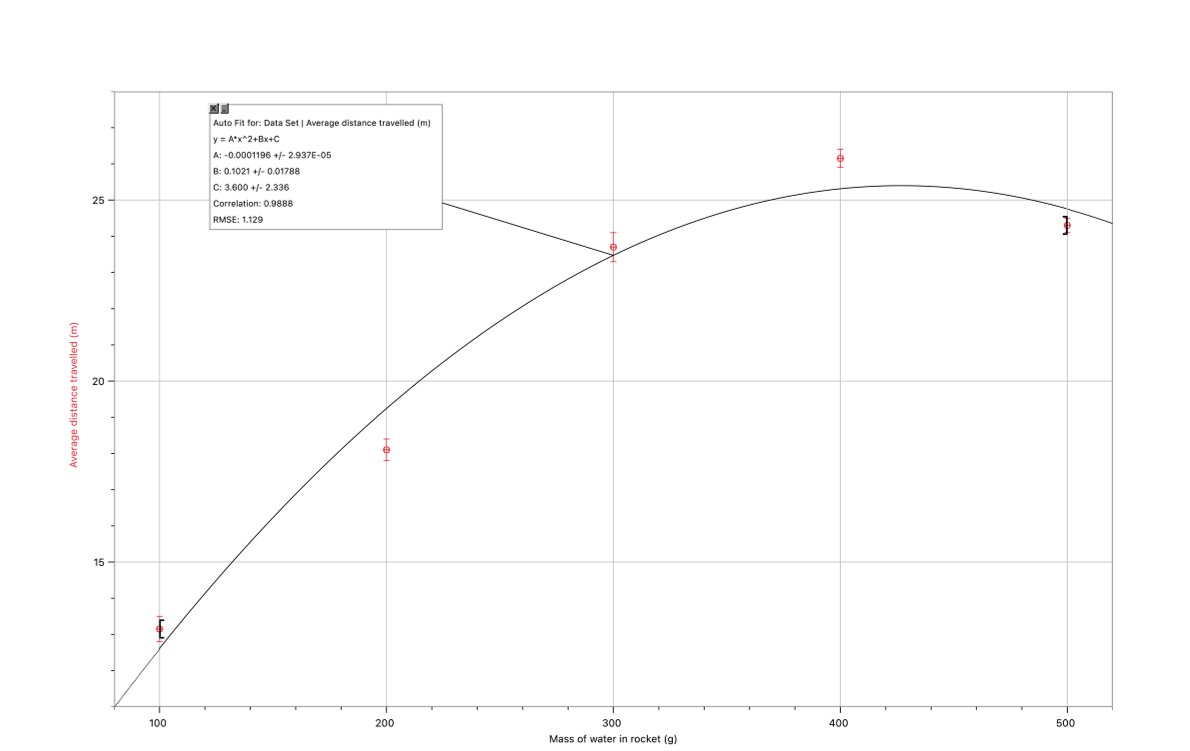
Graph 1: Average distance (m) vs water mass (g) for 45 degrees
For the first series of launches, at 45 degrees, the curve fit had the highest correlation coefficient of 0.9888. This indicates the presence of small errors during the experiment. For example, air resistance played a partial role towards the errors as on the day of launch the wind speed was measured at at 9km/h an opposite direction to the launches (based on meteo.gr), which of course could not have been steady throughout the measuring process as there were slight changes to the wind speed. Moreover, during the launch the rocket could have taken a slightly different trajectory during each different measurement which also affects the distance travelled. Lastly, the mass of the water inside the rocket wasn’t always exactly the same during both launches (i.e. for the 100g the first time 101g it was and the second 100g), this also affected the data points slightly. The error bars that appear in graph 1 express the half-range method of measured quantities.
In addition, a very useful statistical parameter is R². This tells you the proportion of the variance in the dependent variable that is explained by the independent variable(s) in a regression model. It measures the goodness of fit of the model to the observed data, indicating how well the model’s predictions match the actual data points8. Satisfactory values of R² depend on the context of both the subject and the experiment conducted, thus in this specific experiment the values indicate strong fits from 0.7-0.99. To calculate the value of for a specific graph I applied the formula:
![\[R^{2} = 1 - \frac{\displaystyle \sum \left( d_{\text{avg},i} - \overline{d}'{\text{avg}} \right)^{2}} {\displaystyle \sum \left( d{\text{avg},i} - \overline{d}_{\text{avg}} \right)^{2}} = 0.978\]](https://nhsjs.com/wp-content/ql-cache/quicklatex.com-cef0166c31c46daae0aa462cd9c201b7_l3.png "Rendered by QuickLaTeX.com")
Where  is the mean value of the horizontal distance travelled and
  the predicted value from the regression model.
The last metric that can be obtained from the values and the graph is RMSE, which is a standard statistical metric used to evaluate the performance of predictive model. In this case, the RMSE has a value of  that shows the validity of the data and also supports the claim that there are still improvements that can be made to reduce the uncertainties of the measurements.
To find the projected maximum distance that could be travelled at that angle I will use the formula for the vertex of a quadratic graph. More specifically, the graph is of the form
![\[y = A x^{2} + B x + C,\]](https://nhsjs.com/wp-content/ql-cache/quicklatex.com-41abd3ca1d4b8d2b97ab08cce0746077_l3.png "Rendered by QuickLaTeX.com")
where
![\[A = (-12 \pm 3)\cdot 10^{-5}\ \text{m}\cdot\text{g}^{-2},\]](https://nhsjs.com/wp-content/ql-cache/quicklatex.com-3ba874de646a9670da99dcb16b650ce7_l3.png "Rendered by QuickLaTeX.com")
![\[B = (0.10 \pm 0.02)\ \text{m}\cdot\text{g}^{-1},\]](https://nhsjs.com/wp-content/ql-cache/quicklatex.com-2c480b3856cf246fb2d2e4986720e59a_l3.png "Rendered by QuickLaTeX.com")
![\[C = (4 \pm 2)\ \text{m}.\]](https://nhsjs.com/wp-content/ql-cache/quicklatex.com-6f527134167dfb3ac5beb2055b704352_l3.png "Rendered by QuickLaTeX.com")
![\[x_{\max} = \frac{-B}{2 \cdot A}\]](https://nhsjs.com/wp-content/ql-cache/quicklatex.com-ca85716b71cf907e2ba1b4c7d69ffe76_l3.png "Rendered by QuickLaTeX.com")
![\[x_{\max} = \frac{0.1}{2 \cdot (-12 \cdot 10^{-5})}\]](https://nhsjs.com/wp-content/ql-cache/quicklatex.com-2c26282cf900c3370460dd202d23ad6d_l3.png "Rendered by QuickLaTeX.com")
![\[x_{\max} = 416.7\ \text{g}\]](https://nhsjs.com/wp-content/ql-cache/quicklatex.com-0dfc0d37b4ba8da468bb4fa904fd4778_l3.png "Rendered by QuickLaTeX.com")
For the uncertainty,
![\[\frac{\delta x_{\max}}{x_{\max}} = \frac{\delta A}{A} + \frac{\delta B}{B}\]](https://nhsjs.com/wp-content/ql-cache/quicklatex.com-510da4f3524ed46dc993b9429176afa3_l3.png "Rendered by QuickLaTeX.com")
![\[\delta x_{\max} = x_{\max} \cdot \left( \frac{\delta A}{A} + \frac{\delta B}{B} \right)\]](https://nhsjs.com/wp-content/ql-cache/quicklatex.com-b475e0c2c391b59aa4faed1c0124d308_l3.png "Rendered by QuickLaTeX.com")
![\[\delta x_{\max} = 416.7 \cdot \left( \frac{3}{12} + \frac{0.02}{0.10} \right)\]](https://nhsjs.com/wp-content/ql-cache/quicklatex.com-ae28af9f541fc87b1b6674105463350a_l3.png "Rendered by QuickLaTeX.com")
![\[\delta x_{\max} = 20\]](https://nhsjs.com/wp-content/ql-cache/quicklatex.com-6a97d2017a2df8ea8ebd9120127b8adf_l3.png "Rendered by QuickLaTeX.com")
![\[x_{\max} = 420 \pm 20 \text{ g}\]](https://nhsjs.com/wp-content/ql-cache/quicklatex.com-f916b4409454eb999b7a854434468419_l3.png "Rendered by QuickLaTeX.com")
Therefore,
To find the maximum average distance  I will use the above value found in the equation of the best fit curve,
![\[y_{\max} = (-12 \cdot 10^{-5}) \cdot x_{\max}^{2} + 0.10 \cdot x_{\max} + 4\]](https://nhsjs.com/wp-content/ql-cache/quicklatex.com-849d5a3cda699cba7548612555bb5b0b_l3.png "Rendered by QuickLaTeX.com")
![\[y_{\max} = (-12 \cdot 10^{-5}) \cdot 420^{2} + 0.10 \cdot 420 + 4\]](https://nhsjs.com/wp-content/ql-cache/quicklatex.com-3864817fa4f8295aa59da5f1b62e639f_l3.png "Rendered by QuickLaTeX.com")
![\[y_{\max} = 24.8 \text{ m}\]](https://nhsjs.com/wp-content/ql-cache/quicklatex.com-365f1b725ac3a87bac1739164c89fa1e_l3.png "Rendered by QuickLaTeX.com")
However, to find the uncertainty of the maximum value of  , I must use partial
derivatives:
Firstly, the equation is:
![\[y = A \, x_{\max}^{2} + B \, x_{\max} + C\]](https://nhsjs.com/wp-content/ql-cache/quicklatex.com-f3e7945bc099d338abcbb7ba6b4654e7_l3.png "Rendered by QuickLaTeX.com")
![\[y = A \left( \frac{B}{4A^{2}} \right) - B \left( \frac{B}{2A} \right) + C\]](https://nhsjs.com/wp-content/ql-cache/quicklatex.com-175adfbf825ac530a2ed5bac377f2831_l3.png "Rendered by QuickLaTeX.com")
![\[y = \frac{B^{2}}{4A} - \frac{B^{2}}{2A} + C\]](https://nhsjs.com/wp-content/ql-cache/quicklatex.com-29f4e00898e74c5dd90b6876b96c0796_l3.png "Rendered by QuickLaTeX.com")
![\[y = - \frac{B^{2}}{4A} + C\]](https://nhsjs.com/wp-content/ql-cache/quicklatex.com-353f01d4c84d44fa37223b8563f0f4da_l3.png "Rendered by QuickLaTeX.com")
Then to find its uncertainty,
![\[\delta y = \sqrt{ \left( \frac{\partial y}{\partial B} \cdot \delta B \right)^{2} + \left( \frac{\partial y}{\partial A} \cdot \delta A \right)^{2} + \left( \frac{\partial y}{\partial C} \cdot \delta C \right)^{2} }\]](https://nhsjs.com/wp-content/ql-cache/quicklatex.com-dd04bc502b76bd85f7bff400be007881_l3.png "Rendered by QuickLaTeX.com")
In this case:
![\[\frac{\partial y}{\partial B} = \frac{-2B}{A}, \qquad, \frac{\partial y}{\partial A} = \frac{B^{2}}{4A^{2}}, \qquad, \frac{\partial y}{\partial C} = 1\]](https://nhsjs.com/wp-content/ql-cache/quicklatex.com-46157b8a3137c45b72e78aa97ce4a14e_l3.png "Rendered by QuickLaTeX.com")
Therefore, the uncertainty of becomes
![\[\delta y = \sqrt{\left( \frac{-2B}{A} \cdot \delta B \right)^{2} \left( \frac{B^{2}}{4A^{2}} \cdot \delta A \right)^{2} \left( 1 \cdot \delta C \right)^{2}}\]](https://nhsjs.com/wp-content/ql-cache/quicklatex.com-94a306c1833aa268226800ec74fffd10_l3.png "Rendered by QuickLaTeX.com")
![\[\delta y = \sqrt{\left( \frac{-2 \cdot 0.10}{-12} \cdot 0.02 \right)^{2} \left( \frac{0.10^{2}}{4 \cdot (-12)^{2}} \cdot 3 \right)^{2}(1 \cdot 2)^{2}\]](https://nhsjs.com/wp-content/ql-cache/quicklatex.com-25a62ff3555c853fef52fd446525601f_l3.png "Rendered by QuickLaTeX.com")
![\[\delta y = 2 \text{ m}\]](https://nhsjs.com/wp-content/ql-cache/quicklatex.com-a7e37c0df1df0715f717f34443557767_l3.png "Rendered by QuickLaTeX.com")
Thus,
![\[y = 25 \pm 2 \text{ m}\]](https://nhsjs.com/wp-content/ql-cache/quicklatex.com-ab43546f5561f755a59a595287c5a06d_l3.png "Rendered by QuickLaTeX.com")
The curve fit suggests that to reach a maximum distance at an angle of 45 degrees, I must use  of water with an associated margin of error of
  . This would make the rocket reach a distance of
  . Therefore, not only does graph 1 has a high correlation, which indicates that the launches and measurements were efficient and accurate, it is also in accordance with equation 5 which suggests that at an angle of 45 degrees the water rocket would be able to travel the highest maximum distance.
The presence of the positive y-intercept implies that even without any water mass inside the rocket, the pressurized air could lead to a range of  for the empty bottle at a launch angle of 45 degrees, which of course is something that could be tested in case of a repeating the measuring process.
Table 7 presents the analyzed data for an angle of 60 degrees.
| Angle °/±0.5° | Average mass of water m/g | mavg/g | Air pressurebar/±0.2 bar | Distance travelled davg/ m | davg/m |
| 60 | 102.0 | 1.0 | 3.2 | 12.55 | 0.25 |
| 60 | 201.0 | 1.0 | 3.2 | 16.65 | 1.25 |
| 60 | 302.0 | 1.0 | 3.2 | 19.7 | 1.6 |
| 60 | 403.0 | 1.0 | 3.2 | 23.25 | 0.35 |
| 60 | 503 | 2 | 3.2 | 21.5 | 0.1 |

Graph 1. Average distance (m) vs water mass (g) for 60 degrees
For the launch at 60 degrees the correlation of the graph is 0.9818 which indicates a good fit. This series of launches had mostly the same errors during the experiment as the first series of launches at 45 degrees. By using the same process, the graph is of the form  , where
Therefore, to calculate the value of  for this graph,
![\[R^{2} = 1 - \frac{\displaystyle \sum \left(d_{\text{avg},i} - \overline{d}'{\text{avg}}\right)^{2}} {\displaystyle \sum \left(d{\text{avg},i} - \overline{d}_{\text{avg}}\right)^{2}} = 0.984\]](https://nhsjs.com/wp-content/ql-cache/quicklatex.com-c221764b55f6b354c4c8467fa55d982d_l3.png "Rendered by QuickLaTeX.com")
To find the maximum distance traveled suggested by the graph I will use the
vertex again:
![\[x_{\max} = \frac{0.07}{2 \cdot (-8 \cdot 10^{-3})}\]](https://nhsjs.com/wp-content/ql-cache/quicklatex.com-1731ac9ac1b6052179ec3bd64139561c_l3.png "Rendered by QuickLaTeX.com")
![\[x_{\max} = 437.5 \text{ g}\]](https://nhsjs.com/wp-content/ql-cache/quicklatex.com-f6c8fd96091eb97212ab51b4de4baae7_l3.png "Rendered by QuickLaTeX.com")
For the uncertainty,
![\[\delta x_{\max} = 437.5 \cdot \left( \frac{3}{8} + \frac{0.02}{0.07} \right)\]](https://nhsjs.com/wp-content/ql-cache/quicklatex.com-e6b9c244cb41f528ff38a1ef32c124ac_l3.png "Rendered by QuickLaTeX.com")
![\[\delta x_{\max} = 40 \text{ g}\]](https://nhsjs.com/wp-content/ql-cache/quicklatex.com-d814ebc0e74945c63488949eee878e70_l3.png "Rendered by QuickLaTeX.com")
![\[x_{\max} = 440 \pm 40 \text{ g}\]](https://nhsjs.com/wp-content/ql-cache/quicklatex.com-077607c8b3e4b95fadcb2c5b0e23efbc_l3.png "Rendered by QuickLaTeX.com")
To find the maximum average distance I will use the above value found in the equation of the best fit curve,
![\[y_{\max} = (-8 \cdot 10^{-3}) \cdot (440)^{2} + 0.07 \cdot (440) + 6\]](https://nhsjs.com/wp-content/ql-cache/quicklatex.com-87c6c8608502e00138e36c917743d0ee_l3.png "Rendered by QuickLaTeX.com")
![\[y_{\max} = 21.3 \text{ m}\]](https://nhsjs.com/wp-content/ql-cache/quicklatex.com-c7ac1d02560f0baa3fa355995cccece6_l3.png "Rendered by QuickLaTeX.com")
For the uncertainty,
![\[\delta y = \sqrt{\left( \frac{2B}{A} \cdot \delta B \right)^{2} \left( \frac{B^{2}}{4A^{2}} \cdot \delta A \right)^{2} \left( 1 \cdot \delta C \right)^{2}}\]](https://nhsjs.com/wp-content/ql-cache/quicklatex.com-31b396ca5e284e38f850d8573d35b9bc_l3.png "Rendered by QuickLaTeX.com")
![\[\delta y = \sqrt{\left( \frac{2 \cdot 0.07}{-8 \cdot 10^{-3}} \cdot 0.02 \right)^{2} \left( \frac{(0.07)^{2}}{4 \cdot (-8 \cdot 10^{-3})^{2}} \cdot 3 \right)^{2} (1 \cdot 2)^{2}}\]](https://nhsjs.com/wp-content/ql-cache/quicklatex.com-1d965b21d2b888f969485150d13c4cde_l3.png "Rendered by QuickLaTeX.com")
![\[y = 21 \pm 2 \text{ m}\]](https://nhsjs.com/wp-content/ql-cache/quicklatex.com-290f64d27426d789402c11620f016887_l3.png "Rendered by QuickLaTeX.com")
The curve fit suggests that to reach a maximum distance at an angle of 60 degrees, I must use 440 grams of water with an associated margin of error of 40 grams. This would make the rocket reach a distance of 21 meters with an associated margin of error of 2 meters. In my experiment, at 60 degrees, the water rocket reached a maximum horizontal distance of 23.25 meters at a water mass of 400 grams.
The presence of the positive y-intercept implies that even without any water mass inside the rocket, the pressurized air could lead to a range of (6 ± 2) m for the empty bottle at a launch angle of 60 degrees, which of course is something that could be tested in case of a repeating the measuring process.
Table 8 presents the analyzed data for an angle of 75 degrees.
| Angle ° ±0.5 | Average mass of water m/g | Δmavg/g | Air pressure ±0.2 | Distance travelled davg/m | Δdavg/m |
|---|---|---|---|---|---|
| 75 | 103.0 | 1.0 | 3.2 | 12.3 | 0.2 |
| 75 | 203.5 | 0.5 | 3.2 | 17.9 | 0.4 |
| 75 | 304.5 | 0.5 | 3.2 | 14.3 | 0.2 |
| 75 | 401.5 | 0.5 | 3.2 | 15.4 | 0.3 |
| 75 | 504.0 | 0.5 | 3.2 | 14.3 | 0.4 |
Table 8: Processed data for launch at an angle of 75 degrees
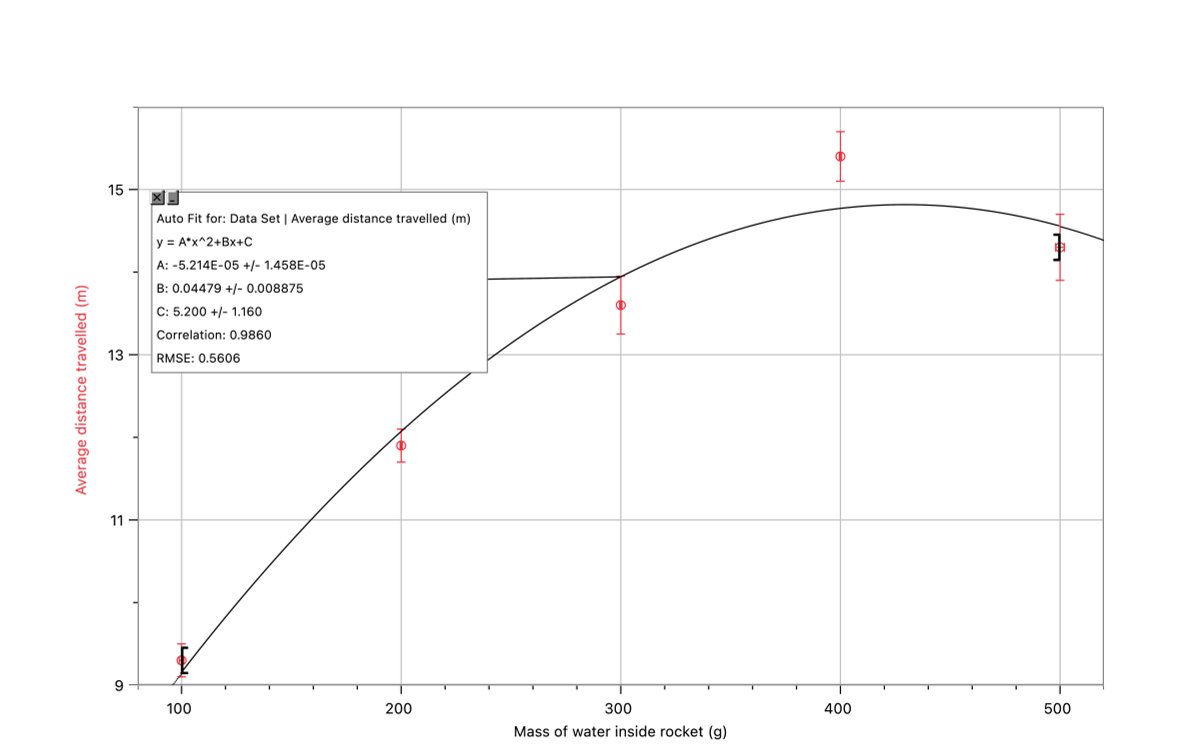
For the launch at 75 degrees, the graph’s correlation coefficient is 0.9860 which indicates both the success of the launches but the presence of small errors or factors affecting the experiment.
Therefore, to calculate the value of  for graph 3,
![\[R^{2} = 1 - \frac{\displaystyle \sum \left( d_{\text{avg},i} - \overline{d}'{\text{avg}} \right)^{2}} {\displaystyle \sum \left( d{\text{avg},i} - \overline{d}_{\text{avg}} \right)^{2}} = 0.942\]](https://nhsjs.com/wp-content/ql-cache/quicklatex.com-844aedf564fff8e1b683387bd50c527a_l3.png "Rendered by QuickLaTeX.com")
While the value of for graph 3 is lower than the two previous graphs, the value of RMSE is much higher at 0.5066 which strongly signifies a better model accuracy than the two previous launch angles.
As seen from the other two graphs, the quadratic equation which links the average distance travelled  with the mass of the water inserted in the rocket
  is of the form
where
(1) 
Thus, with the above data, the best fit curve states that the maximum distance is the following maximum y-coordinate and it can be reached by using the following mass of water inside the rocket:
![\[x_{\max} = \frac{0.045}{2 \cdot (-5.2 \cdot 10^{-5})}\]](https://nhsjs.com/wp-content/ql-cache/quicklatex.com-1fcf4cc11a37edfb970a3dc7dc7bfed5_l3.png "Rendered by QuickLaTeX.com")
![\[x_{\max} = 432.7 \ \text{g}\]](https://nhsjs.com/wp-content/ql-cache/quicklatex.com-e13a11112e3a9ef6c830b30e6017356b_l3.png "Rendered by QuickLaTeX.com")
For the uncertainty,
![\[\delta x_{\max} = 432.7 \cdot \left( \frac{1.5}{5.2} + \frac{0.008}{0.045} \right)\]](https://nhsjs.com/wp-content/ql-cache/quicklatex.com-80bbf701e070bfe003f5053845f1f647_l3.png "Rendered by QuickLaTeX.com")
![\[\delta x_{\max} = 50 \ \text{g}\]](https://nhsjs.com/wp-content/ql-cache/quicklatex.com-9a3b76b97c1e9a7177b2647c00d9dc2c_l3.png "Rendered by QuickLaTeX.com")
Therefore,
![\[x_{\max} = 430 \pm 50 \ \text{g}\]](https://nhsjs.com/wp-content/ql-cache/quicklatex.com-33d16e782687a061ce4b5ab943ec399e_l3.png "Rendered by QuickLaTeX.com")
To find the maximum average distance I will use the above value found in the equation of the best fit curve,
![\[y_{\max} = (-5.2 \cdot 10^{-5}) \cdot x_{\max}^{2} + 0.045 \cdot x_{\max} + 5.2\]](https://nhsjs.com/wp-content/ql-cache/quicklatex.com-ce5e17aaa4a44e47ebda4dcf99f065ad_l3.png "Rendered by QuickLaTeX.com")
![\[y_{\max} = (-5.2 \cdot 10^{-5}) \cdot 430^{2} + 0.045 \cdot 430 + 5.2\]](https://nhsjs.com/wp-content/ql-cache/quicklatex.com-31cd182228e7b262a1e2ff7e9d1cb7a4_l3.png "Rendered by QuickLaTeX.com")
![\[y_{\max} = 14.9 \ \text{m}\]](https://nhsjs.com/wp-content/ql-cache/quicklatex.com-d9ab2a5853b063eed68830051f0902dc_l3.png "Rendered by QuickLaTeX.com")
To calculate its uncertainty as illustrated before,
![\[\delta y = \sqrt{\left( \frac{-2B}{A} \cdot \delta B \right)^{2} \left( \frac{B^{2}}{4A^{2}} \cdot \delta A \right)^{2} \left( 1 \cdot \delta C \right)^{2}\]](https://nhsjs.com/wp-content/ql-cache/quicklatex.com-9f9624ab1dc7484ecce1d8c0a743c809_l3.png "Rendered by QuickLaTeX.com")
![\[\delta y = \sqrt{\left( \frac{-2 \cdot 0.045}{-5.2} \cdot 0.008 \right)^{2} \left( \frac{0.045^{2}}{4 \cdot (-5.2)^{2}} \cdot 1.5 \right)^{2} (1 \cdot 1.2)^{2}}\]](https://nhsjs.com/wp-content/ql-cache/quicklatex.com-35d03dd7e4764c0c4df32d41bcd1c42f_l3.png "Rendered by QuickLaTeX.com")
![\[\delta y = 1.2 \ \text{m}\]](https://nhsjs.com/wp-content/ql-cache/quicklatex.com-36531b07322ae2cb17431bbda5662525_l3.png "Rendered by QuickLaTeX.com")
The vertex of the above graph is  The curve fit indicates that the maximum distance can be accomplished using
  of water. In comparison to my results, in which we achieved a very similar maximum distance, of
  , using approximately
  of water.
The presence of the positive y-intercept implies that even without any water mass inside the rocket, the pressurized air could lead to a range of  for the empty bottle at a launch angle of 75 degrees, which of course is something that could be tested in case of a repeating the measuring process.
Therefore, it is seen that as the angle of launch increases the distance travelled decreases which can be also verified from equation 5 as the maximum value for  can be obtained at 45 degrees which is equal to 1.
Discussion
Conclusions and future work
In conclusion, based on the data analysis, the equation that relates the distance travelled by the water rocket to mass is of the form y=Ax²+bx+c
The recorded data indicate that for water masses between 100-440 grams, the distance travelled increases. However, beyond approximately 440 grams, the distance travelled began to decrease. This observation is not only corroborated by the experimental data and best-fit curves, but also by a Spearman’s rank correlation analysis which had a high value in all three graphs (0,9888;0,9818;0,9860)9, which confirmed a statistically significant positive correlation between mass and range within the 100–440 g interval. When masses exceeded this threshold, a notable decline in distance was observed.
When observing the graphs, some data points, along with their error bars, did not align precisely with the best fit curve. While this overall trend is supported by both my results and prior research10,11,12 a clearer and more precise conclusion would require additional repetitions and a broader range of mass values, something that was not feasible within the time and resource constraints of the research program. Moreover, the difference in the uncertainties of the data points shows there were factors that, regardless of simple human errors, affected the launches and the ranges measured. To be precise, the wind resistance during the launch (opposing the launch of the rocket at a speed of 9km/h)13, the friction of the ramp, very small changes in the shape of the rocket as it was used many times and differences in the mass used across measurements are all factors which affect both the trajectory of the rocket and the distance that it travels. This is also visible in the uncertainties at the best fit curve created by logger pro. In all three graphs, the factors A, B, C all have a related uncertainty due to the above errors.
The experimental findings are consistent with previous research. To begin with, as mentioned in the section of the principles of operation of a water rocket, the two studies, Pathan14 and Acciani15, that hypothesized a quadratic relationship between the two studied variables also reached the same conclusion after conducting research or an experiment like mine. Furthermore, Toma16’17’18’19 found that optimal performance occurs when the applied pressure is approximately 7 atm and the water volume represents 40–50% of the rocket’s capacity. Additional studies provide further support: Yang20 demonstrated that excess water reduces range due to added weight, while insufficient water results in inadequate thrust21,22,23. Romrell24 confirmed experimentally that maximum distance is achieved with an optimal water mass that balances thrust generation with reduced weight resistance.
Overall, the conclusion reached is that the relationship between launch mass and distance travelled is quadratic in nature. This outcome is not only evident in the collected data but is also supported by the underlying physics of thrust and momentum, as well as by multiple independent studies25’26’27.
Future improvements to the experiment should focus on expanding the dataset. A more extensive study could include additional launch angles (at least to determine the optimal launch trajectory28’29’30 and a measurement of the intial speed via video-based velocimetry through programs such as Capestone. In addition, a wider range of water masses could be used or rockets of varying shapes to assess aerodynamic performance. Moreover, for more precise results the launcher could be improved by using guide rails for repeatable aim and different nozzle diameters31 to see the dependence of the horizontal range travelled on the opening of the nozzel. By launching rockets at different wind speeds while keeping mass and angle constant, it would be possible to quantify the influence of air resistance on rocket range. Furthermore, another promising avenue of investigation would be to systematically evaluate the role of wind resistance. In other words, to adress wind issues, the experiment could be carried out indoors, or wind limits could be set prior to the launches. Another way of adressing the problem of wind speed is by connecting a wind meter to a laptop and record the wind speed variation during the measurements. This would allow me to use the exact value of the wind speed and consider them it into my measurements. In addition, to show how the pressure was valued during the launches, record videos of the gauge meter and create a pressure vs time graph32’33 to map thrust phase parameters. Lastly, record videos of the propulsion of the water rocket to record the initial velocity and analyze its launch34’35’36. These extensions would strengthen the conclusions of this study and contribute to a more comprehensive understanding of water rocket dynamics.
Concerns and limitations
In table 9, we are analyzing the concerns and limitations we faced in the experiment, including where the rocket was pointed, the wind speed during the launch, the range of masses used, the number of trials conducted, the shape of the rocket and the available equipment.
| Error in the experiment | Small analysis of the error | Way of improving |
|---|---|---|
| Aiming of the rocket | Unfortunately, due to errors, human and act of the setup, the rocket was positioned in the same direction in which it launched. There were slight differences that occurred during each launch which affected the distance recorded. | By system or chart angle of the launcher that holds the rocket in the same place throughout the launch and doesn’t change at every launch. |
| Wind speed and its direction | The experiment was performed outside; hence the rocket had to overcome the wind reached. When analyzing meteorological data (Goniec website), wind speed was 3 km/h. This affected the formation of the experiment. | To improve our test we could have performed the experiment way later at the same location or in a possible area without as much wind away from shore. If the rocket could help the shower fall further ahead, we would have to achieve this and direction changes spontaneously. Therefore, to reduce this measurement would have to be conducted in a more secure place. |
| Range of masses | The masses that were used ranged from 100–500 grams. This may have not shown any beyond 500 grams related to the same result from other setups that could have conducted similar experiments. | In future, a wider range of masses could have been used. Perhaps 100–1000 grams ranging from 100–100 grams from each setup or 50 grams which could have better demonstrated the effect on the range of launch. |
| Number of trials | During the experiments, we conducted each experiment twice. Increasing the number of trials would minimize the error to occur during the experiment, thus producing more accurate data. | Conducting more trials (around at least 5 for each launch) would have reduced human errors and the effects of errors that occur during each trial. |
| Different rocket shapes | We only used one rocket shape that launched the major flat end. This may have not allowed the rocket to have a smoother aerodynamic shape and therefore a bigger range. | Performing the same experiment with different rocket shapes (for example, different fin angles or a different nose cone) could have improved the overall aerodynamic performance and the maximum distance reached by the rocket. |
| Precision of equipment | The equipment used (measuring tape) had a precision of ±0.5 cm. Using a more precise piece of measuring equipment could have provided more accurate results. | Equipment with better accuracy would improve the overall precision and the conclusion reached. |
Acknowledgments
I extend my deepest gratitude to my supervisor and mentor, Fernanda-Maria Lugo-Bolanos, for her unwavering support and insightful critiques throughout my research journey. Her deep commitment to academic excellence and meticulous attention to detail have significantly shaped this dissertation. I am equally thankful to the members of the Lumiere program who helped me complete the paper, program Manager Maheem Jiwani and my writing coach Sapna Sehgal, for their constructive feedback and essential suggestions that enhanced the quality of my work.
Lastly, my appreciation also goes to my father who helped me conduct my experiment. He brought me all the necessary resources and provided me with any help during the measurements. This paper has not only deepened my understanding of engineering and physics, but it has also demonstrated that the refinement of such a work cannot be achieved by a single individual alone.
References
- NASA. Water rocket. NASA. (2023). https://www1.grc.nasa.gov [↩]
- Space Mesmerise. The importance of rockets in revolutionizing space exploration: How rockets changed space technology.Space Mesmerise.(n.d.).https://spacemesmerise.com. [↩]
- K. A. Tsokos.Physics for the IB Diploma Coursebook.Cambridge University Press (2014). [↩]
- J. N. Kambouris, T. J. Alatis. Educational model of Newton’s laws through water rocket experiments.Eur. J. Sci. Educ.42, 887–901 (2020). [↩]
- S. Deng, Z. Liu, H. Wang. Dynamics model and simulation optimization analysis of single-stage water rocket. J Phys Conf Ser. 2404, 012054 (2022). [↩]
- R. Pathan, J. Ramjan. Design and development of water rocket. Int. J. Innov. Eng. Res. Technol.3, 165–170 (2016).https://media.neliti.com. [↩]
- D. Acciani, M. Carrozzini, A. Giannoccaro, P. Simeone. Bottle rockets and parametric design in a converging–diverging design strategy. J. Appl. Mech. Mater.373, 293–299 (2019). [↩]
- Fernando, J. (n.d.).R-squared: Definition, calculation, and interpretation. Investopedia. https://www.investopedia.com/terms/r/r-squared.asp [↩]
- (Mathspace. 6.11 Spearman’s rank coefficient | Standard level Maths | IB Applications and Interpretation SL – 2021 Edition.Mathspace.(2020). [↩]
- R. Barrio-Perotti, E. Blanco-Marigorta, D. Gómez-Blanco, J. Gómez-Sobrino. Theoretical and experimental analysis of the physics of water rockets.Eur. J. Phys.31, 1131–1147 (2010). [↩]
- W. W. Sun, Z. J. Wei, N. F. Wang. Influential factors of nozzle performance of hot water rocket motor.Def. Technol.19, 567–578 (2023). [↩]
- S. Z. Alam, H. Kim. The effect of launch angle and water ratio on range in water rockets.Korean J. Aerosp. Eng.45, 101–109 (2020). [↩]
- R. D. White, M. M. Prather. The role of air resistance in water rocket motion: A computational analysis.Phys. Teach.53, 201–208 (2015). [↩]
- R. Pathan, J. Ramjan. Design and development of water rocket.Int. J. Innov. Eng. Res. Technol.3, 165–170 (2016).https://media.neliti.com. [↩]
- D. Acciani, M. Carrozzini, A. Giannoccaro, P. Simeone. Bottle rockets and parametric design in a converging–diverging design strategy.J. Appl. Mech. Mater.373, 293–299 (2019). [↩]
- E. Toma, Y. Ito. The method for optimum design of water rocket flight stability performance conditions using CAE with T method and robust parameter design.J. Appl. Math. Phys.9, 2669–2697 (2021). https://doi.org/10.4236/jamp.2021.911172 [↩]
- Toma, Eiji, et al. “Optimization of Flight Performance of PET Bottle Rocket by Integrated Analysis of “DynamicsSimulation System” and “Parameter Design.” Journal of the Institute of Industrial Applications Engineers, vol. 7, no. 2, 25 Apr. 2019, pp. 59–71, https://doi.org/10.12792/jiiae.7.59. [↩]
- Toma, Eiji, and Yoshihiro Ito. “The Method for Optimum Design of Water Rocket Flight Stability Performance Conditions Using CAE with T Method and Robust Parameter Design.” Journal of Applied Mathematics and Physics, vol. 09, no. 11, 2021, pp. 2669–2697, www.scirp.org/pdf/jamp_2021110514043632.pdf, https://doi.org/10.4236/jamp.2021.911172. [↩]
- Toma, Eiji, Katsumi Miyama, and Satoshi Iuchi. “Optimization of Flight Stability of Water Rockets by Integrated Analysis of ‘Dynamic Simulation System’ and ‘Robust Design’.” The Japanese Journal of the Institute of Industrial Applications Engineers, vol. 8, no. 1, 2020, pp. 28-38. doi:10.12792/jjiiae.8.1.28. [↩]
- Y. Yang, L. Liu, M. Chen. Study on thrust performance of small water rocket launch.J. Phys. Conf. Ser.2313, 012021 (2022). https://doi.org/10.1088/1742-6596/2313/1/012021 [↩]
- R. Watanabe, N. Tomita, T. Takemae. Thrust characteristics of water rocket and their improvement. J Jpn Soc Aeronaut Space Sci. 51, 314–321 (2003). [↩]
- R. Watanabe, N. Tomita, T. Takemae. Aerodynamic characteristics of water rocket and stabilization of flight trajectory.J. Jpn. Soc. Aeronaut. Space Sci.52, 449–455 (2004). [↩]
- G. E. Thorncroft, C. C. Pascual. Experimental investigation of water rocket thrust and trajectory prediction. Am J Phys. 78, 236–245 (2010). [↩]
- L. Romrell, H. Ross, B. Hargreaves. Water rockets.Tigard High School Physics Research Project.(2010). http://tuhsphysics.ttsd.k12.or.us/Research/IB08/RossHargRomr/index.htm [↩]
- Barrio-Perotti, R., E. Blanco-Marigorta, J. Fernández-Francos, and M. Galdo-Vega.“Theoretical and Experimental Analysis of the Physics of Water Rockets.”European Journal of Physics, vol. 31, no. 5, 2010, pp. 1131–1147. [↩]
- Ota, T., Y. Fukui, M. Takahashi, and Y. Arai.“Parametric Study of Water Rocket for Optimum Flight.”Journal of the Japan Society for Aeronautical and Space Sciences, vol. 49, no. 571, 2002, pp. 382–389. [↩]
- Chang, Feng-Yao, and Huei-Chu Weng. “Dynamic Characteristic Analysis of a Two-Stage Water Rocket in Flight.”CSME Journal, vol. 41, no. 5, 2020, pp. 605–614. [↩]
- Finney, Greg. (2000). Analysis of a water-propelled rocket: A problem in honors physics. American Journal of Physics – AMER J PHYS. 68. 10.1119/1.19415. [↩]
- Prusa, Joseph M.“Hydrodynamics of a Water Rocket.”SIAM Review, vol. 42, no. 4, 2006, pp. 719–726. [↩]
- Gommes, Cédric J.“A More Thorough Analysis of Water Rockets: Moist Adiabats, Transient Flows, and Inertial Forces in a Soda Bottle.”American Journal of Physics, vol. 78, no. 3, 2010, pp. 236–243. [↩]
- J. H. Kim, Y. S. Choi. Experimental optimization of launch parameters for small-scale water rockets. Exp Therm Fluid Sci. 109, 110001 (2019). [↩]
- Holland, Chrism.LU2.PDF file. Waterocket Explorer, 2005,http://waterocket.explorer.free.fr/pdf/holland2005LU2.PDF. Accessed 21 Oct. 2025. [↩]
- Eef.edu.gr Σ. (n.d.-c). https://www.eef.edu.gr/media/5734/evgenidou_program_2020_final30.pdf. [↩]
- Asao, Shinichi, Masashi Yamakawa, Kento Sawanoi, and Seiichi Takeuchi.“Flight Simulation of Water Rocket.”International Journal of Computational Methods, vol. 19, no. 7, 2022, article 2141017. [↩]
- “Analysis of the Propulsion Phase of Water Rockets Using Smartphone Sensors andVideo Analysis.” Physics Teacher Education, vol. 60, no. 6, 2022, pp. 437–444. [↩]
- Chang, Feng-Yao, and Huei-Chu Weng. “Dynamic Characteristic Analysis of a Two-Stage Water Rocket in Flight.” Journal of the Chinese Society of Mechanical Engineers, vol. 41, no. 5, 2020, pp. 605-614. [↩]


