
Abstract
Since its launch of ChatGPT in November 2022, generative artificial intelligence (AI) has been changing numerous aspects of our daily life. Specifically, it provides students with additional resources to obtain information while enabling them to work with new content, finish their assignments, and interact with academic materials. It is important to understand the impacts of AI on the younger generations. Data were collected from a sample of 185 U.S. middle and high school students surveyed about demographic differences in AI usage and their perspective of AI. Three research questions were posed to determine the level of AI usage, student perspective toward AI, and the factors contributing to these findings through Technology Acceptance Model. Overall, students possessed a neutral level of comfort towards AI’s perceived usefulness. There were significant differences in demographic characteristics for perceived usefulness, e.g., males, Asian, and high school students believed it’s more useful. However, perceived risks of AI were majorly agreed upon by most students, regardless of demographic background. The results also demonstrated that teacher permission was a significant driver of whether students would use AI or not. This study demonstrated that AI education required specific adaptation to meet the requirements of different population groups. Schools need to incorporate ethical AI instruction into their curriculum for middle and high school students while creating environments that promote fair AI advantages to all students while addressing the problems of dishonesty and employment uncertainty.
Introduction
Since the release of ChatGPT in November 2022, the world experienced a transformation in many aspects through generative artificial intelligence (AI). Since then, student learning habits and educational practices have experienced significant changes because of advancements in generative AI technology.
Recent articles highlighted the rapid revolution. For instance, UNESCO’s 2023 Global Education Monitoring Report documented how AI was revolutionizing education globally, with rapid adoption in curricula and tools across 193 member states1. In the US, it was reported that half (51%) of young people ages 14-22 reported using generative AI at some point, but only 4% claimed to be daily users2. Others also reported that the percentage of high school students who reported using GenAI tools for schoolwork was growing, from 79% to 84% between January and May of 20253. There were many researchers outside of the US also studying AI’s impacts to education4‘5. In Europe, widespread adoption prompted institutional reforms and highlighted concerns over academic integrity6. In Asian, it was reported that AI technologies revolutionized education by providing tailored learning experiences, identifying individual student needs, and improving overall academic outcomes but also raised concerns.7‘8‘9‘10‘11‘12.
Despite all these studies, very few focused on younger school students (ages 12 -18), with limited papers in this age group13. Even less was known about how middle and high school students used AI in real classrooms and how AI impacted their behaviors or attitudes.
Especially, few utilized Technology Acceptable Model (TAM)14 to comprehend why some middle or high school students used it and some didn’t. According to TAM, people were more likely to use one technology if they think it would be helpful and easy to use. Applying this model, it allowed us to explore not only the frequency of usage but also the underlying attitudes and beliefs influencing their decisions to use AI in academic settings.
As high-school students, we wanted to understand how our peers actually used AI, whether it helped us learn better, and what worried us about it: cheating, jobs, or misinformation. By asking direct, student-friendly questions, this study captured a real-world snapshot of AI’s role in everyday teenage learning – filling a gap in the research and giving voice to students like us.
This study addressed the following research questions:
- To what extent did middle and high school students use AI tools?
- How did students perceive the usefulness and risks of AI?
- What factors explain demographic differences in AI usage and perspectives?
The goal of the study was to examine these questions while also exploring the underlying reasons for any differences that emerge.
Methods
Survey Questionnaire
The survey content was examined by one survey expert and two high school teachers, followed by pilot testing with 3 students to refine clarity. The final version developed consists of 13 questions with three demographic questions, gender (Male or Female), race (White, Asian, Black, Mixed, or Other), and grade level (Grades 6 through 12), along with ten questions examining students’ usage and perceptions of AI.
The ten AI-related questions in the survey listed below were related to the usage, students’ perception, and concerns for AI. For simplicity, in this paper, we used one word to be the abbreviation for each question and listed it in brackets shown at the beginning of each question. Note, these abbreviations were not shown in the actual survey. It was only used in this paper for analysis purposes. The answer options are shown in parentheses at the end of each question. The survey allowed ‘unknown’ as an option for the questions that might not have an obvious answer to the participants.
Q1.[Usage] How often do you use AI? (Never, occasionally, a few times, weekly, almost daily)
Q2.[Homework] Have you used AI to complete your homework? (Yes, No)
Q3.[Teacher] Do your teachers allow you to use AI for assignments? (Yes, No)
Q4.[Knowledge] Has AI improved your knowledge? (Not at all, Not really, Neutral, Somewhat, A lot)
Q5.[Engagement] Has AI improved your engagement in learning? (Not at all, Not really, Neutral, Somewhat, A lot)
Q6.[Dishonesty] Will AI use lead to more students engaging in academic dishonesty? (Not at all, Not really, Neutral, Somewhat, A lot)
Q7.[Job] Will AI-driven systems make it harder for you to find and keep a job in the future? (Yes, No, Unknown)
Q8.[Misinformation] Will AI increase the spread of misinformation (e.g., deepfake videos)? (Yes, No, Unknown)
Q9.[Privacy] Will AI lead to a loss of privacy (e.g., invasive surveillance)? (Yes, No, Unknown)
Q10.[Harm] Will a superintelligent AI one day do things that are detrimental to humanity? (Yes, No, Unknown)
The survey was based on the TAM within the constraints of a brief, classroom-friendly instrument. Behavioral Intention and Actual Use were captured by usage (Q1) and homework usage (Q2). Perceived usefulness (PU) was assessed via knowledge improvement (Q4) and engagement (Q5). Perceived Easy of Use (PEOU) was not directly measured due to survey length constraints and simplicity of generative AI. Perceived Risks (PRisk) were measured with five items, i.e., academic dishonesty (Q6), job security (Q7), misinformation (Q8), privacy concerns (Q9) and potential harm (Q10).
Data Collection
The survey was administered using Google Forms and distributed to middle and high school students. Over 500 surveys were sent out, only 185 students responded. Each student used either a smartphone, laptop, or any other electronic device to complete the survey. The time to complete the survey was intended to take less than 5 minutes per participant. All the data was collected anonymously without any incentives. To protect student privacy and reduce the risk of collecting identifiable or sensitive information, socioeconomic variables were intentionally excluded from the survey. Limiting data collection to non-sensitive items ensured higher comfort for participants and reduced the risk of inadvertent identification.
The data was collected from October 2024 to December 2024 and analyzed during the first half of 2025. Every participant responded to the questions, and there was no information missing from this survey.
Data Analysis
The data was analyzed using Excel and R software, version 4.5.115.
For the descriptive analyses, frequency and percentages were presented for categorical variables, mean and standard deviation (SD) were calculated for continuous variables. The Chi-square test was performed to assess the relationship between categorical variables. The t-test was used to compare means from two groups and analysis of variance (ANOVA) was used when multiple groups comparison was conducted.
To better understand the data, grade levels were grouped into two categories: Grades 6-8 as middle school and Grades 9-12 as high school. For race, the original five categories were consolidated due to the small sample sizes of the Black, Mixed, and Other groups; these were combined into a single ‘Other’ category. As a result, three racial groups, White, Asian, and Other, were used for statistical analysis.
To enable quantitative analysis, for questions with binary answers, they were coded “Yes” = 1, “No” = -1, “Unknown” = 0. For questions with five answers, they were coded as -2, -1, 0, 1 and 2 (from least likely to most likely), respectively.
Responses were standardized to z-scores to accommodate differing response formats. PU was derived as the mean of Knowledge (Q4) and Engagement (Q5). PRisk was derived as the mean of Dishonest (Q6), Jobs (Q7), Misinformation (Q8), Privacy (Q9) and Harm (Q10). The demographic differences for PU and PRisk were tested using t-test/ANOVA. The survey validity and reliability were also assessed using Cronbach’s alpha using R software.
Results
Demographics
Among these 185 students, 102 (55%) were boys and 83 (45%) were girls. 83 (45%) were Asians, 52 (28%) were white, 5 (3%) were black, 18 (10%) were mixed, and the rest of the students identified themselves as other races. From Grade 6 to Grade 12, there were 20 (11%), 26 (14%), 31 (17%), 48 (26%), 25 (14%), 17 (9%), and 18 (10%) students in each grade, respectively, adding up to 44% of students being in middle school (Grade 6-8) and 56% of students being high schoolers (Grade 9-12).
AI-related Questionnaires
Of those surveyed, only 31 (17%) students reported that they never used AI, and 52 (28%) indicated they used AI daily. 80 (43%) admitted to using AI for their homework assignments, and 86 (47%) were aware that their teachers allow them to use AI.
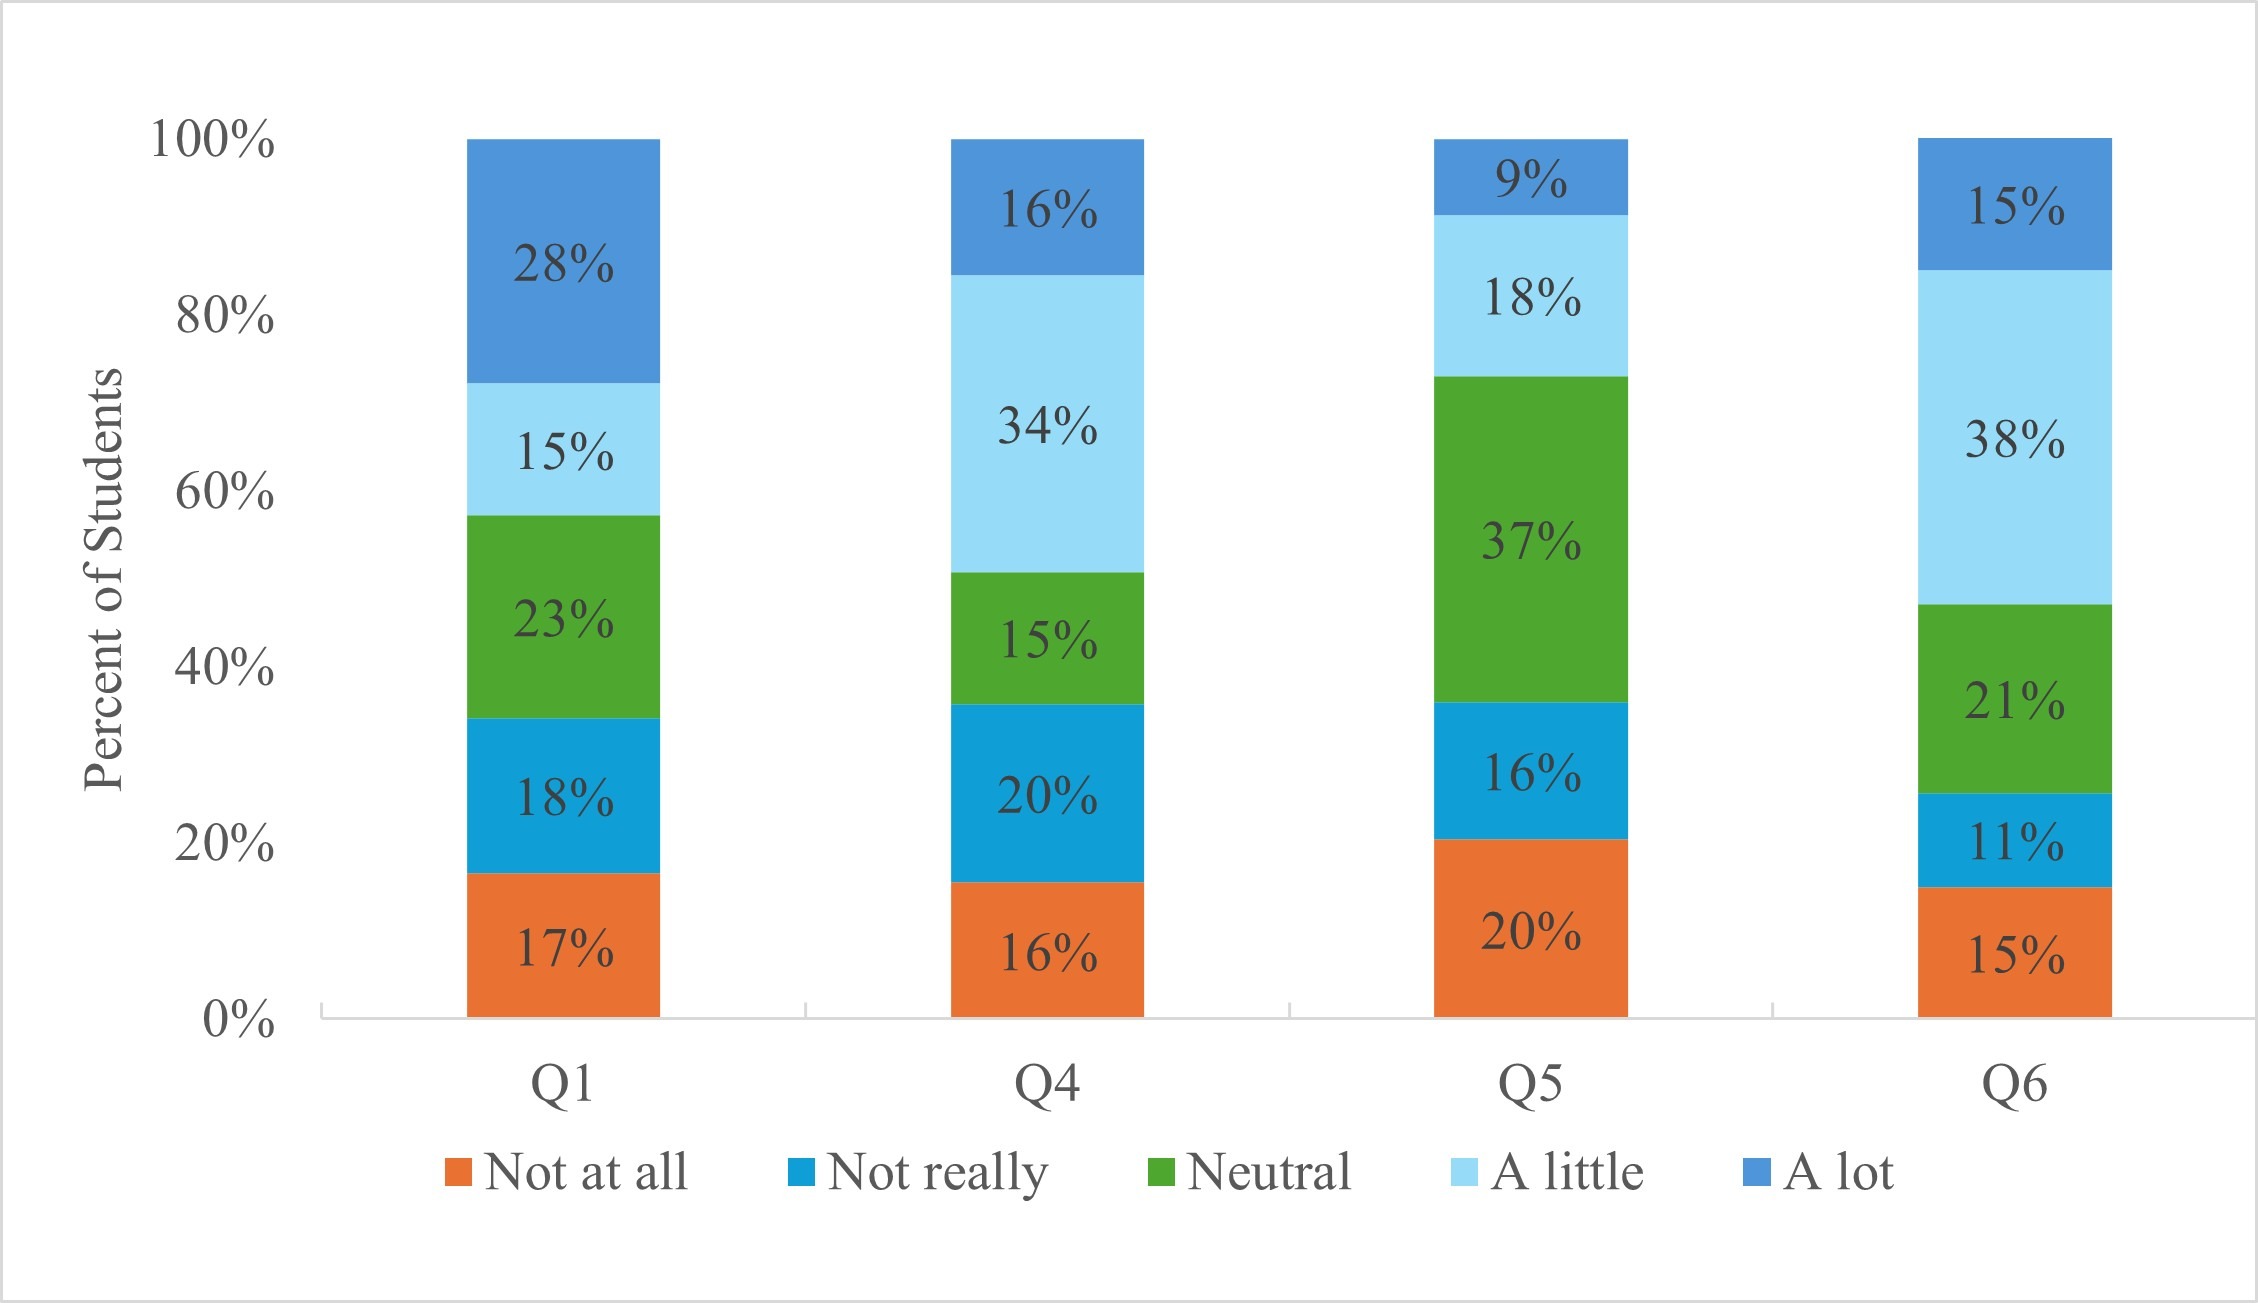
93 (50%) of the students believed that AI improved their knowledge a little or a lot. Only 50 (27%) believed that AI improved their academic engagement.
On the other hand, 98 (53%) thought that AI caused more academic dishonesty. 83 (45%) students worried about their job security for the future. The majority of students, 150 (81%), expressed concerns about the misinformation caused by AI. Additionally, 103 (56%) and 81 (44%) worried that AI might have privacy issues and cause harm to human beings.
Figure 1 showed the distribution of answers to those questions with five possible choices. Figure 2 showed the distribution of answers to those questions with binary answers.
TAM-based Analysis
Table 1 reported results of frequent AI usage (defined as daily and weekly use) and homework usage. P-values from Chi-square tests were utilized to examine group differences.
Approximately 43% of students reported frequent AI usage, and the same proportion (43%) reported using AI specifically for homework. There was no statistically significant difference in usage by gender, race and school levels although males showed a slightly higher tendency to use it than females and high school students reported more usage than middle school students; but these trends were not statistically significant. These results indicated that access to AI and its actual usage were similar across demographic groups.
In addition, we also explored how teacher’s policies associated with AI use. The results indicated that among those students whose teachers allowed them to use AI, 65% reported using it for homework. On the contrary, only 24% used AI while teachers did not allow it. The p-value from the chi-square test was <0.0001, which indicated school rules and teacher guidance greatly influenced student AI usage behavior. This suggested that students generally followed classroom expectations and that teacher guidance played a major role in whether students turned to AI in academic work.
PU and PRisk were standardized with mean 0 and SD of 1, with 0 representing a neutral position and positive values meaning more useful or more risky and negative values meaning less useful and less risky. Table 2 showed the difference between groups for PU and PRisk and their associated p-values from t-test or one-way ANOVA.
The mean PU for all students was close to 0, indicating a neutral attitude regarding AI usefulness. This was because while 50% of students felt AI helped improve their knowledge, only 27% felt AI helped improve their engagement. These differences indicated that students view AI as informative but not necessarily motivating in an academic setting.
Although the overall neutrality, subgroup analysis showed meaningful demographic differences in PU. Significant differences existed between males and females (males – positive PU; females – negative PU). Similarly, high school students rated AI as more useful compared to their middle school counterparts suggesting that older students may be better positioned to leverage AI tools for learning. Moreover, Asians reported more positive PU compared to other groups. In addition, the higher frequency of AI users was positively associated with higher PU score indicated that familiarity of AI tools built users confidence in AI usage. All of these group comparisons were statistically significant, demonstrating how different demographic groups perceived AI’s usefulness.
On the other hand, PRisk showed consistent trend among these students. The mean PRisk for all respondents was 0.41, suggesting that students believed that AI posed risks, such as misinformation, academic dishonesty, or ethical concerns. However, no significant differences were observed in any of the groups. This suggested that the concern was common across groups without demographic differentiation.
Survey Reliability
The reliability of the survey measures was assessed using Cronbach’s alpha to evaluate internal consistency. The PU yielded a Cronbach’s alpha of α = 0.85 classified as excellent reliability indicating that the items measuring PU (Knowledge (Q4) and Engagement (Q5)) were strongly interrelated and the scale was robust. The PRisk achieved α = 0.66, also indicating acceptable reliability. While not as strong as the PU scale, this level of reliability suggested that the PRisk items (Dishonest (Q6), Jobs (Q7), Misinformation (Q8), Privacy (Q9) and Harm (Q10)) were still consistent to support valid interpretation of students’ concerns regarding AI. Together, these results indicate that these scales were sufficiently reliable.
Discussion
Unlike most AI studies designed by academic researchers, our survey was developed by high school students based on TAM. This allowed us to design survey questions that reflect real student experiences – with schoolwork, learning habits, and everyday interactions with AI, rather than assumptions made by adult researchers. The findings provided helpful information for educational methods as well as future research directions.
These results were consistent with the recent literature surrounding AI use in K-12 schooling based on demographic factors. Males perceived AI as more useful than females, consistent with Venkatesh et al.,16 who found males score higher on PU in technology adoption. This may reflect socialization differences – boys were often encouraged in STEM and tool use from an early age. However, no gender gap in usage frequency, similar to the findings by Bouzar., et al.17 who found no significant gender difference in ChatGPT acceptance but reveal variations in usage patterns and concerns related to technological over-reliance and privacy. This indicated that students had similar access to AI, however, they did not value its benefits equally.
Our survey results also showed an association between school policy (whether teachers/schools explicitly allow AI) and student use of AI to do homework. It indicated school rules and teacher guidance greatly influenced student AI usage behavior. This matched what other studies reported – that students were more likely to change their behavior when rules were clearly set by adults in charge, rather than based on their own opinions or how easily they can access a tool18.
With the exception of these findings, the analysis determined that AI perceptions and AI usage were overwhelmingly associated. For example, frequent users of AI were statistically significantly more likely to say that AI was useful. This may indicate that frequent interaction with AI tools gives students a higher confidence level about AI being an educational tool or it may mean that students who already feel positively towards AI use it more often. This means that instead of strictly banning AI from the classroom, educators and schools can create opportunities for all students to engage with AI tools in safe and intentional classrooms across the curriculum, such as establishing classroom expectations for use, leveraging AI for fostering critical thinking about AI generated answers.
While more exploratory research is needed, the results of this preliminary study with 185 middle school and high school students suggest that these areas of perceived usefulness drive adoption through engagement with males, Asian and students in upper-grade levels. While these results should not be generalized beyond this setting, they act as a necessary springboard for investigating whether Grade 6-12 settings exhibit an AI literacy gap that exacerbates the digital divide. Based on these results, schools should establish standardized expectations for AI literacy across curricula – such as implementing a required lower grade tech module on ethical use of AI, prompt engineering, and bias detection, or integrating current events surrounding AI into all upper grade social studies courses. Similarly, teacher preparation courses should incorporate essential AI workshops to establish confidence in AI use for differentiation and required certification for completion to encourage implementation in curricula. Finally, students and teachers can collaboratively establish classroom expectations surrounding AI use to ease fears of dishonesty while still supporting learning intentions.
Limitations
Limitations of this study exist that require caution in interpreting the results. First, the sample was small and somewhat administrative, as a community survey was sent out, and students of Asian descent were oversampled. While findings were helpful to understand AI usage and perceptions among this age group of middle and high schoolers, they cannot be generalized to the US student population at large, meaning the findings of this study should be considered exploratory.
Second, this is a quantitative study based on survey research without open-ended questions, meaning researchers could not gain deeper insights into students’ more nuanced feelings with AI tools. Future research should employ open-ended survey items – to attain more profound interpretative insights regarding student sentiments and considerations.
Third, socioeconomic status, prior technology use, or educational resources used prior to AI implementation were not assessed in this study. These might be important factors associated with students’ behaviors.
Finally, self-report data included limitations regarding social desirability and recall bias.
Future Directions
Future research should involve larger and more diverse samples and explore more avenues to understand student sentiment better, such as additional data to be collected, including socioeconomic status, previous experience with tech or learning materials and open-ended questions to be included. Longitudinal research would also help explore how these perceptions evolve as AI tools become more embedded in educational environments.
Acknowledgement
We would like to express our gratitude to Dr. Marcus Rodriguez, an independent survey expert, and Mr. Nolan Donoghue from Viewpoint School for their invaluable guidance and feedback throughout this research.
Appendix
*Q1. How often do you use AI? Q4. Has AI improved your knowledge? Q5. Has AI improved your engagement in learning? Q6. Will AI use lead to more students engaging in academic dishonesty?

*Q2. Have you used AI to complete your homework? Q3. Do your teachers allow you to use AI for assignments? Q7. Will AI-driven systems make it harder for you to find and keep a job in the future? Q8. Will AI increase the spread of misinformation (e.g., deepfake videos)? Q9. Will AI lead to a loss of privacy? Q10. Will a superintelligent AI one day do things that are detrimental to humanity?
| Category | n | Frequent Use (%) | P-value | Homework Use (%) | P-value | |
| All | 185 | 43% | 43% | |||
| Gender | Males | 102 | 45% | 0.774 | 54% | 0.479 |
| Females | 83 | 41% | 44% | |||
| Race | Asian | 83 | 46% | 0.696 | 40% | 0.895 |
| Other | 50 | 36% | 46% | |||
| White | 52 | 45% | 45% | |||
| School | Middle School | 77 | 33% | 0.165 | 37% | 0.154 |
| High School | 108 | 50% | 56% |
*Frequent use was defined as daily or weekly use. P-values from Chi-square tests were used to compare the group difference.
| Category | PU Mean (SD) | P-value | PRisk Mean (SD) | P-value | |
| All | -0.04 (1.12) | 0.41 (0.458) | |||
| Gender | Males | 0.16 (1.17) | 0.009 | 0.42 (0.456) | 0.553 |
| Females | -0.29 (1.16) | 0.38 (0.461) | |||
| Race | Asian | 0.20 (1.17) | 0.008 | 0.47 (0.43) | 0.091 |
| other | -0.44 (1.10) | 0.29 (0.49) | |||
| White | -0.04 (1.21) | 0.41 (0.481) | |||
| School | Middle School | -0.57 (1.06) | <0.0001 | 0.35 (0.486) | 0.158 |
| High School | 0.35 (1.18) | 0.44 (0.433) | |||
| Usage | Frequent User | 0.43 (1.12) | <0.0001 | 0.36 (0.486) | 0.297 |
| Nonfrequent User | -0.40 (1.12) | 0.43 (0.453) |
*The scores were standardized with mean of 0 and standard deviation (SD) of 1. Positive scores indicated useful for PU and risky for PRisk. P-values were from t-tests when two groups were presented and from one-way ANOVA when race groups were compared. The usage was classified as daily or weekly use (frequent user) vs. others. Significant differences were observed across all groups for PU.
References
- UNESCO. (2023a). AI in education: Global trends. United Nations Educational, Scientific and Cultural Organization, (2023a). [↩]
- Nagelhout, R. Students Are Using AI Already. Here’s What They Think Adults Should Know. Harvard Graduate School of Education, 10 Sept.2024. [↩]
- Adair, Alexandra, U.S. High School Students’ Use of Generative Artificial Intelligence: New Evidence from High School Students, Parents, and Educators, College Board Research, October 2025. [↩]
- Alfnan, M. A., Dishari et al, S., Jovic, M., & Lomidze, K. Chatgpt as an educational tool: Opportunities, challenges, and recommendations for communication, business writing, and composition courses. Journal of Artificial Intelligence and Technology, 3(2), 60–68., 2023. [↩]
- Baidoo-Anu, D., & Owusu Ansah, L. (2023). Education in the era of generative artificial intelligence (AI): Understanding the potential benefits of ChatGPT in promoting teaching and learning. SSRN. https://doi.org/10.2139/ssrn.4337484. [↩]
- Freeman, Josh. Student Generative AI Survey 2025. Higher Education Policy Institute; Kortext, Feb. 2025. HEPI Policy Note 61. (UK). [↩]
- Li, F., & Mohammad, M. Artificial Intelligence and Education in China: Exploring the Future of Personalized Learning and Its Social Implications. Global Journal of Social Sciences and Humanities, 4(1), 216–222.2025. [↩]
- Huang, W., & Yu, W. (2025). Barriers to integrating artificial intelligence education: implications from five early adopters in South Korea. Computer Science Education, 1–24. [↩]
- Singh, K. and Hartley, B. (2024). The impact of AI on academic integrity policies. Active Learning in Higher Education, 25(2), 134–149. [↩]
- Smith, J. and Taylor, A. (2024). AI-driven plagiarism detection in academic writing. Journal of Educational Computing Research, 60(3), 223–239. [↩]
- Spirgi, L., Seufert, S., Delcker, J. and Heil, J. (2024). Student perspectives on ethical academic writing with ChatGPT: An empirical study in higher education. CSEDU 2024 – 16th International Conference on Computer Supported Education, Vol. 2, pages 179-186. [↩]
- Wang, R. and Lopez, C. (2024). Ethical challenges of AI in higher education assessment. Computer Applications in Engineering Education, 32(4), 315–329. [↩]
- Klarin, J., Hoff, E., Larsson, A., & Daukantaitė, D., Adolescents’ use and perceived usefulness of generative AI for schoolwork: exploring their relationships with executive functioning and academic achievement, Frontiers in Artificial Intelligence, 27 August 2024. [↩]
- Davis, F. D. (1989). Perceived usefulness (PU), perceived ease of use (PEOU), and user acceptance of information technology. MIS Quarterly, 13(3), 319–340. [↩]
- R Software, https://cran.r-project.org/bin/windows/base. [↩]
- Venkatesh, V., Morris, M. G., Davis, G. B., & Davis, F. D. (2003). User acceptance of information technology: Toward a unified view. MIS Quarterly, 27(3), 425–478. [↩]
- Bouzar. A., El idrissi. K., & Ghourdou. T. (2024). Gender differences in perceptions and usage of ChatGPT. International Journal of Humanities and Educational Research. 6(2). 2757-5403. [↩]
- Cialdini, R. B., & Goldstein, N. J. (2004). Social influence: Compliance and conformity. Annual Review of Psychology, 55, 591–621. [↩]


