
Abstract
Transportation supports global connections in the world. Urban planning requires much thought about transportation to ensure connectivity and simplicity within a city. However, what should also be considered is the environmental impact of their decisions. The research aims to understand how different types of transportation infrastructure impact carbon emissions. Each country was categorized by region, and the study looked into six different geographical regions. The ideal features for predicting the carbon emissions per capita were determined using random forest regression, a machine-learning model that creates many decision trees to make predictions. The carbon emissions per capita with the percentage of roads paved, the feature deemed most valuable to predicting carbon emissions per capita by the random forest regressor, in each region, was compared. With linear regression, a relationship was determined in each region to understand the variance from the line and the slope of the line, and to know how the data progresses as the values increase. The results show that there is a strong correlation between the carbon emissions per capita and the percentage of roads paved. The global R2 value was 0.173. When looking into specific regions, the correlation was much stronger. For example, the linear regression within Africa had an R2 value of 0.182. In this research, transportation infrastructure was proven essential to environmental factors. The study also indicates that the jobs of urban planners and road workers play a significant role in how a country approaches its carbon-neutral goals.
Keywords – Machine Learning, Linear Regression, Random Forest Regression, Carbon Emissions, Transportation, Infrastructure, Geography
Introduction
With the rapid growth of climate change, understanding the impacts of infrastructure on climate change is crucial. Infrastructure is changing rapidly to accommodate the growth of the population worldwide, and the development of infrastructure correlates with shifts in climate patterns1.
Rail transportation has been historically vital to global transportation. However, in recent years, the popularity of rail transportation as a form of human transportation has slowly decreased2. While it may not be as popular to the population, rail transportation provides a network of cargo transport that helps support manufacturing, industry, and consumer demand. Evidently, the omnipresence of rail transportation has helped increase global connectivity. Many countries are still working on projects to build more rail transportation for different uses, such as for manufacturing and civilian use. Rail transportation is often perceived as the most sustainable form of transportation. However, noise pollution, toxic emissions, and threats to wildlife are all possible effects of rail transport production3. However, the construction of rail transportation can differ significantly. It is important for rail transportation producers to take the known environmental conflicts of rail production into account when developing a strategy for their urban developmental plans4. As many countries develop rail transportation, their environmental policies should be considered to ensure the set goals align with their production plans.
The environmental consequences of road transportation are more significant than those of rail transportation due to its higher usage. Gasoline production and its combustion produce carbon emissions, which affect the global temperature via the greenhouse effect. Additionally, gasoline has Carbon and other dangerous contents that pollute the atmosphere5. Fuel has a large impact, but a modern solution to lowering carbon emissions is with the adoption of electric vehicles. This is expected to solve non-infrastructure-related issues. Fuel is the source of a large portion of carbon emissions from transportation, but traffic patterns also play a large role in the amount of Carbon emitted. There are multiple factors within traffic that can affect emissions, including geographical factors such as topography and social factors such as traffic congestion. The location and amount of road play a crucial role in the carbon emissions in the area6. An increase in the amount of roads was associated with an increase in the Air Quality Index in the area, showing an essential relationship between road length and air quality, and creating an important consideration for developing roads to prioritize the safety of citizens7. The environment should be prioritized alongside factors such as civilian safety in order to ensure the sustainability of transportation, allowing for transportation to be beneficial not only environmentally but socially as well8.
A country’s approach to its road care can play a crucial role in its carbon emissions. Road paving is an essential part of road transportation, as it allows for smoother and safer travel. The conditions of the road need to be closely monitored to ensure the safety of the population. With a rising population, more vehicles are on the road, and damage occurs more frequently. This leads to a higher need for more frequent paving9. While more frequent paving has many social benefits, there are environmental consequences of paving. In addition to the disadvantages of carbon emissions, paving materials such as asphalt and concrete are not environmentally friendly. Using both asphalt and concrete can lead to water pollution and create volatile organic compounds during production. Both road paving techniques are harmful, and using one over the other has no proven benefit10. There are new sustainable methods that are helping to reduce carbon emissions in the paving process, which supports a more sustainable future in road paving, including using crumb rubber asphalt to help recycle waste11. Maintaining roads is an important consideration when looking at transportation infrastructure.
Emphasis on infrastructure can vary between countries. Countries that are considered “developing” may not have as much built-up infrastructure to support transportation as developed countries. The United States is known for its very strong transportation infrastructure. It provides plenty of roads for its large population to travel. The strength of the economy supports this strength in infrastructure. The country invests over 60 billion dollars into its transportation infrastructure and, in return, gets money back from users of public transportation and highways12. The European Union has a similar story. As most countries are more developed, countries in the EU gain a lot in their economy due to transportation13. In Ireland, a member of the EU, the increase in GDP has driven a significant increase in carbon emissions, which is driven in conjunction with population, energy usage, and GDP14. Italy, another member of the European Union, has shown that economic and trading strength can cause a change in carbon emissions15.
For countries that are less “developed”, the importance of transportation infrastructure still exists. Even in rural countries, transportation infrastructure supports people living in more isolated locations16. The government has a significant role in transportation infrastructure. Of course, the government makes major decisions in transportation production, but government quality can have a positive impact on the efficiency of transportation within a country17. The development of countries has also shown negative effects on carbon emissions. In the Zambezi River basin, which includes the countries of Zambia, Malawi, and Mozambique, the need for carbon reduction is still noticeable. There are policies within the countries that promote carbon reduction. However, the demand in these countries for fossil fuels is increasing due to a depletion of the fuel in the area, raising the price of production18. Additionally, economic instability and war can cause issues with carbon emissions. For example, with political focus on the Russo-Ukrainian war, the agenda of nearby nations has shifted away from carbon emissions, which has resulted in a shift of emphasis from lowering carbon emissions19. Transportation infrastructure and carbon emissions all have an origin rooted in the government and economic strength of the country.
Transportation Infrastructure correlates with carbon emissions. However, some aspects of transportation infrastructure may have a more direct effect on emissions than others. By determining these aspects, a more effective change can be made to transportation infrastructure production to assist countries in reaching their carbon neutrality goal. By looking at a global scale, evaluating how different regions are developed with respect to transportation infrastructure in addition to their carbon emission statistics, was beneficial in determining a correlation. Machine learning models such as the random forest model have benefits for predicting the impact of transportation infrastructure on carbon emissions. Analyzing the data through exploratory data analysis, in addition to using a linear regression analysis, also helped to visualize relationships and trends.
Related Works
Many research articles focus on the link between transportation infrastructure and sustainable development, as it can often answer many unrelated questions. The field, however, can be broad, so research may focus on a specific sector20. Population can be pinned as the biggest reason for an increased carbon footprint, and the carbon source comes from transportation. Additionally, transportation produces greenhouse gases, and many other air pollutants that are often overlooked, such as sulfur oxides and nitrogen oxide21.
A study22 looks into China’s efforts to lower its carbon emissions, despite their political and economic conditions that push back on its efforts. Even in their attempts to lower their carbon footprint, they still have the largest amount of carbon emissions due to their higher demand for transportation to support their large population. The findings on China’s carbon emissions show why it is better to evaluate carbon emissions per capita. Per capita emissions show the impact per person. China has a large carbon footprint, but it needs to be larger than a country with a smaller population to help accommodate more people and more infrastructure. The study shows that every independent variable that relates to transportation infrastructure has an impact on carbon emissions. The coefficient for larger cities (0.0961) was larger than that of smaller cities (0.0235), indicating that higher levels of infrastructure correlate with more carbon emissions.
In a study23 conducted by Bajracharya and Bhattarain in Nepal in response to a gasoline embargo from India, using electric vehicles and increasing public transport ridership limits the amount of gasoline produced and significantly cuts emissions. This idea was helpful in Nepal when responding to a trade embargo from India on gasoline, and searching for substitutes for gasoline. Their solution was developed by using existing data to determine possible solutions that could be utilized, as well as which solutions would leave the most positive impact. The data collection was done using existing data from other sources due to limitations in data collection. This study used visualization techniques that worked with the data availability. For the purpose of this study, this was adequate for answering the research question, which aimed to determine solutions. Because the previous study had more data availability, a linear regression analysis was more appropriate.
Results
To evaluate the differences in carbon emissions among different countries, the first comparison was to understand the progression of other countries with similar characteristics, such as population. This data is also crucial for determining the impacts of transportation infrastructure later on to determine how transportation infrastructure impacts the changes in carbon emissions.

The eight countries included in Figure 1 all come from different regions of the world, but what is shown is that these countries can be grouped by their geographical area, as their carbon emissions are closer together. Ireland and Croatia, both European and developed countries, have the highest emissions, while Liberia and Mauritania, two African countries that are also some of the least developed countries, are at the bottom in emissions. The countries are all tied to one factor, but multiple other factors cause variance within the data. This shows that we need to investigate more than just one part of the data, we need to look at all features of the data together in order to understand the bigger picture.
From here, the datasets were merged on Country. This combined all the data from all datasets into one dataset, with the Country sorting the data into the respective rows. Then, any rows that had missing data were omitted from the dataset, since they would skew the results. This was justified because the study was not dependent on taking into account every country, but instead looked at countries based on their regions and policies. Any outliers were kept in the dataset as the data was still important for the study. When looking at the scope of carbon emissions, the difference in countries such as China and the United States is significant compared to that of Pacific Island countries, so outliers must be taken into account as well.
After merging the Carbon Emissions Dataset with the Transportation Infrastructure and Population Dataset, two new metrics were created, which include roads per person and railways per person. Each metric was used to determine if the mode of transportation correlates with carbon emissions. Two figures were created comparing these metrics to Carbon Emissions per capita.
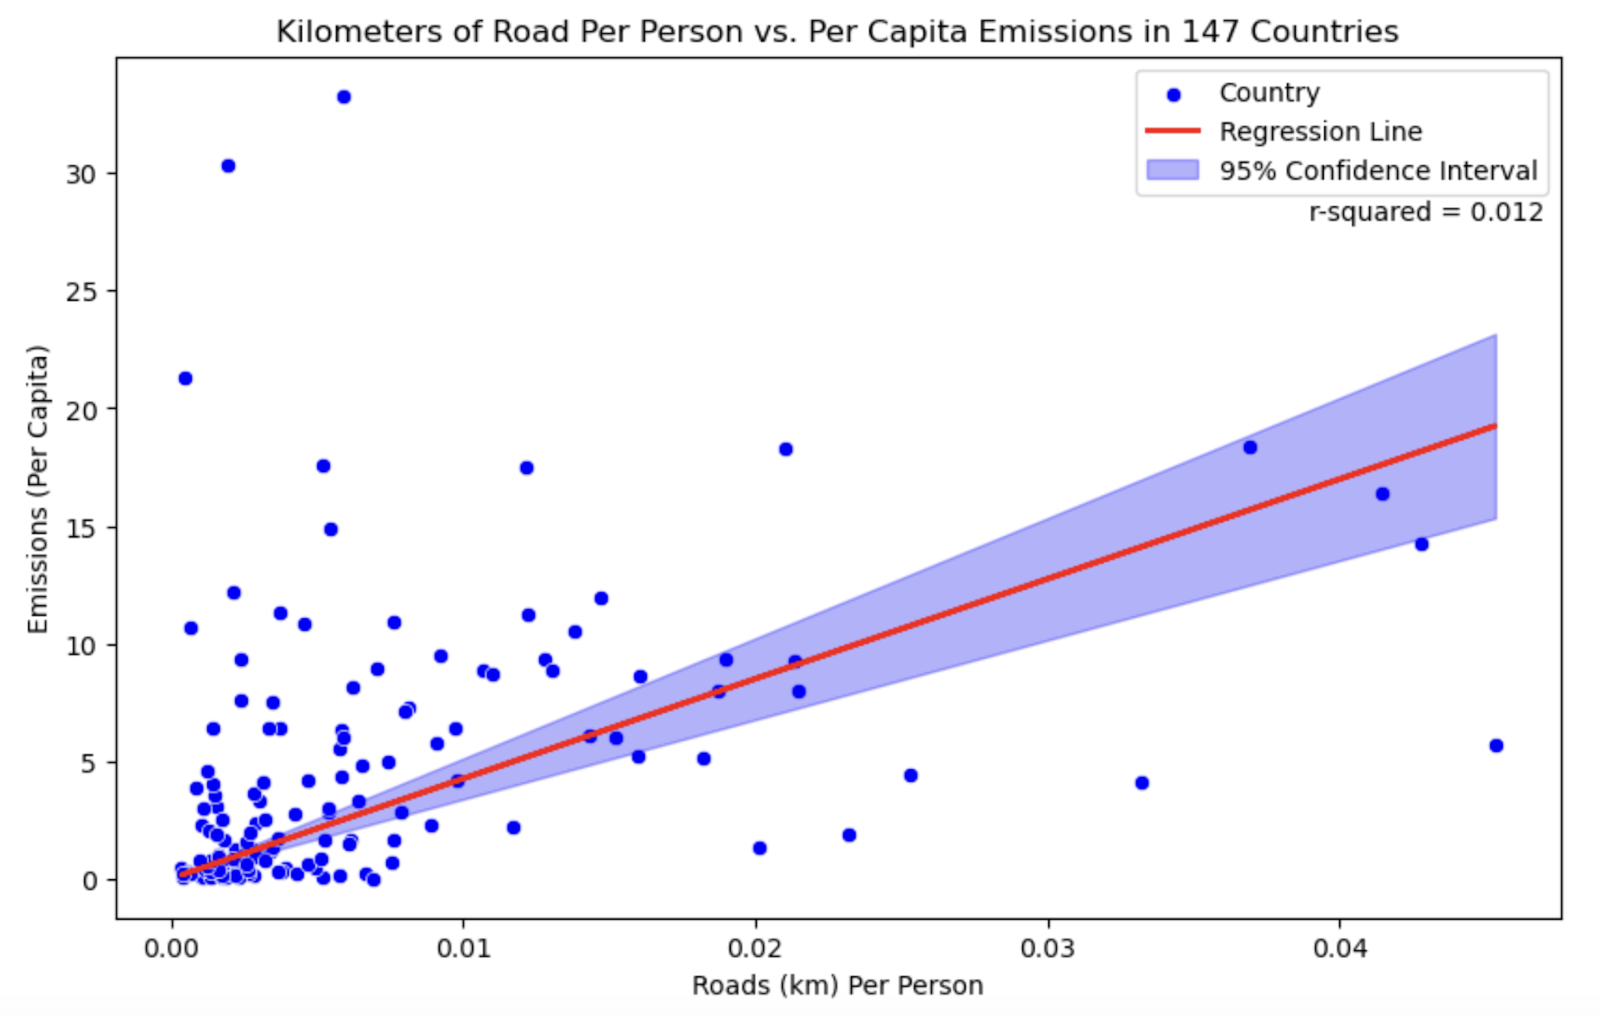
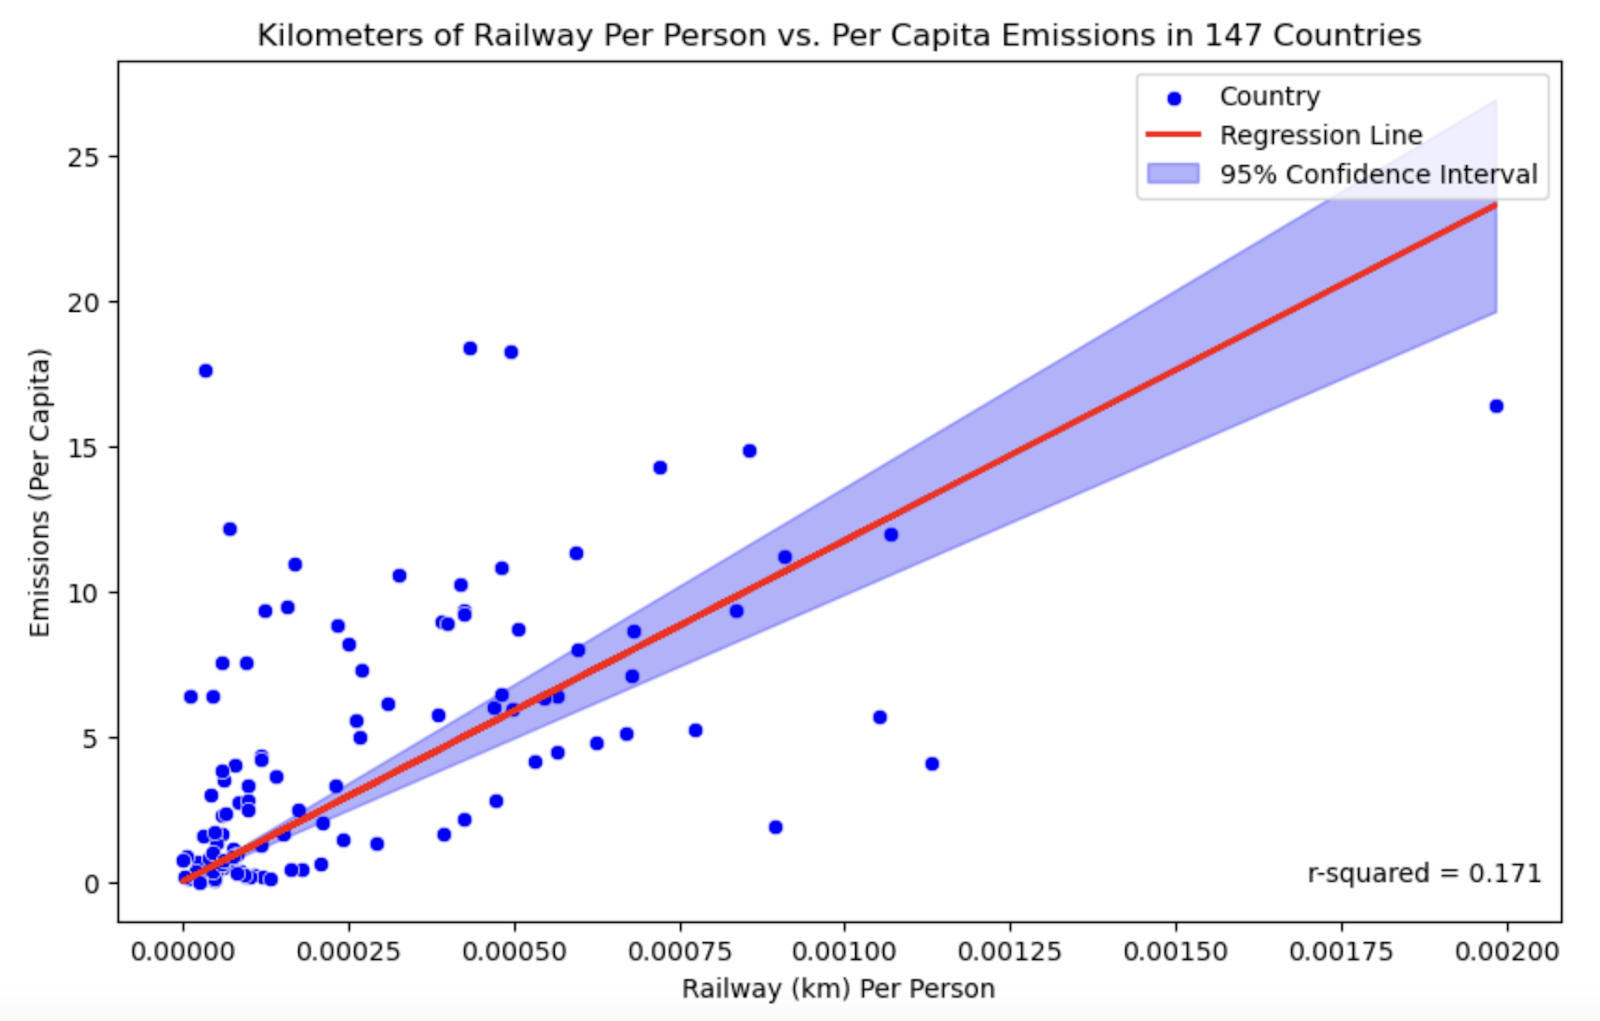
Figures 2 and 3 both show a linear trend in the data. For Figure 2, countries with ∼0 Roads Per Person also have ∼0 Carbon Emissions Per Capita. However, there is more variance in the data as the values start to increase. For example, four countries have Carbon Emissions Per Capita at about 18. But all four of these countries have very different road lengths per person, which shows how there are different factors contributing to the differing carbon emissions per capita. On the contrary, there is more of a linear relationship between the data in Figure 3. The data has little variance within the data, but the rest of the countries all seem to fall within a range and form a linear relationship. Figures 2 and 3 both show that there is a relationship between roads/railways, population, and carbon emissions. However, it is important to understand if there is another feature that may have a relationship with less variance.
A Random Forest Regressor was created, and feature importance was used. The aim was to identify what features were most important in determining the Per Capita Emissions. With the information from Random Forest Regression analysis, the feature that is determined to have the largest importance in determining per capita emissions will be taken into further analysis. A random forest regressor is sufficient to determine the importance of features for the purpose of the study.
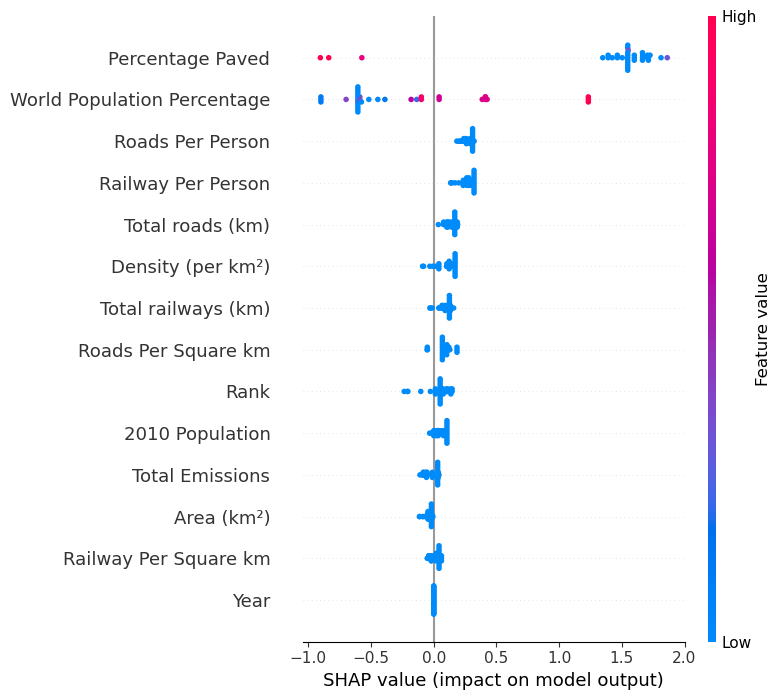
The model used 100 decision trees. This was considered a good value, as increasing the number of decision trees created little difference in the results, but did impact the time required to complete the analysis. When there were 300 decision trees, the importance of Percentage Paved increased by 0.01, while World Population Percentage Decreased by 0.01. The top three most important features for determining per capita emissions include World Population Percentage, Percentage Paved, and Roads Per Person. Total Emissions and 2010 Population being not as useful also makes sense because Per Capita Emissions require both values to be determined, so one can’t stand on its own. What is revealed to be one of the most important metrics is the percentage Paved. Roads and Railways are also shown to be important, but not as much as the percentage of roads paved. Road paving is a reflection of a country’s upkeeping of transportation infrastructure, so their ability to consistently pave roads reflects dedication to transportation infrastructure, which also requires strength in the economy. Countries were grouped by their geographical region to understand regional differences in infrastructure and carbon emissions. This is because geographical regions often have similarities in their topography and biomes, in addition to often being under similar policies.
The top three most important features for determining per capita emissions include World Population Percentage, Percentage Paved, and Roads Per Person. Total Emissions and 2010 Population being not as useful also makes sense because Per Capita Emissions require both values to be determined, so one can’t stand on its own. What is revealed to be one of the most important metrics is the Percentage Paved. Roads and Railways are also shown to be important, but not as much as the percentage of roads paved. Road paving is a reflection of a country’s upkeep of transportation infrastructure, so its ability to consistently pave roads reflects dedication to transportation infrastructure, which also requires strength in the economy.
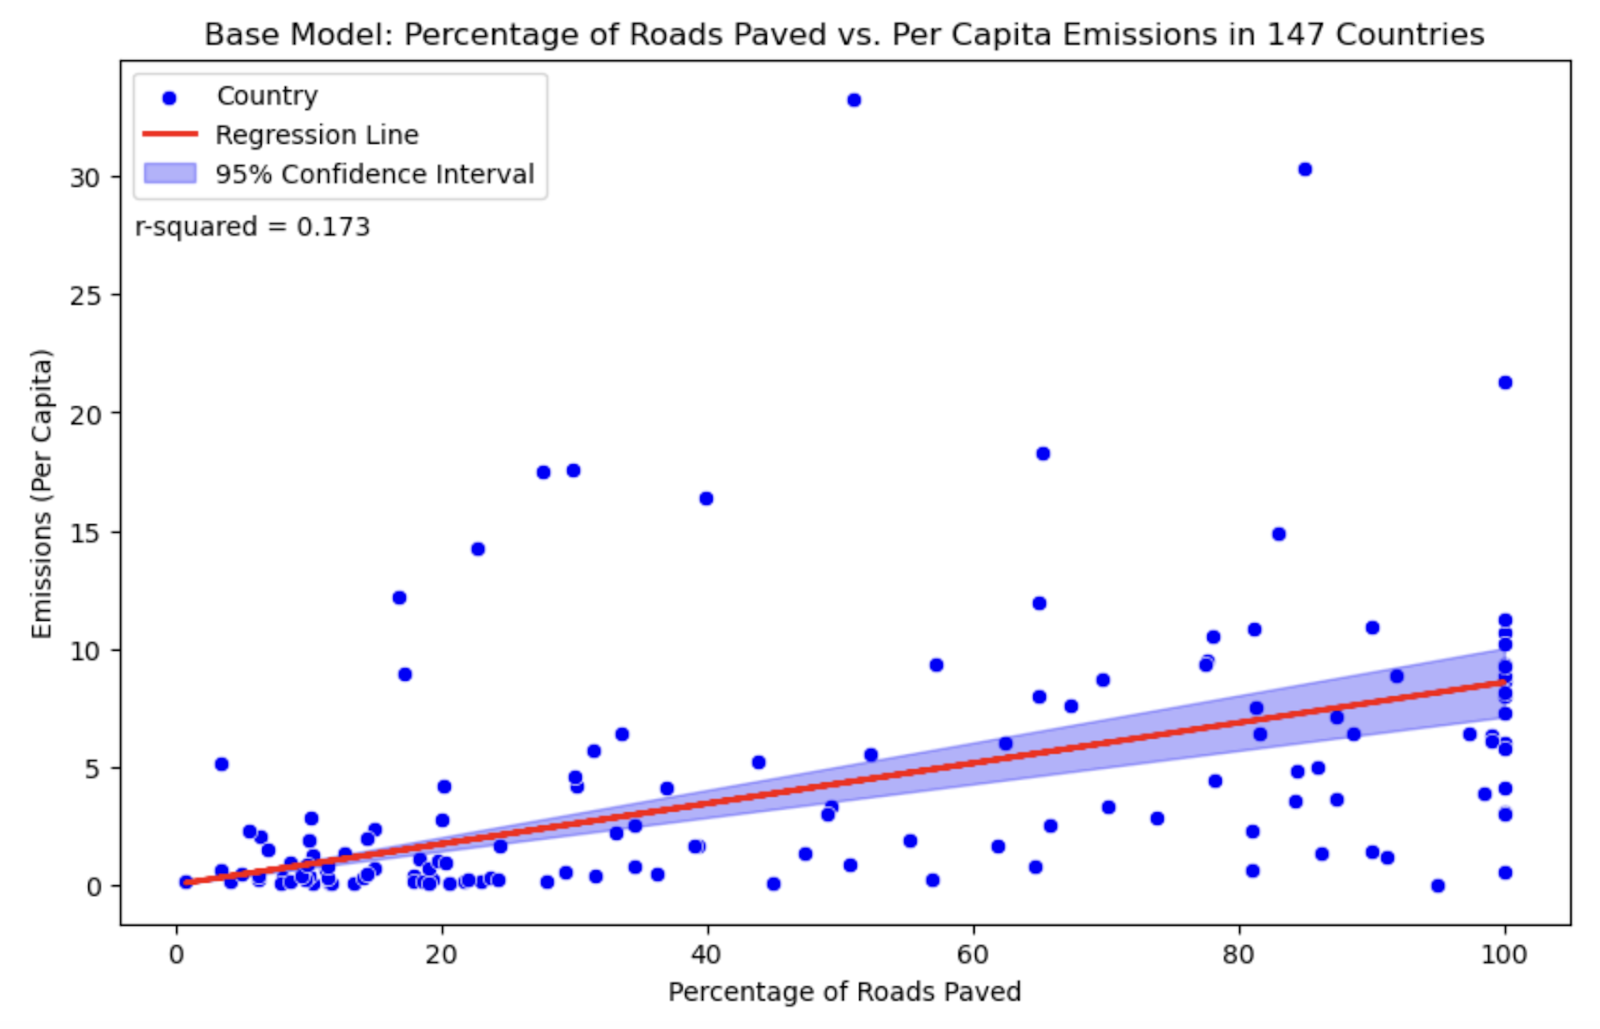
Figure 5 studies the global correlation between carbon emissions per capita and the percentage of roads paved. An R2 value of 0.186 indicates that the model does not fully fit the data. However, analyzing by region might indicate regional differences in these correlations. This model was used for comparison to see if the data is more correlated by region.

Figure 6 identifies that the higher the percentage of paved roads a country has, the more likely its emissions per capita increase. Importantly, visual analysis of the four regions in Figure 6 reveals that each has issues that make them difficult to further analyze. North American and Asian data have more variance, which could be due to the larger economic differences across the region. For example, the United States and Canada have more development and are going to have more emissions per capita than countries in Central America. With only three data points in Oceania, there are not enough countries within the region to study the trend further. South America demonstrates a linear relationship, with most of the countries being within 20-40% of roads paved and Carbon Emissions Per Capita at less than 5. There isn’t as much data in South America to study either, so the focus went to Africa and Europe.
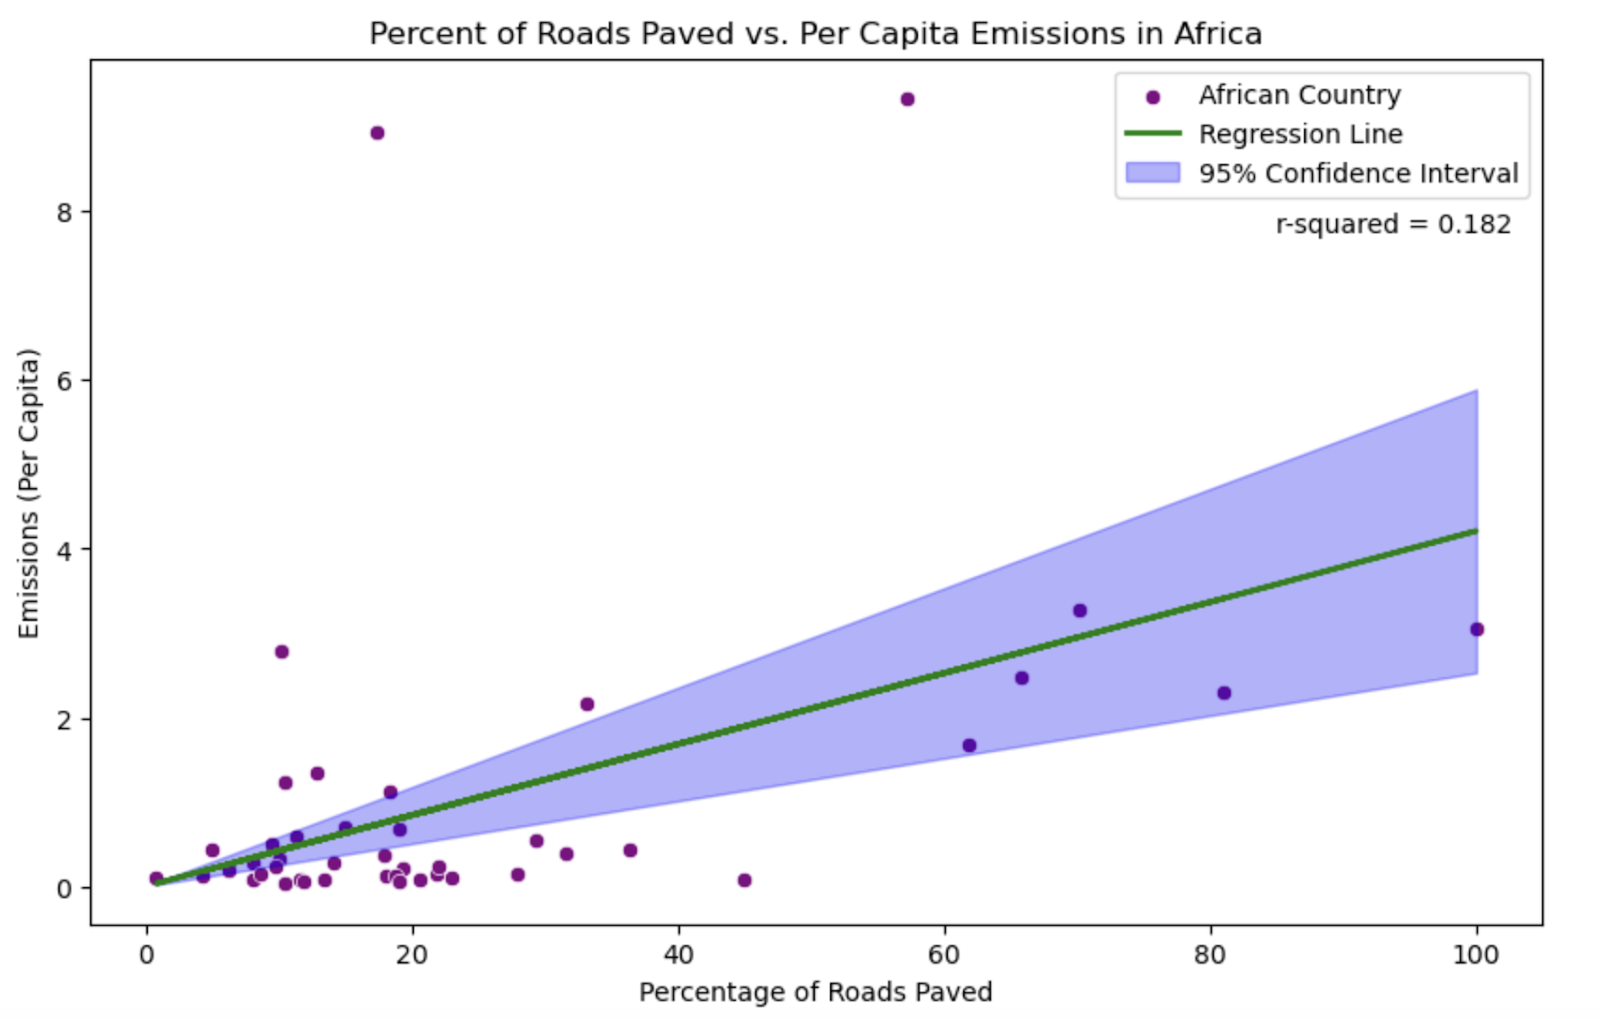
Figure 7 shows that the majority of the data in Africa is clustered in the bottom left corner, signifying less development in the majority of African nations. Africa has some of the least developed countries in the world, and the continent is the least developed compared to the other five continents studied. Roads in Africa are not of the best quality, and the majority of the population does not have access to roads of good quality. The materials used were inadequate for proper road paving in the region24. Additionally, carbon emissions in Africa increase with economic growth. Because most of the countries in Africa are very underdeveloped, their carbon emissions are still very low. In countries such as South Africa and Libya, their stronger development contributes to their higher carbon emissions25. Two countries were anomalies: Libya, with ∼60% paved, and South Africa, with 20% paved, both having high emissions per capita. Another notable anomaly is Mauritius, which is the only African country with 100% of roads paved. An R2 value of 0.318 shows that the model is a better fit to regional data.
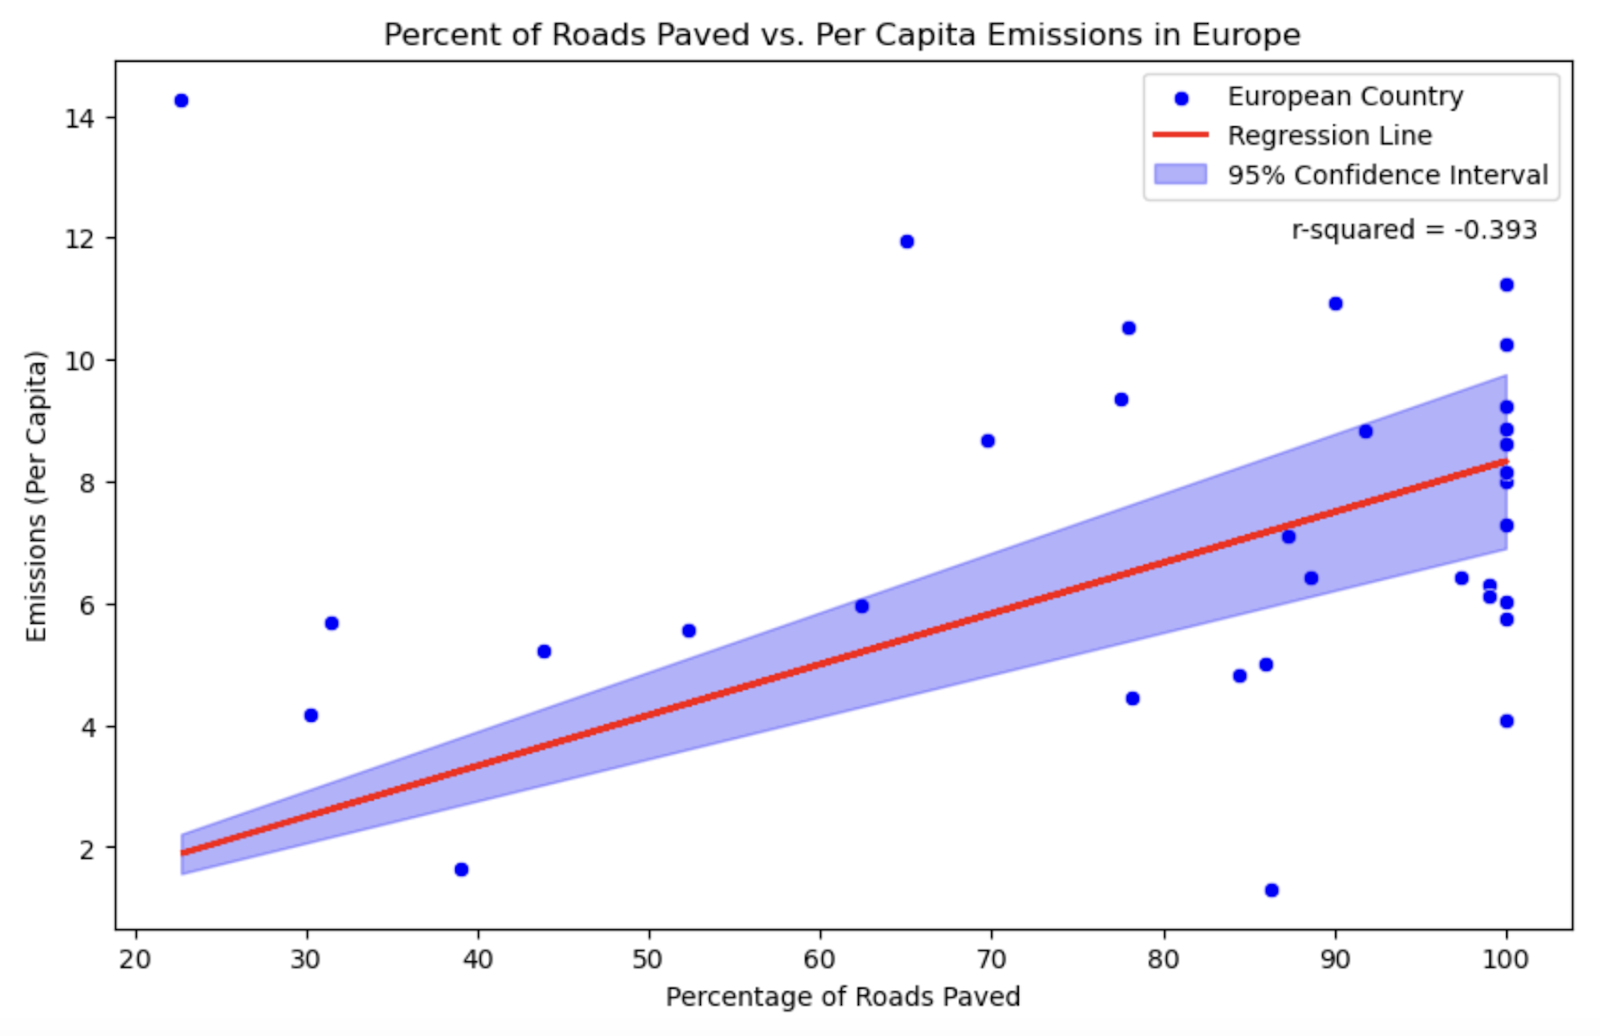
Figure 8 shows high levels of European Infrastructure, as 12 of the countries have nearly ∼100% of roads paved. However, the countries cover a larger range of Carbon Emissions Per Capita, with a difference of 8 from the lowest to the highest. The country with 100% and the lowest Carbon Emissions per Capita is Latvia, and the highest is the Czech Republic. Both countries are members of the European Union. The European Union has worked together to lower carbon emissions. The European Union has a strong trade network between the member countries and has created policies to aim for climate neutrality by 2050. The policies of the organization have had an overall benefit on both economic and environmental strength26. Financial performance is not only an indicator, but a contributing factor of strong transportation infrastructure, especially the percentage paved. One other country stands out as it differs drastically from the rest in the top left corner. Not only does it have the highest Carbon Emissions per capita, but also the lowest percent of roads paved. That country is Estonia. The transportation sector in Estonia uses Carbon in large amounts, and carbon emissions are emitted heavily within this sector. The sector is the only one without the possibility of reaching carbon neutrality by 204027. This is evidence of Estonia’s rise in infrastructure strength, which often increases carbon emissions per capita, although the emissions have decreased over time. Estonia is also a member of the European Union and borders Latvia, which statistically has the best road conditions and the lowest Carbon Emissions Per Capita out of all the other countries that fall within that range. Furthermore, a negative R2 value shows that the model does not fit the data as well. However, because the majority of the data has 100% of roads paved, other factors are going to have more weight on carbon emissions.
Discussion
Our research determines a correlation between transportation infrastructure and carbon emissions per capita. This correlation varies between regions, but each region shows a linear relationship with a varying slope, as seen in Figure 7 and Figure 8. The regions are often clustered together, showing the similarities of infrastructure within each continent, although the clusters may be more separated. The most likely explanation for this is due to differences in geography.
Our research shows that strength in transportation infrastructure, specifically a higher percentage of paved roads, more roads per person, and more railways per person, are all correlated with higher carbon emissions. Both strong transportation infrastructure and high carbon emissions per capita result from economic strength, and without any renewable energy or other policies to prevent carbon emission increases, both infrastructure and carbon emissions will progress. The percentage of paved roads represents the level of infrastructure upkeep that a country invests in roads. The technology that is used for this is costly to the environment due to the emissions that it produces. Moreover, having more roads and more railways also requires carbon-emitting technology so that countries can continue producing this infrastructure.
The research was limited due to the data being 20 years old. The aging of the data has led to differences in the current state of these relationships. This affects the slope of the linear regression plots, as the carbon emissions per capita have changed due to other factors such as manufacturing and energy. Policies have shown progress in lowering carbon emissions. While newer data might alter the slope of the line and the data values, the conclusion would still persist. The differences in newer data would be correlated with the adoption of electric technology. However, this technology is still not dominant within infrastructure production. In addition to these limitations, some of the countries were missing data, and other countries were fully excluded from the dataset. This could have created more precision within the study, and allowed for a deeper analysis. However, the relationship between the two is still apparent among specific countries.
This research shows the correlation of current events with transportation infrastructure and carbon emissions. Large shifts in carbon emissions data and transportation infrastructure data were correlated with what can be pinned as current events within the countries that were studied. As exhibited in Figure 1, studying the carbon emissions over time, events such as wars, economic regression, and political fallout are often correlated with changes in carbon emissions. Current events impact both carbon emissions and transportation infrastructure, as well as economic strength. This critical focus helps to point to current events and the economy as confounding variables within the study, as they both cause shifts in transportation infrastructure and carbon emissions.
The research impacts developing future policies and can help pave the way to a sustainable transportation infrastructure, leaving a powerful impact on future urban planning projects. This research can help reform how urban planners approach their work and determine how to create sustainability within transportation projects. Even with completed projects, ensuring sustainability in road paving can help lower carbon emissions per capita. Urban planning should require this thought for global carbon neutrality to be achieved, as carbon neutrality is a global effort that every country needs to pitch in to create a healthy future for our world.
Methods
With this correlational research study, we aimed to understand how a country’s transportation infrastructure can impact carbon emissions, which is done by comparing global carbon emissions statistics with the transportation infrastructure within each country. The governmental, economic, and geographical factors contributing to transportation infrastructure are evaluated to understand the correlation between transportation infrastructure and carbon emissions.
A study28 conducted by Taboada and Han showed that using data analysis techniques such as Exploratory Data Analysis (EDA) and Data Envelopment Analysis (DEA) on rail transportation can help improve the efficiency of city planning concerning climate goals. This study helps to show the importance of understanding rail transportation patterns. London was a city used in this study, and the investigation was crucial in understanding how ridership played into carbon emissions within the city. The methods used in this article helped determine how we should evaluate the data. The research shows how EDA helps to understand correlations within data, as well as identify relationships within data. EDA also helps with backup solutions.
Exploratory data analysis was a helpful approach to understanding the usage and development of transportation, as using the right dataset allows you to effectively visualize relationships within ridership and infrastructure data. Data analysis is also effective in supporting urban planners in creating infrastructure changes, as it helps to understand the needs of users29. Using the packages pandas and matplotlib in Python, we loaded three datasets containing the relevant information. The first dataset detailed carbon emissions statistics from 1750. The Global Carbon Project provided the data and then compiled it into a file that was distributed30. The second dataset detailed the transportation infrastructure by country. It included information on road infrastructure and rail infrastructure. For our research, we only utilized three features from the dataset: length of road, length of railway, and percentage of road paved. The UN-Habitat provided the data31. The final dataset was of world population statistics. The data includes density and size information in addition to population data. The data was found on Kaggle but sourced from worldpopulationreview.com and the World Population Prospects of the United Nations32. All datasets were looked at from 2010 to match the date of the transportation infrastructure dataset. The other datasets include accurate information from this year. All countries with missing data points were omitted from the study in order to ensure that each country could be equally assessed.
We developed a Random Forest Model to understand the most important features in predicting carbon Emissions. Random forest models create multiple decision trees and produce multiple outcomes to reach a single result. With this model, we aim to determine which features of the data are most vital in determining the carbon emissions. We found one piece of infrastructure data that has the largest impact on carbon emissions per capita. Random Forest Regression was considered the best model for this due to its strength in creating predictions, taking into account all variables. By creating multiple decision trees, the model determines feature importance more accurately. By comparison, neural networks create predictions by interpreting patterns. Because there is a finite amount of data, due to a limited number of countries, a neural network would not be able to effectively predict the important features since there are no patterns to interpret. The model was tuned accordingly in order to prevent overfitting. This was done using a grid search, which took a list of possible values to find the ideal number of trees to be used.
Linear Regression was used to understand the data trends and detect any anomalies within the data. Linear regression fits a line to the data to understand the relationship. Using this analysis helps to create a prediction of the value on one axis depending on the other value. When fitting the line, two essential aspects will be the slope of the line and the variance of the data from the line. The slope of the line will help to show whether one part of the data increases at a similar rate to another or not. This will help to understand if both variables are proportionate to each other when one value increases. The variance from the line shows if the variables are proportionate. If all data points are further from the line, there is less of a relationship and the data is more random, proving that the relationship has little significance. This is important in showing how infrastructure and emissions have a relationship.
Acknowledgements
I would like to thank Nigel Doering for his assistance with the research. He was my mentor throughout the research and assisted me by providing guidance in data analysis and writing.
References
- M. W. Doyle and D. G. Havlick, Infrastructure and the environment, Annual Review of Environment and Resources, 34 (2009), pp. 349–373. [↩]
- T. H. Oum, W. G. Waters, and C. Yu, A survey of productivity and efficiency measurement in rail transport, Journal of Transport economics and Policy, (1999), pp. 9–42. [↩]
- J. Milewicz, D. Mokrzan, and G. M. Szymański, Environmental impact evaluation as a key element in ensuring sustainable development of rail transport, Sustainability, 15 (2023), p. 13754. [↩]
- A. Amiril, A. H. Nawawi, R. Takim, and S. N. F. A. Latif, Transportation infrastructure project sustainability factors and performance, Procedia-Social and Behavioral Sciences, 153 (2014), pp. 90–98. [↩]
- J. Romm, The car and fuel of the future, Energy policy, 34 (2006), pp. 2609– 2614. [↩]
- M. Condurat, A. M. Nicuţă, and R. Andrei, Environmental impact of road transport traffic. a case study for county of iaşi road network, Procedia Engineering, 181 (2017), pp. 123–130. [↩]
- H. Demirel, E. Sertel, S. Kaya, and D. Z. Seker, Exploring impacts of road transportation on environment: a spatial approach, Desalination, 226 (2008), pp. 279–288. [↩]
- D. D. Wang, Assessing road transport sustainability by combining environmental impacts and safety concerns, Transportation Research Part D: Transport and Environment, 77 (2019), pp. 212–223. [↩]
- A. Shtayat, S. Moridpour, B. Best, A. Shroff, and D. Raol, A review of monitoring systems of pavement condition in paved and unpaved roads, Journal of Traffic and Transportation Engineering (English Edition), 7 (2020), pp. 629–638. [↩]
- P. Inyim, J. Pereyra, M. Bienvenu, and A. Mostafavi, Environmental assessment of pavement infrastructure: A systematic review, Journal of environmental management, 176 (2016), pp. 128–138. [↩]
- W. Hu, X. Shu, and B. Huang, Sustainability innovations in transportation infrastructure: An overview of the special volume on sustainable road paving, Journal of cleaner production, 235 (2019), pp. 369–377. [↩]
- G. Duranton, G. Nagpal, and M. Turner, Transportation infrastructure in the us, tech. rep., National Bureau of Economic Research, (2020). [↩]
- E. Cigu, D. T. Agheorghiesei, A. F. Gavrilut, ă, and E. Toader, Transport infrastructure development, public performance and long-run economic growth: a case study for the eu-28 countries, Sustainability, 11 (2018), p. 67. [↩]
- T. O’Mahony, Decomposition of ireland’s carbon emissions from 1990 to 2010: An extended kaya identity, Energy Policy, 59 (2013), pp. 573–581. [↩]
- C. Magazzino, The relationship between co2 emissions, energy consumption and economic growth in italy, International Journal of Sustainable Energy, 35 (2016), pp. 844–857. [↩]
- N. Kaiser and C. K. Barstow, Rural transportation infrastructure in low and middle-income countries: a review of impacts, implications, and interventions, Sustainability, 14 (2022), p. 2149. [↩]
- A. P. Kyriacou, L. Muinelo-Gallo, and O. Roca-Sagalés, The efficiency of transport infrastructure investment and the role of government quality: An empirical analysis, Transport Policy, 74 (2019), pp. 93–102. [↩]
- C. Arndt, P. Chinowsky, C. Fant, S. Paltsev, C. A. Schlosser, K. Strzepek, F. Tarp, and J. Thurlow, Climate change and developing country growth: the cases of malawi, mozambique, and zambia, Climatic Change, 154 (2019), pp. 335–349. [↩]
- Sasmoko, H. u. R. Khan, H. Jambari, M. Imran, S. Khan Musah, and K. Zaman War psychology: The global carbon emissions impact of the ukraine-russia conflict, Frontiers in Environmental Science, 11 (2023), p. 1065301 [↩]
- L. Wang, X. Xue, Z. Zhao, and Z. Wang, The impacts of transportation infrastructure on sustainable development: Emerging trends and challenges, International journal of environmental research and public health, 15 (2018), p. 1172. [↩]
- Y. Van Fan, S. Perry, J. J. Klemeš, and C. T. Lee, A review on air emissions assessment: Transportation, Journal of cleaner production, 194 (2018), pp. 673–684. [↩]
- R. Xie, J. Fang, and C. Liu, The eflects of transportation infrastructure on urban carbon emissions, Applied Energy, 196 (2017), pp. 199–207. [↩]
- I. Bajracharya and N. Bhattarai, Road transportation energy demand and environmental emission: A case of kathmandu valley., Hydro Nepal: Journal of Water, Energy & Environment, (2016). [↩]
- A. Campbell, Federal road management for sub-saharan african nations: A nigerian case study, Master’s thesis, University of Waterloo, (2009). [↩]
- O. E. Olubusoye and D. Musa, Carbon emissions and economic growth in africa: are they related?, Cogent Economics & Finance, 8 (2020), p. 1850400. [↩]
- A. Dechezleprêtre, D. Nachtigall, and F. Venmans, The joint impact of the european union emissions trading system on carbon emissions and economic performance, Journal of Environmental Economics and Management, 118 (2023), p. 102758. [↩]
- A. Volkova, E. Kisel, O. Grünvald, A. Veske, S. Sukumaran, and J. Purga, Estonian energy roadmap to carbon neutrality, International Journal of Sustainable Energy Planning and Management, 38 (2023), p. 30. [↩]
- G. L. Taboada and L. Han, Exploratory data analysis and data envelopment analysis of urban rail transit, Electronics, 9 (2020), p. 1270. [↩]
- N. P. Kozievitch, T. M. Gadda, K. V. Fonseca, M. O. Rosa, L. C. Gomes Jr, and M. Abkar, Exploratory analysis of public transportation data in curitiba, in Anais do XLIII Seminário Integrado de Software e Hardware, SBC, (2016), pp. 1656–1667. [↩]
- R. M. Andrew and G. P. Peters, Emissions by country, (2021). [↩]
- UNHABITAT, World – transport infrastructure. [↩]
- S. Banerjee, World population dataset, (2022). [↩]
 Using Public Bioinformatics Resources")

