
Abstract
Hypertension, or high blood pressure, is the leading cause of cardiovascular and cerebrovascular diseases. Non-invasive and accurate blood pressure (BP) tracking can potentially improve hypertension management. In this study, we present a deep learning (DL) model that can estimate systolic and diastolic blood pressure (SBP and DBP) values through photoplethysmogram (PPG) and electrocardiogram (ECG) waveforms, which can be measured by wearable sensors. The model was trained and validated on data obtained from the publicly available MIMIC III dataset. Testing the models with an independent set demonstrated good accuracy, with mean errors (MEs), standard deviations (STDEVs), and mean absolute errors (MAEs) comparable to or better than other machine learning (ML) models using the same dataset. Measured by MAEs, the presented DL model with combined PPG and ECG input outperformed all the other models. The DL model was further validated by testing using a prototype wrist device built with a low-cost PPG sensor. Testing results demonstrated good correlation with a commercial home-use BP monitor across 90 measurements from three human subjects. These findings highlight the potential of the proposed DL model for reliable BP prediction, enabling cuffless, continuous, and automatic BP monitoring.
Introduction
Hypertension risks and management
Hypertension, also known as the “silent killer”, is the major cause of cardiovascular and cerebrovascular diseases. If left untreated, it can cause major health issues such as heart attacks, strokes, vision loss, and kidney damage. Over the past 20 years, the number of people with hypertension worldwide has grown from 650 million to 1.3 billion, according to a recent report by the World Health Organization (WHO)1. Furthermore, due to the lack of symptoms, nearly half of those afflicted are unaware of their conditions. Given that hypertension can be effectively treated with affordable and safe medications, the WHO recommends reducing related health risks through effective management, including early detection and regular blood pressure (BP) monitoring.
Blood pressure measurements
In clinical settings, BP is commonly measured through the auscultatory method using an inflatable cuff and a stethoscope placed over the brachial artery2. A measurement begins with inflating the cuff to block blood flow, followed by gradually deflating the cuff. The systolic blood pressure (SBP) is recorded when blood flow sounds (Korotkoff sounds) return, indicating the peak pressure during cardiac contraction. When the sounds disappear again, the pressure reading corresponds to the diastolic blood pressure (DBP), representing the lowest pressure between heartbeats. BP is usually recorded in millimeters of mercury (mm Hg). The American Heart Association defines hypertension as a condition when SBP exceeds 130 mm Hg or DBP exceeds 90 mm Hg.
For most home-use automated BP monitors, the oscillometric method is employed, which is a different cuff-based technique. In this method, a pressure transducer detects oscillations from arterial pulsation during cuff deflation2. The amplitude of these oscillations begins to rise near SBP, peaks near the mean arterial pressure, and decreases when pressure falls below the DBP.
In contrast, arterial blood pressure (ABP) is measured invasively by inserting a catheter into the artery. Real-time waveform of pressure is measured by a transducer, providing the most accurate BP readings and the calculated SBP/DBP values. While cuff-based approaches are standard methods for clinical and home use, ABP measurements are typically adopted for intensive care units (ICUs) and surgical settings which require higher precision.
Continuous blood pressure monitoring with cuffless methods
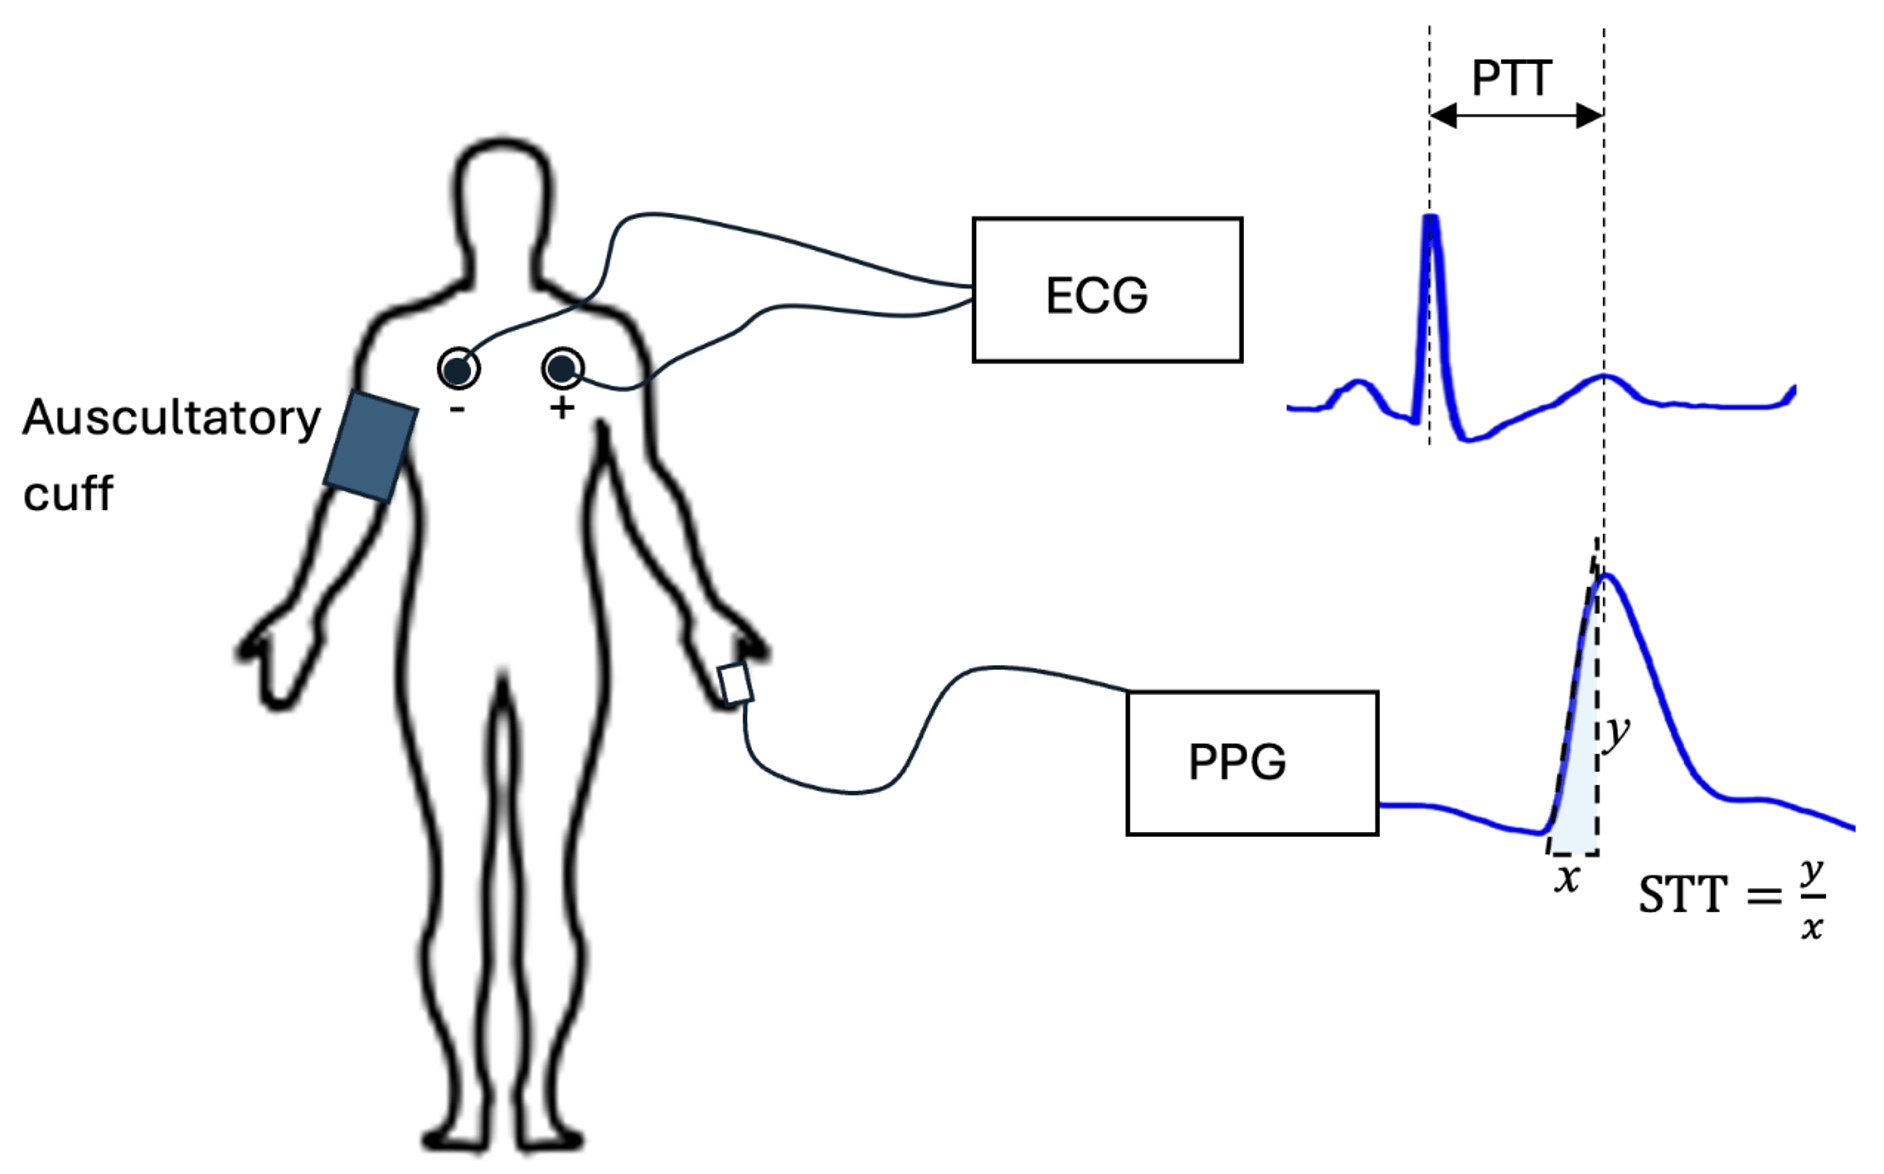
While cuff-based BP measurements provide only snapshots of an individual’s cardiovascular condition, continuous monitoring, such as ambulatory BP monitoring, can offer a more comprehensive assessment. This method evaluates diurnal BP patterns and how they respond to daily physical and mental activities. Ambulatory BP monitoring improves hypertension management by enabling early detection, optimizing medication use, and reducing the risk of misdiagnoses, such as masked hypertension and nocturnal hypertension. Currently, devices used in ambulatory BP monitoring still rely on cuff-based oscillometric techniques, which are cumbersome and inconvenient for prolonged use. To overcome these limitations, cuffless methods using wearable sensors are gaining significant attention recently3. Most of these methods estimate BP by analyzing pulse wave signals. Studies have shown that BP correlates with the pulse transit time (PTT), which is the time it takes for a pulse wave to travel over a specific distance between a proximal and a distal site of the body4. This correlation arises because individuals with higher BP typically have stiffer vascular walls, which results in faster pulse wave velocity and consequently shorter PTT. The PTT method requires at least two sensors to measure pulse waveforms simultaneously at two body locations5. Alternatively, BP can be estimated from a single sensor using the Pulse Wave Analysis (PWA) method. For instance, studies have shown that BP also correlates with the Slope Transit Time (STT), which is the steepest slope of the rising systolic pulse wave6.
In practice, pulse wave-based methods often rely on surrogate signals to represent pressure waves. Photoplethysmography (PPG) and Electrocardiography (ECG) waveforms are the most adopted surrogate signals. PPG is an optical approach which detects blood volume changes beneath the skin. PPG waveforms are measured by using an LED that emits light into the skin and a photodetector to detect the change in reflected or transmitted light, which is proportional to the fluctuating blood volume during the cardiac cycle. ECG waveforms represent the electrical activity of the heart measured from various angles with multiple electrodes placed on several parts of the body, typically on the chest and limbs. Figure 1 demonstrates a typical configuration for developing algorithms that predict BP using multiple or single ECG and/or PPG sensors.
Over the past decade, wearable PPG sensors have been widely integrated into consumer devices such as smart watches and rings. They are often used to monitor heart rate and blood oxygen levels. Wearable ECG sensors are also integrated into consumer devices. For instance, applications of the built-in ECG sensor in Apple Watch are marketed for detecting irregular heart rhythms and atrial fibrillation. As wearable PPG and ECG sensors are becoming widely available, they offer a promising opportunity to develop automatic, continuous, and convenient BP monitoring applications. Consequently, many research efforts have recently focused on estimating BP using pulse wave-based methods.
Machine learning approaches to predict blood pressure with PPG and ECG sensors
Early pulse wave-based BP estimation methods were generally based on parametric models. In these models, parameters such as PTT and STT were calculated directly from pulse wave signals7. Some approaches used predefined procedures to extract features from pulse waves, and BP values were then determined by regression with these features8. Parametric models have several limitations, including accuracy degradation over time, the need for subject-specific calibration, and the requirement of multiple PPG and/or ECG sensors9.
With the advances in artificial intelligence (AI) and machine learning (ML) technologies, recent studies on cuffless BP measurements have increasingly focused on data-driven models10. Learning-based approaches generally offer greater practicality since they are typically calibration-free and often need input from only a single sensor11. Early ML-based models predict BP by learning manually extracted features from pulse wave signals. Regression algorithms, including support vector machine (SVM), random forest (RF), decision tree, and adaptive boosting (AdaBoost), have been employed to estimate SBP and DBP based on 12 features derived from PPG and ECG signals12. Deep neural networks (DNNs) are becoming more popular approaches for BP estimations. With a designed layer architecture, DNN models can automatically extract meaningful features from raw pulse waveforms through learning and predict either SBP/DBP values or ABP time series. For instance, studies have demonstrated that the classic multilayer perceptron (MLP) network can predict BP values with good accuracy13‘14. Convolutional neural networks (CNNs) have been widely utilized in BP prediction models due to their proven capabilities in signal feature extraction. For example, the residual network (ResNet), a CNN-based architecture developed by Microsoft Research, has been applied to estimate SBP and DBP values from PPG signals15. Research also showed that models combining CNN with recurrent neural networks (RNNs), such as the long short-term memory (LSTM) network, can significantly improve in BP estimation accuracy from PPG time series16‘17‘18. Building on the success of Transformer architectures19 recently developed for natural language processing, a Transformer-based model has achieved the state-of-the-art performance in predicting BP values using PPG signals20.
To provide a comprehensive evaluation on the performance of various ML-based models, a study was conducted recently to benchmark 11 different DNNs reported in the literature, using four open datasets10. This study concluded that cuffless blood pressure estimation from PPG signals using ML techniques is promising, it still requires substantial research before it can meet the reliability standards needed for clinical applications.
Research hypothesis and objectives
Since physiological studies have shown that features in pulse waves, such as PPG and ECG signals, correlate with blood pressure, we hypothesize that a DNN trained on pulse wave data from a large population can predict BP without needing to calibrate for individual users. To test the hypothesis, we developed a CNN model for BP estimation. The performance of the proposed model was evaluated using different input configurations of PPG and ECG waveforms and was compared to existing ML studies. Furthermore, we developed a prototype wearable device that can estimate BP from PPG signals with the CNN trained in this study.
Methods
Data Source
Continuous waveforms of PPG, ECG, and ABP data were downloaded from PhysioNet (https://physionet.org/), the largest public database for physiological studies. Specifically, the MIMIC-III dataset contains digital health records from over 40,000 de-identified patients admitted to critical care units at the Beth Israel Deaconess Medical Center (Boston, MA) between 2001 and 201221. Among these, concurrently measured PPG, ECG, and ABP waveforms were available for 5,390 de-identified patients with diverse demographic and clinical background. Waveform data from these patients were selected for training and validating the proposed DL model. This study focused on signal-based modeling without stratifying by patient characteristics, which could be explored in future research.
Data Preprocess
Original data consists of waveforms of PPG, ECG and ABP signals acquired and digitized with a sampling rate of 125 Hz. The recording duration for individual patients varied between 8 and 600 seconds. To accommodate the input requirements of the proposed DL model, which processes 20-second segments of PPG and/or ECG signals, the original waveforms were partitioned into non-overlapping 20-second intervals. Each segment was treated as an individual sample for subsequent processing.
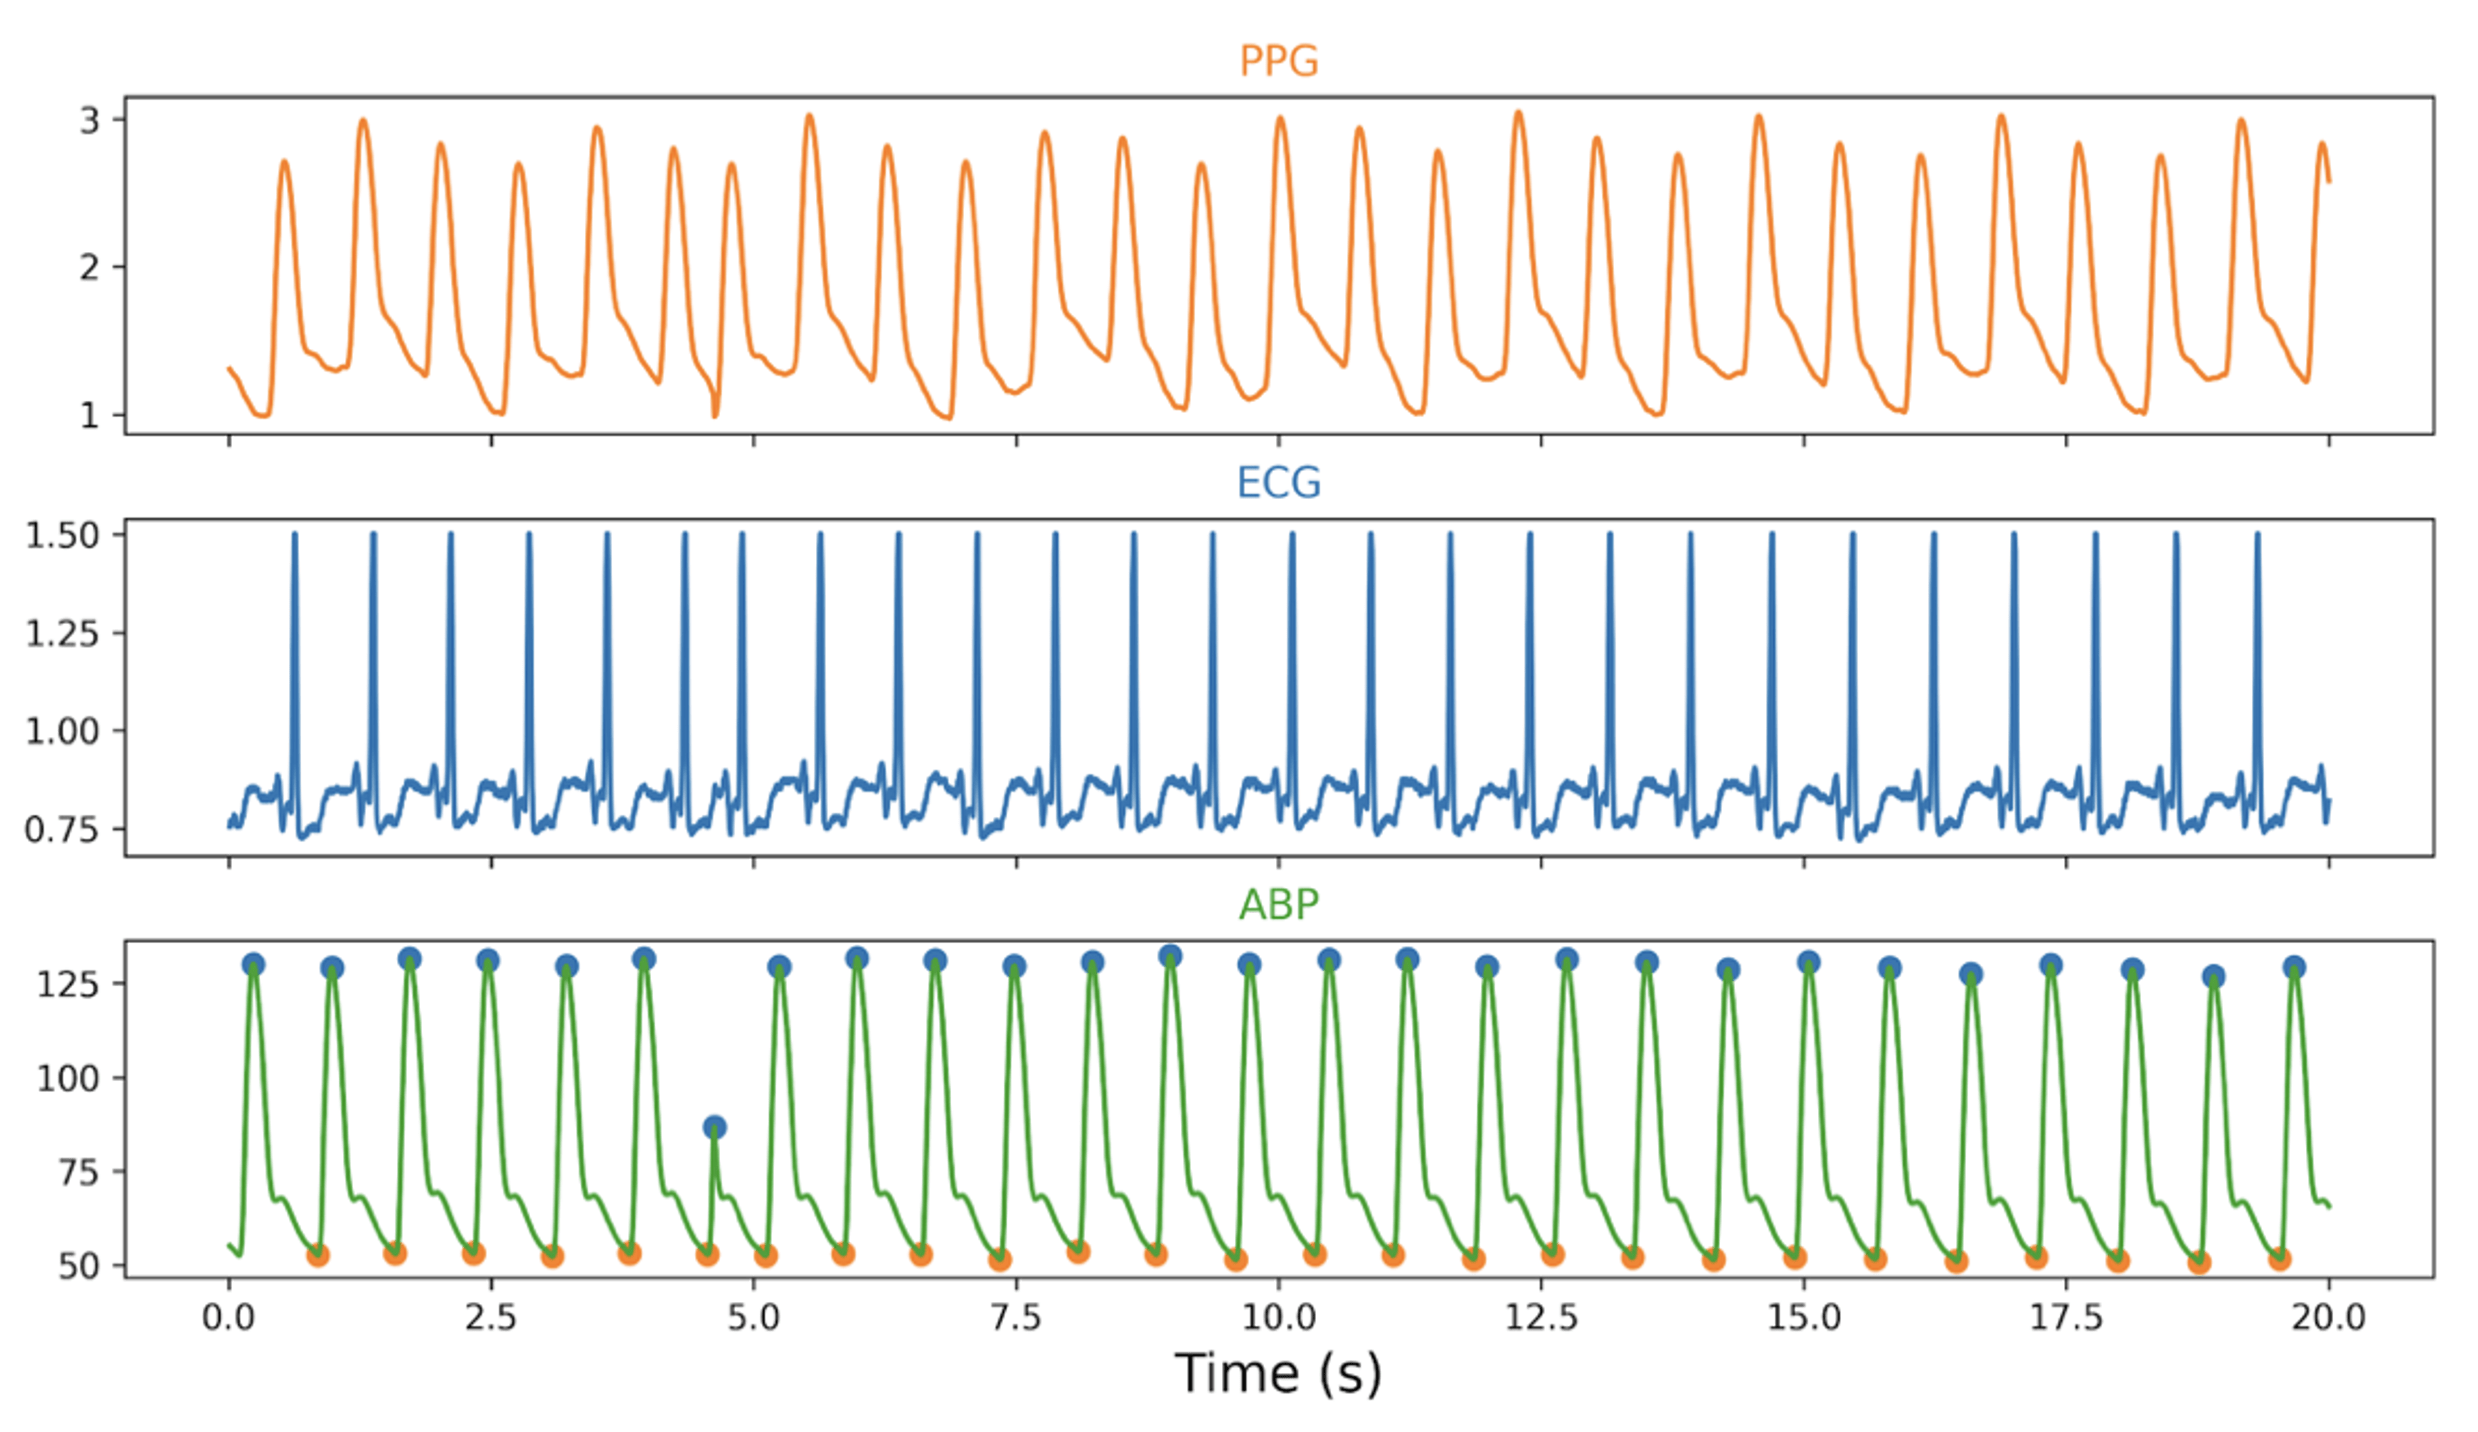
A custom Python program was developed to identify all prominent peaks and troughs in each ABP waveform segment. The SBP and DBP were calculated as the median values of the identified peaks and troughs, respectively. These derived BP values served as the ground truth labels for DL model training and testing. Additionally, the heart rate (HR) was calculated as 60 seconds divided by the average time interval between consecutive peaks of the ABP waveform. Figure 2 illustrates sample 20-second segments of PPG, ECG, and ABP waveforms, along with the annotated ABP peaks and troughs used to derive the SBP and DBP values.
To control the quality of the training and testing datasets, “abnormal” samples were excluded from subsequent procedures. A sample was deemed abnormal if it met any of the following criteria: (a) The sample duration was less than 20 seconds. (b) The heart rate exceeded 200 beats per minute (bpm) or fell below 30 bpm. (c) Significant signal drift was observed in the PPG, ECG, or ABP waveforms. A significant drift was defined as a condition where the standard deviation of peaks or troughs of a waveform exceeded 20% of it mean value. (d) The SBP was higher than 180 mm Hg or lower than 70 mm Hg. (e) The DBP was higher than 110 mm Hg or lower than 40 mm Hg.
To ensure consistency across input data, each retained PPG and ECG segment was standardized by subtracting its mean and dividing by its standard deviation. This procedure reduces the influence of differences in signal amplitude and offsets, which can arise from variations in sensor type, placement, or individual characteristics. Following these preprocessing steps, 46,416 clean data samples were generated. Each sample consisted of a 20-second segment of PPG, a 20-second segment of ECG, and the SBP/DBP value pair.
The preprocessed dataset was subsequently divided into a training set (32,491 samples, comprising 70% of the data), a validation set (4,623 samples, 10%) and a testing set (9,302 samples, 20%). The data-splitting procedure was designed in a way such that samples from any specific patient only appeared in one dataset. This step ensured that three datasets were independent to each other, which is necessary to avoid overestimating the DL model’s accuracy due to patient-specific data leakage.
Deep learning neural network architecture
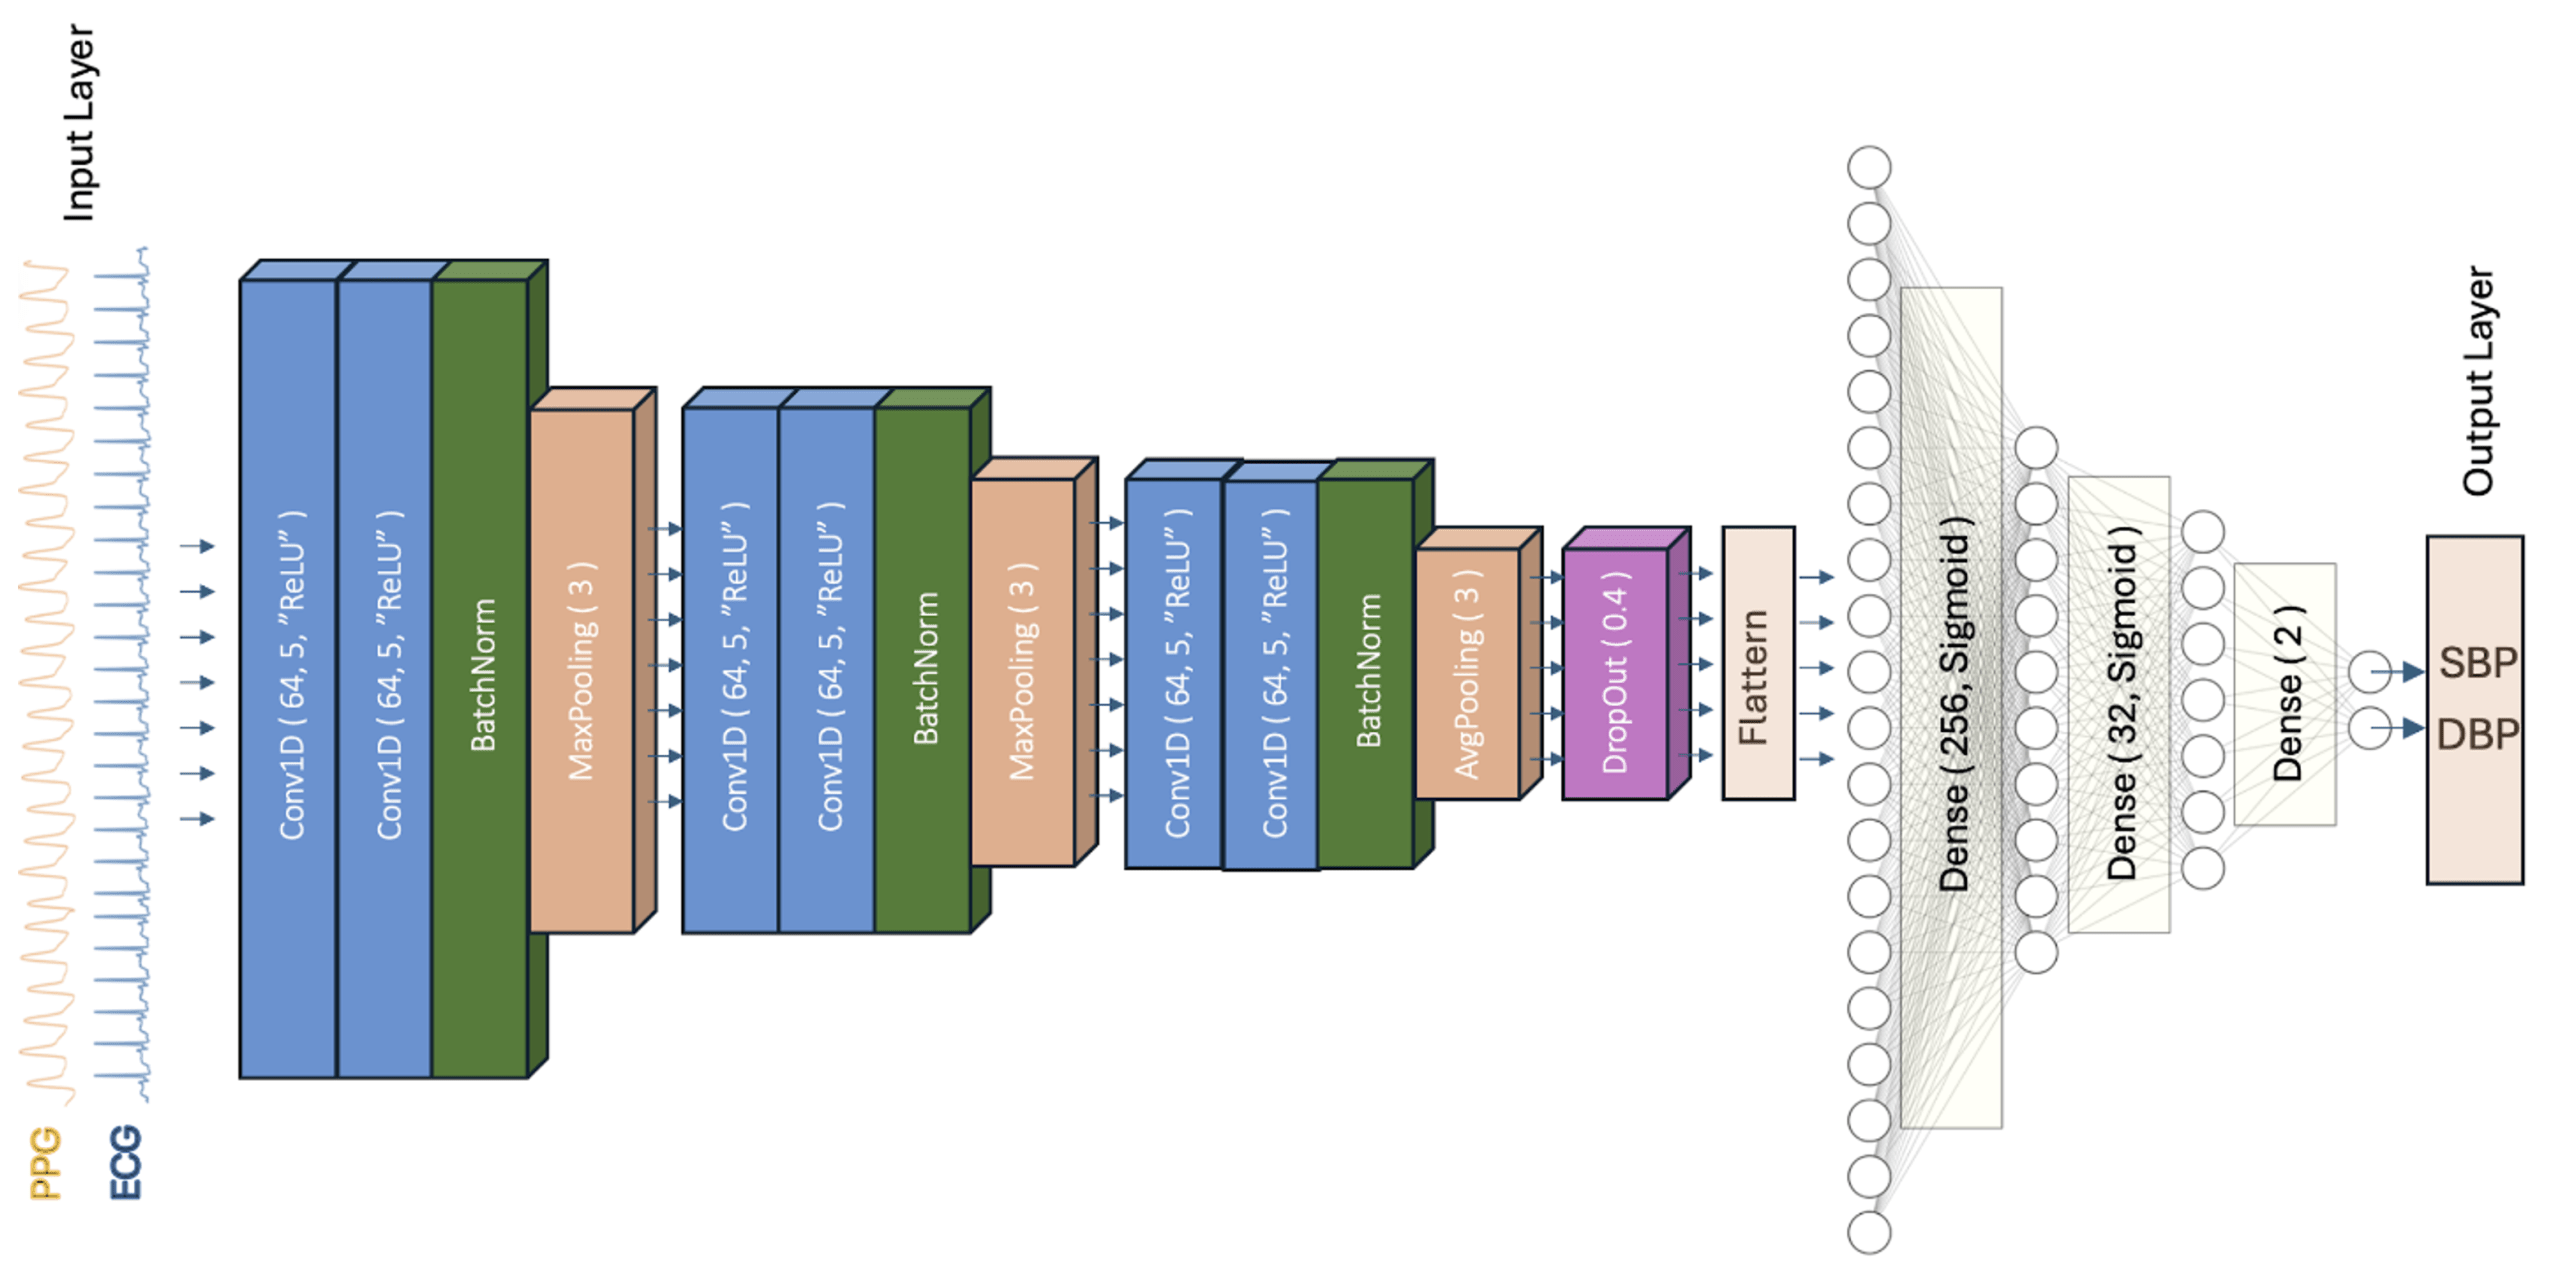
A one-dimensional convolutional neural network (1D-CNN) was designed and trained to estimate BP as a regression task. The CNN architecture was selected due to its ability to automatically extract relevant features or patterns from time-series data. The developed CNN model consists of an input layer (processed 20-second PPG and/or ECG signals), an output layer (SBP and DBP values), and 17 inner layers. The network architecture (Figure 3) primarily consists of three CNN blocks, each comprising two convolutional layers, one batch normalization layer, and one pooling layer.
A convolutional layer applies a sliding window, or “kernel,” to the input signal. The convolutional process is equivalent to signal “filtering” to learns patterns or features from the preceding layer. Multiple filters can be applied in each convolutional layer with each filter detecting a specific feature or pattern. In Figure 3, a convolutional layer is denoted as Conv1d (m, n, “ReLU”), where m is the kernel size, n is the number of feature maps to generate, and “ReLU” refers to the “rectified linear unit” activation function, which introduces nonlinearity to the model for capturing complex relationships among features.A batch normalization (BatchNorm) layer accelerates and stabilizes the training process by normalizing the outputs from the previous layer and reducing internal covariate shifts.
A pooling layer captures the most significant features by downsampling. This layer applies aggregation operations such as MaxPooling (n) or AvgPooling (n) where n denotes the pool size. MaxPooling selects the maximum value in each pooling window, while AvgPooling calculates the mean value.
Following the three CNN blocks, a dropout layer ( DropOut(x) ) was added to randomly exclude a fraction (x) of neurons for each training step. It helps to mitigate the “overfitting” issue, where the model performs well on training data but fails to generalize to unseen data. Next, a Flatten layer was applied to transform the data into a one-dimensional vector. The final layers are three fully connected layers ( Dense(n, “Sigmoid”) ) which translates the “flattened” feature into the final output, i.e., SBP and DBP values. Here, n denotes the number of neurons in each layer, and the “Sigmoid” is an activation function which introduces nonlinearity to the model. The three fully connected layers are essentially a multilayer perceptron (MLP) neural network.
DL model training and evaluation
The designed DL model was implemented in Python 3 using the Keras/TensorFlow library. Model training was carried out in the Google Colab cloud computing platform. Experiments were conducted to optimize the DL model by iteratively adjusting the overall network architecture, the number of layers, and hyperparameters, including kernel size, number of features, pool size, drop out fraction, learning rate, loss function, batch size, number of epochs, and the early stopping criteria. The architecture shown in Figure 3 presents the final design that generated results with the least error. Mean Square Error (MSE) was used as the loss function, and the Adaptive Moment Estimation (Adam) optimization algorithm with a learning rate of 0.001 was employed during the training process. The batch size was set to 128 considering the balance between the training speed and the stableness of gradients. The training process was configured to run for up to 800 epochs with an early stopping mechanism which terminates training once the mean square error (MSE) loss reaches its minimum within the last 20 epochs (i.e., “patience” = 20).
Three DL models were trained using different input configurations: (a) ECG alone, (b) PPG alone, or (c) a combination of PPG and ECG as a two-channel input. The performance of the three DL models was compared by evaluating on the same testing dataset. Specifically, the performance was assessed with the following metrics:
- Mean Error (ME)
(1) 
where is the number of samples in the test dataset,  is the predicted BP value (either SBP or DBP) from the DL network, and
  is the ground truth BP value.
- Standard Deviation (STDEV)
(2) 
- Mean Absolute Error (MAE)
(3) 
Prototype PPG2BP system
While many ML models predicting BP from PPG and/or ECG waveforms have been reported in the literature, relatively few have demonstrated their performance using measurements collected from wearable sensors. To evaluate the real-world applicability of the proposed DL model, a prototype PPG to BP (PPG2BP) system was developed in this study.
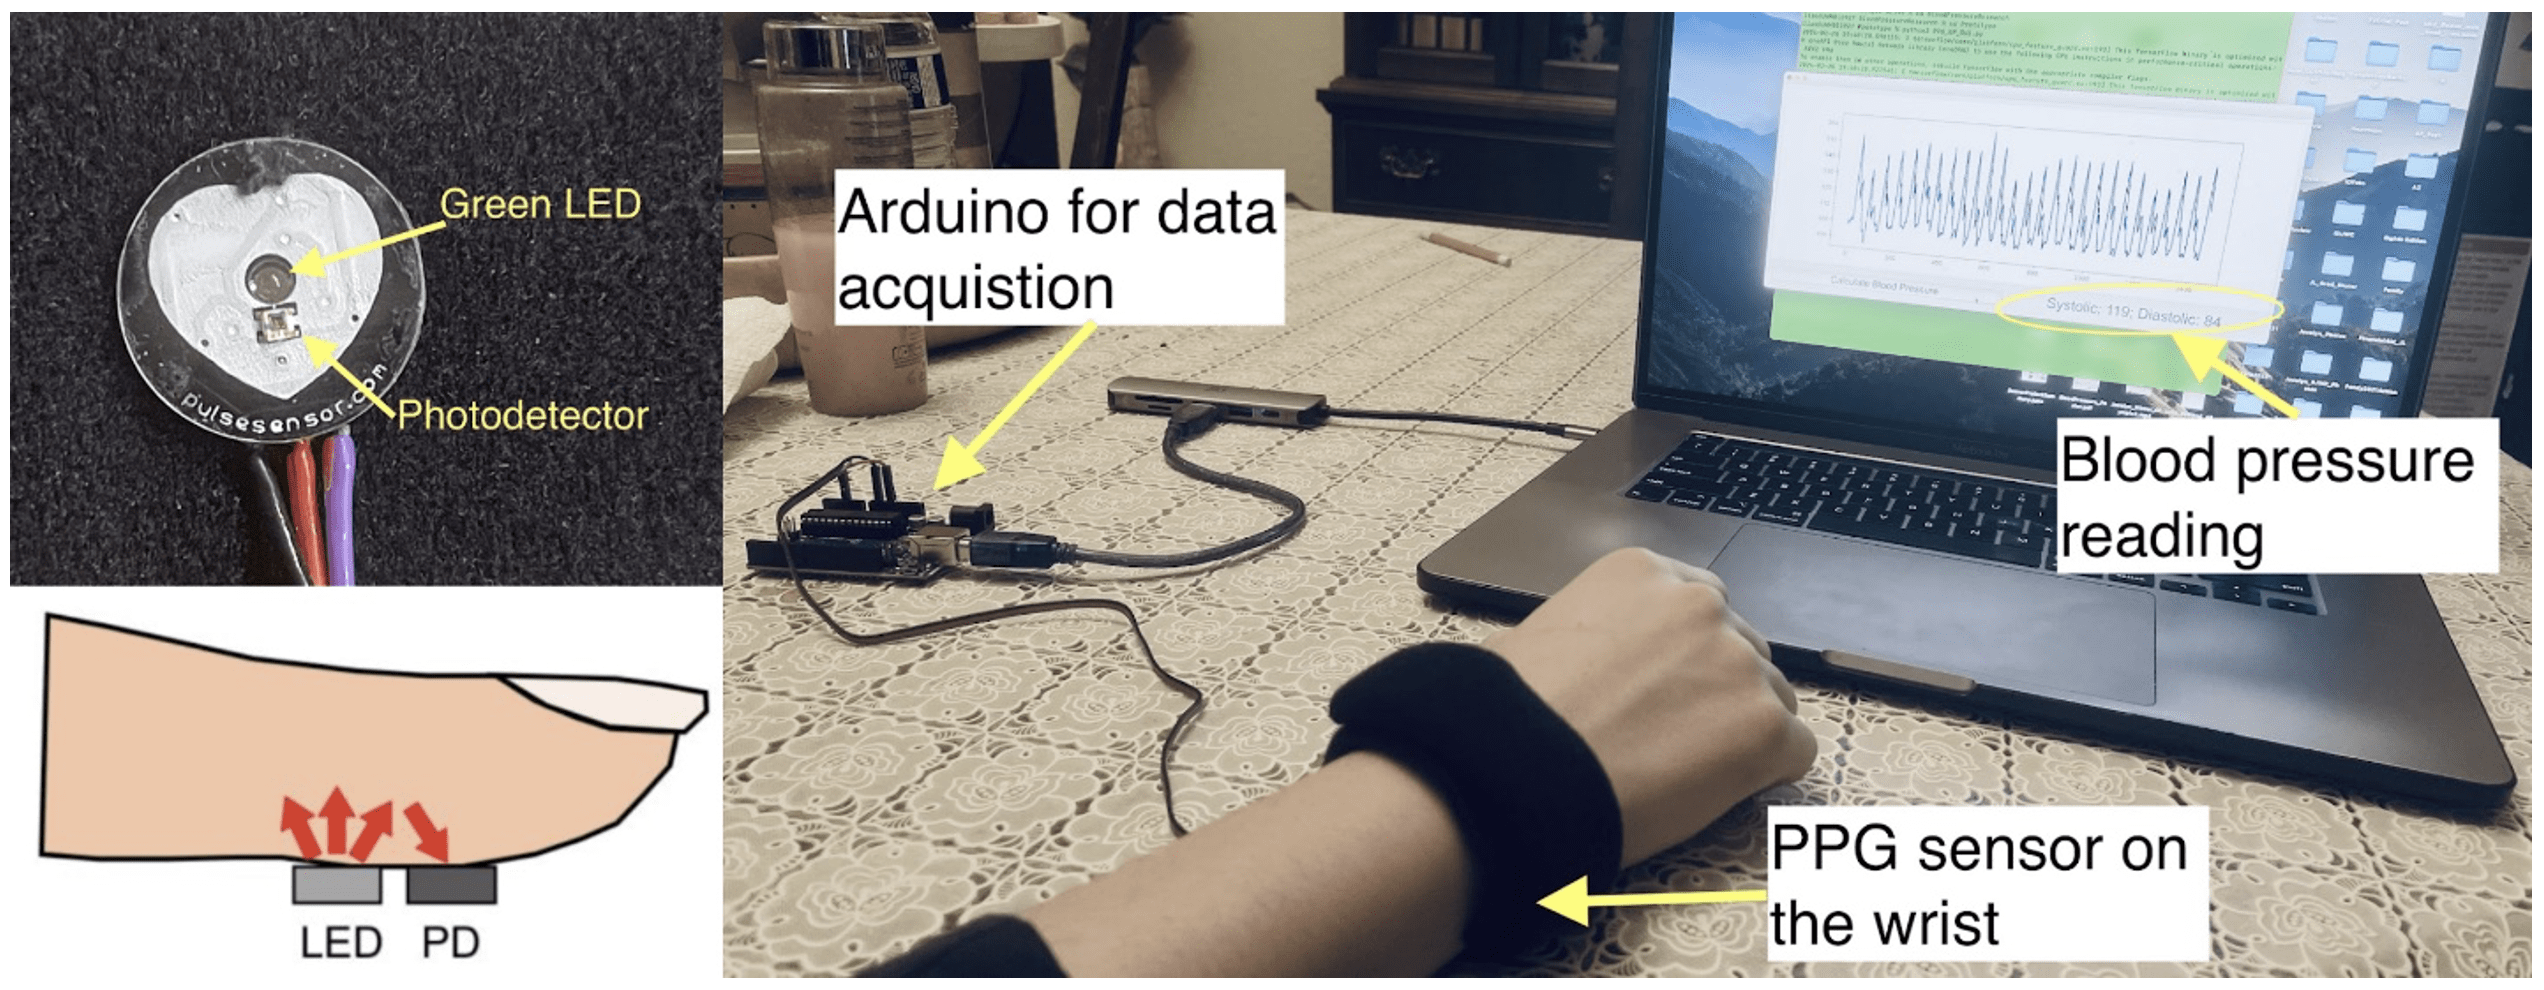
A low-cost PPG sensor (PulseSensor, World Famous Electronics LLC) was used to build the prototype (Figure 4). The sensor includes a green LED that emits light into the skin and a photodetector that measures the reflected light, which variates in intensity due to light absorption by the changing blood flow volume under the skin. The sensor was mounted on a flexible wrist band for testing on a human subject.
The sensor outputs an analog voltage signal proportional to the detected light reflection. An Arduino Uno microcontroller (Arduino LLC) was programed to read the analog output of the PPG sensor at a frequency of 100 Hz and transmit the waveform as a time series through a Serial communication port (baud rate = 11,920). The Serial output of the Arduino was directed to a USB port of a laptop computer (Apple MacBook pro, Apple Inc.), where a custom Python program was used continuously read and display the PPG waveform via a graphic user interface (GUI). When the backend of the program receives a button click event from the GUI, it retrieves the PPG waveform recorded over the previous 20 seconds. To match the model’s input requirements, the PPG signal is resampled from 100 Hz to 125 Hz using linear interpolation. While this step may introduce minor artifacts, the impact is expected to be negligible given the small difference in sampling rates. The resampled waveform is then fed into the trained DL network (PPG input alone) to calculate BP values. The calculated SBP and DBP are subsequently displayed on the GUI (see Figure 4).
The prototype PPG2BP system and the trained DL model were tested on three volunteer subjects. Measurements were conducted over the course of one month, with each subject receiving 30 tests. For each test, the subject’s BP values were also measured using a commercial grade oscillometric BP monitor (iHealth Track Smar Arm Blood Pressure Monitor 550BT, iHealth Labs, Inc.) to provide reference values for comparison.
Results
Training and evaluation results
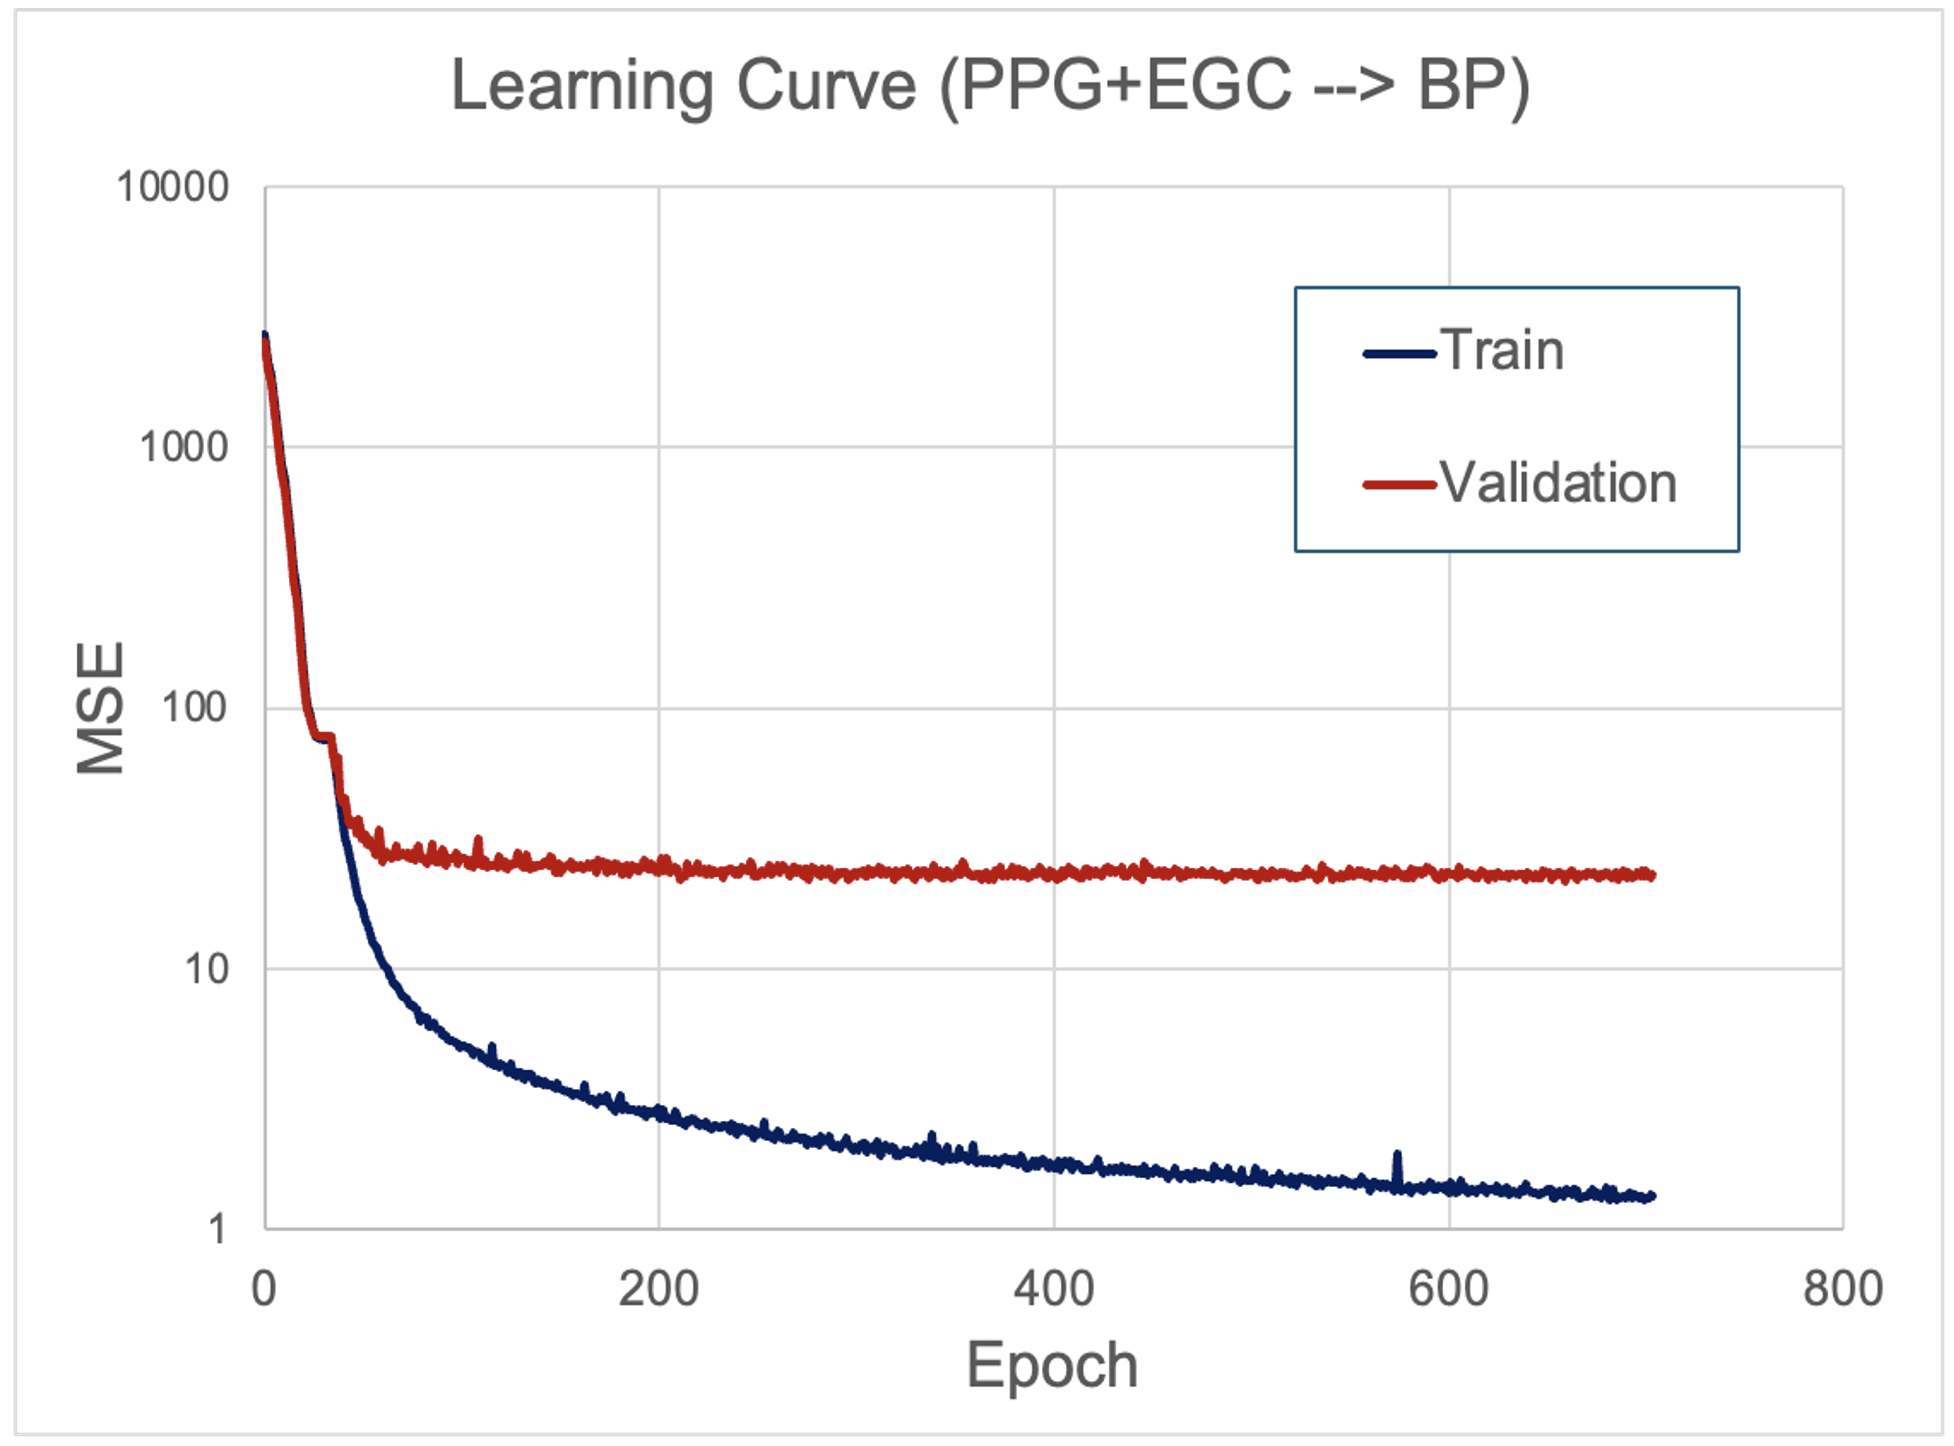
The learning curve evaluates model learning performance by plotting the evaluation metric (e.g., MSE) against epochs. The learning curve for training the DL model using combined PPG and EGC inputs showed that both training and validation losses decreased sharply within the first 100 epochs. While the training loss continued to decline gradually, the validation loss plateaued after approximately 200 epochs. The training process terminated at epoch 705 due to early stopping (Figure 5). Similar learning curve patterns were observed when using PPG or ECG waveforms individually as inputs. While the final validation error is notably higher than the training error, both curves decreased steadily and reach a plateau, suggesting stable convergence without overfitting. The observed gap reflects the model’s limited ability to generalize across the diverse data, a common challenge in real-world physiological signal analysis. Future studies may explore more advanced architectures or utilize larger and more diverse datasets to enhance model generalizability.
Prediction performance of the DL model and comparison with other ML models
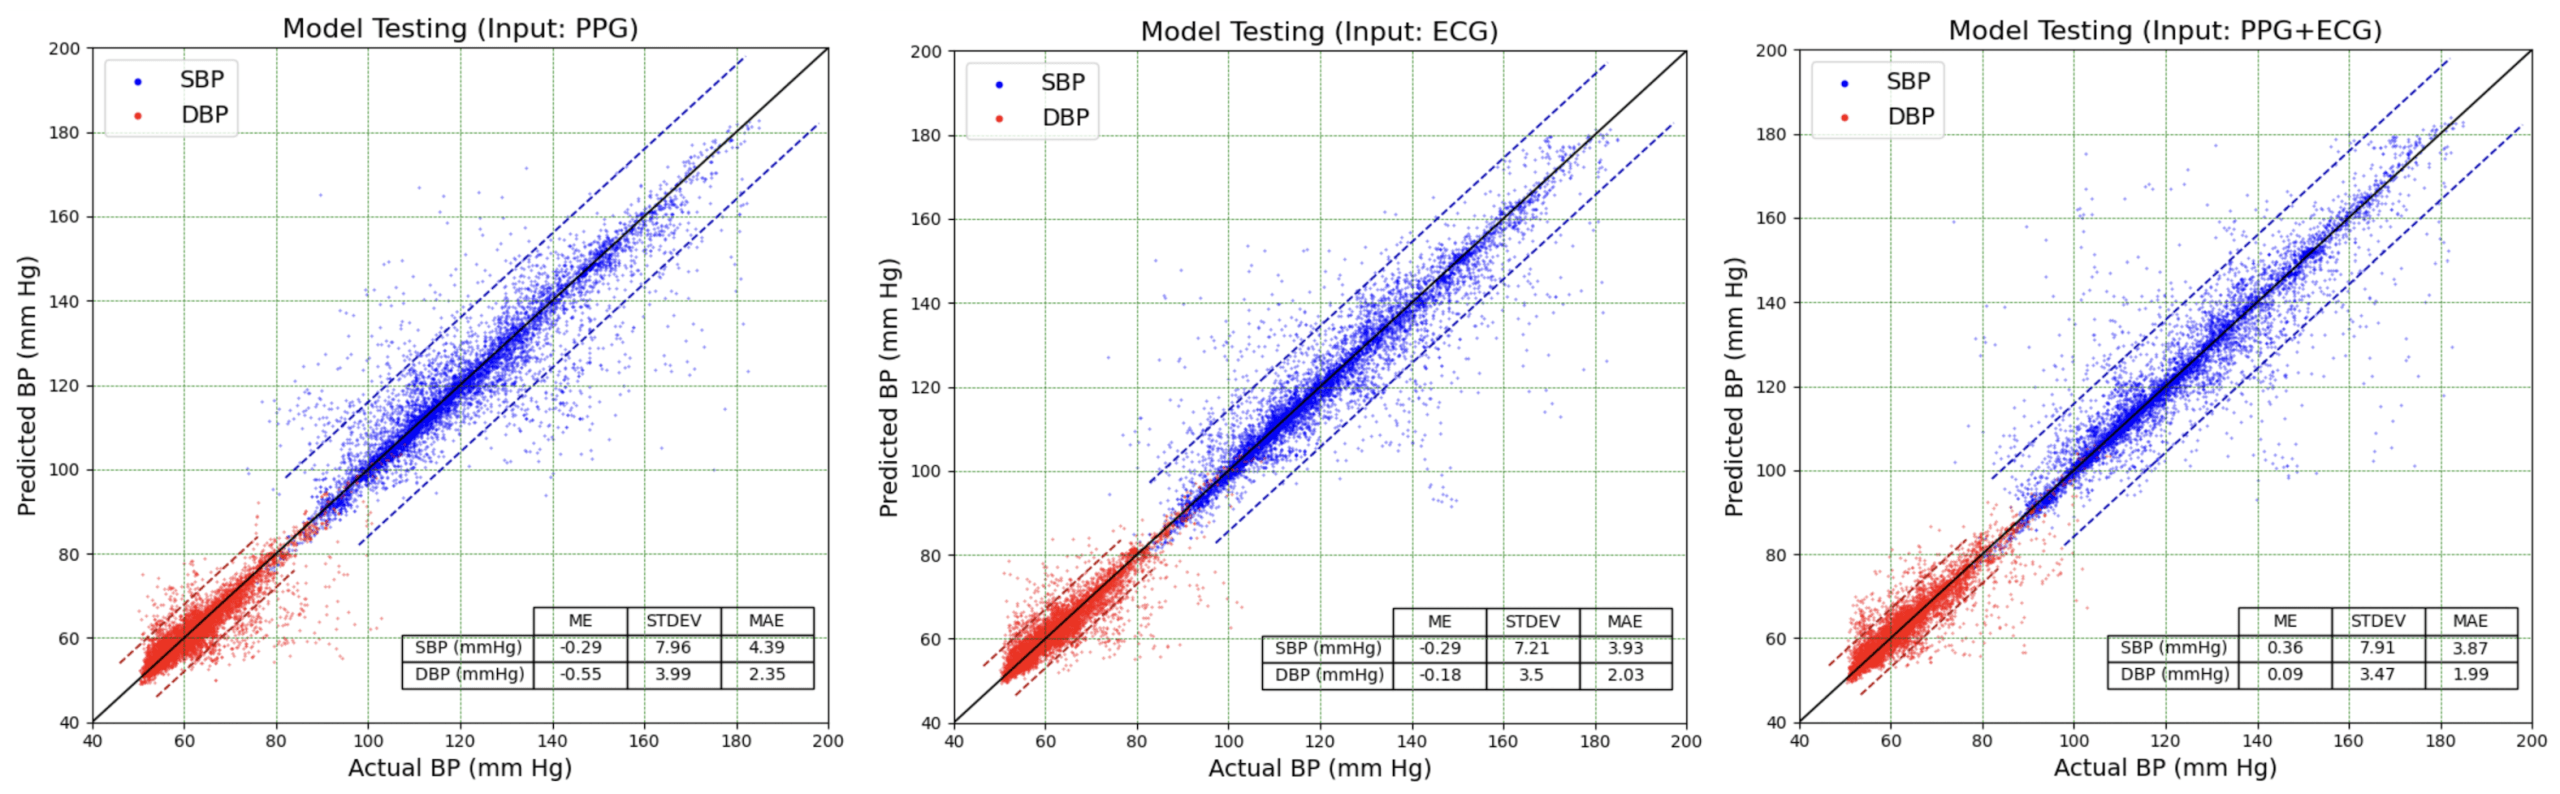
The trained DL model was evaluated using the independent testing dataset (9,302 samples) to predict SBP and DBP values. Figure 6 shows scatter plots of predicted BP values using three models versus ground truth values. For visual comparison, a 1:1 reference line (y = x) is included in the scatter plots representing perfect agreement between predicted and ground truth. Despite some outliers, most predictions cluster around the reference line, indicating good agreement with actual BP values. Quantitative performance metrics shown in the inset tables, including ME, STDEV, and MAE, also confirmed this agreement. The standard deviations (STDEVs) of SBP prediction errors were 7.96, 7.21, and 7.91 mm Hg for the models using PPG, ECG, and PPG+ECG waveforms as inputs, respectively. Similarly, the STDEVs of DBP prediction errors were 3.99, 3.50, and 3.77 mm Hg for the three models. The accuracy of prediction is comparable to that of commercial home oscillometric BP monitors. For example, a study comparing five popular home BP monitors to the mercury sphygmomanometer standard reported STDEVs of SBP measurements ranging from 6.08 to 7.57 mmHg and DBP measurements ranging from 5.02 to 6.47 mmHg22.
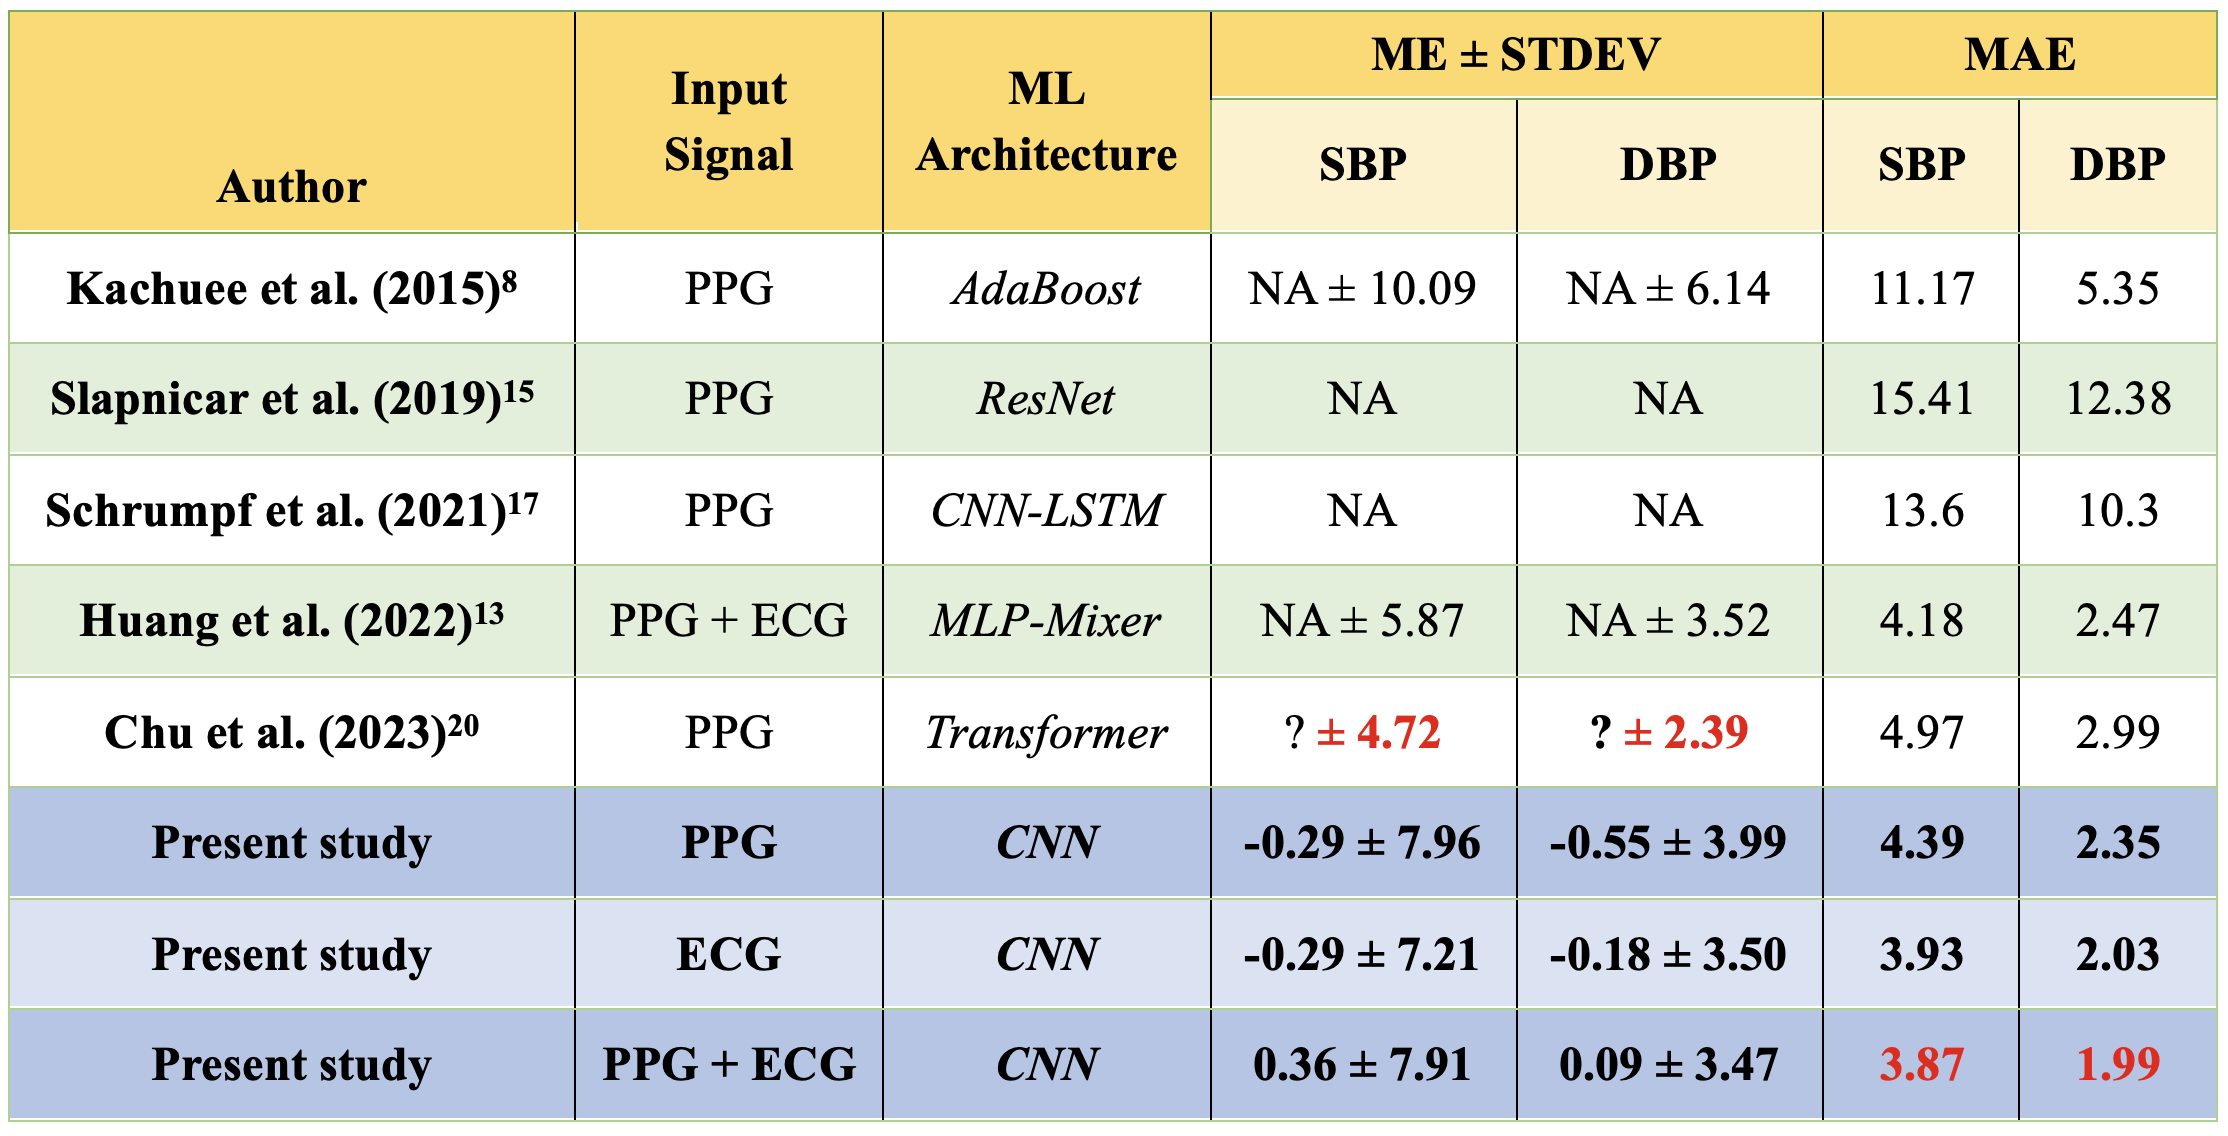
The model’s performance on the testing dataset was evaluated through three key metrics: ME, STDEV, and MAE. These metrics for the DL models in this study using different waveforms as input are compared to metrics from other ML-based models reported in the literature, all trained on the same MIMIC III dataset (Table 1). While MEs were not reported for the other ML models listed in Table 1, the DL models in this study demonstrated minimal bias errors, with MEs ranging from -0.29 to 0.36 mm Hg for SBP and -0.55 to 0.09 mm Hg for DBP. Measured by the STDEV, the three models performed comparably to the MLP-Mixer model13, significantly outperformed the AdaBoost model8, but were slightly less accurate than the Transformer-based model20. When evaluated using MAE, the DL model with ECG input achieved slightly better performance compared to that with PPG input. The DL model with ECG and PPG combined input demonstrated the best performance. Specifically, the MAEs were 3.87 mm Hg for SBP and 1.99 mm Hg for DBP, outperforming all other models shown in Table 1.
Performance evaluation of the prototype wearable PPG2BP system
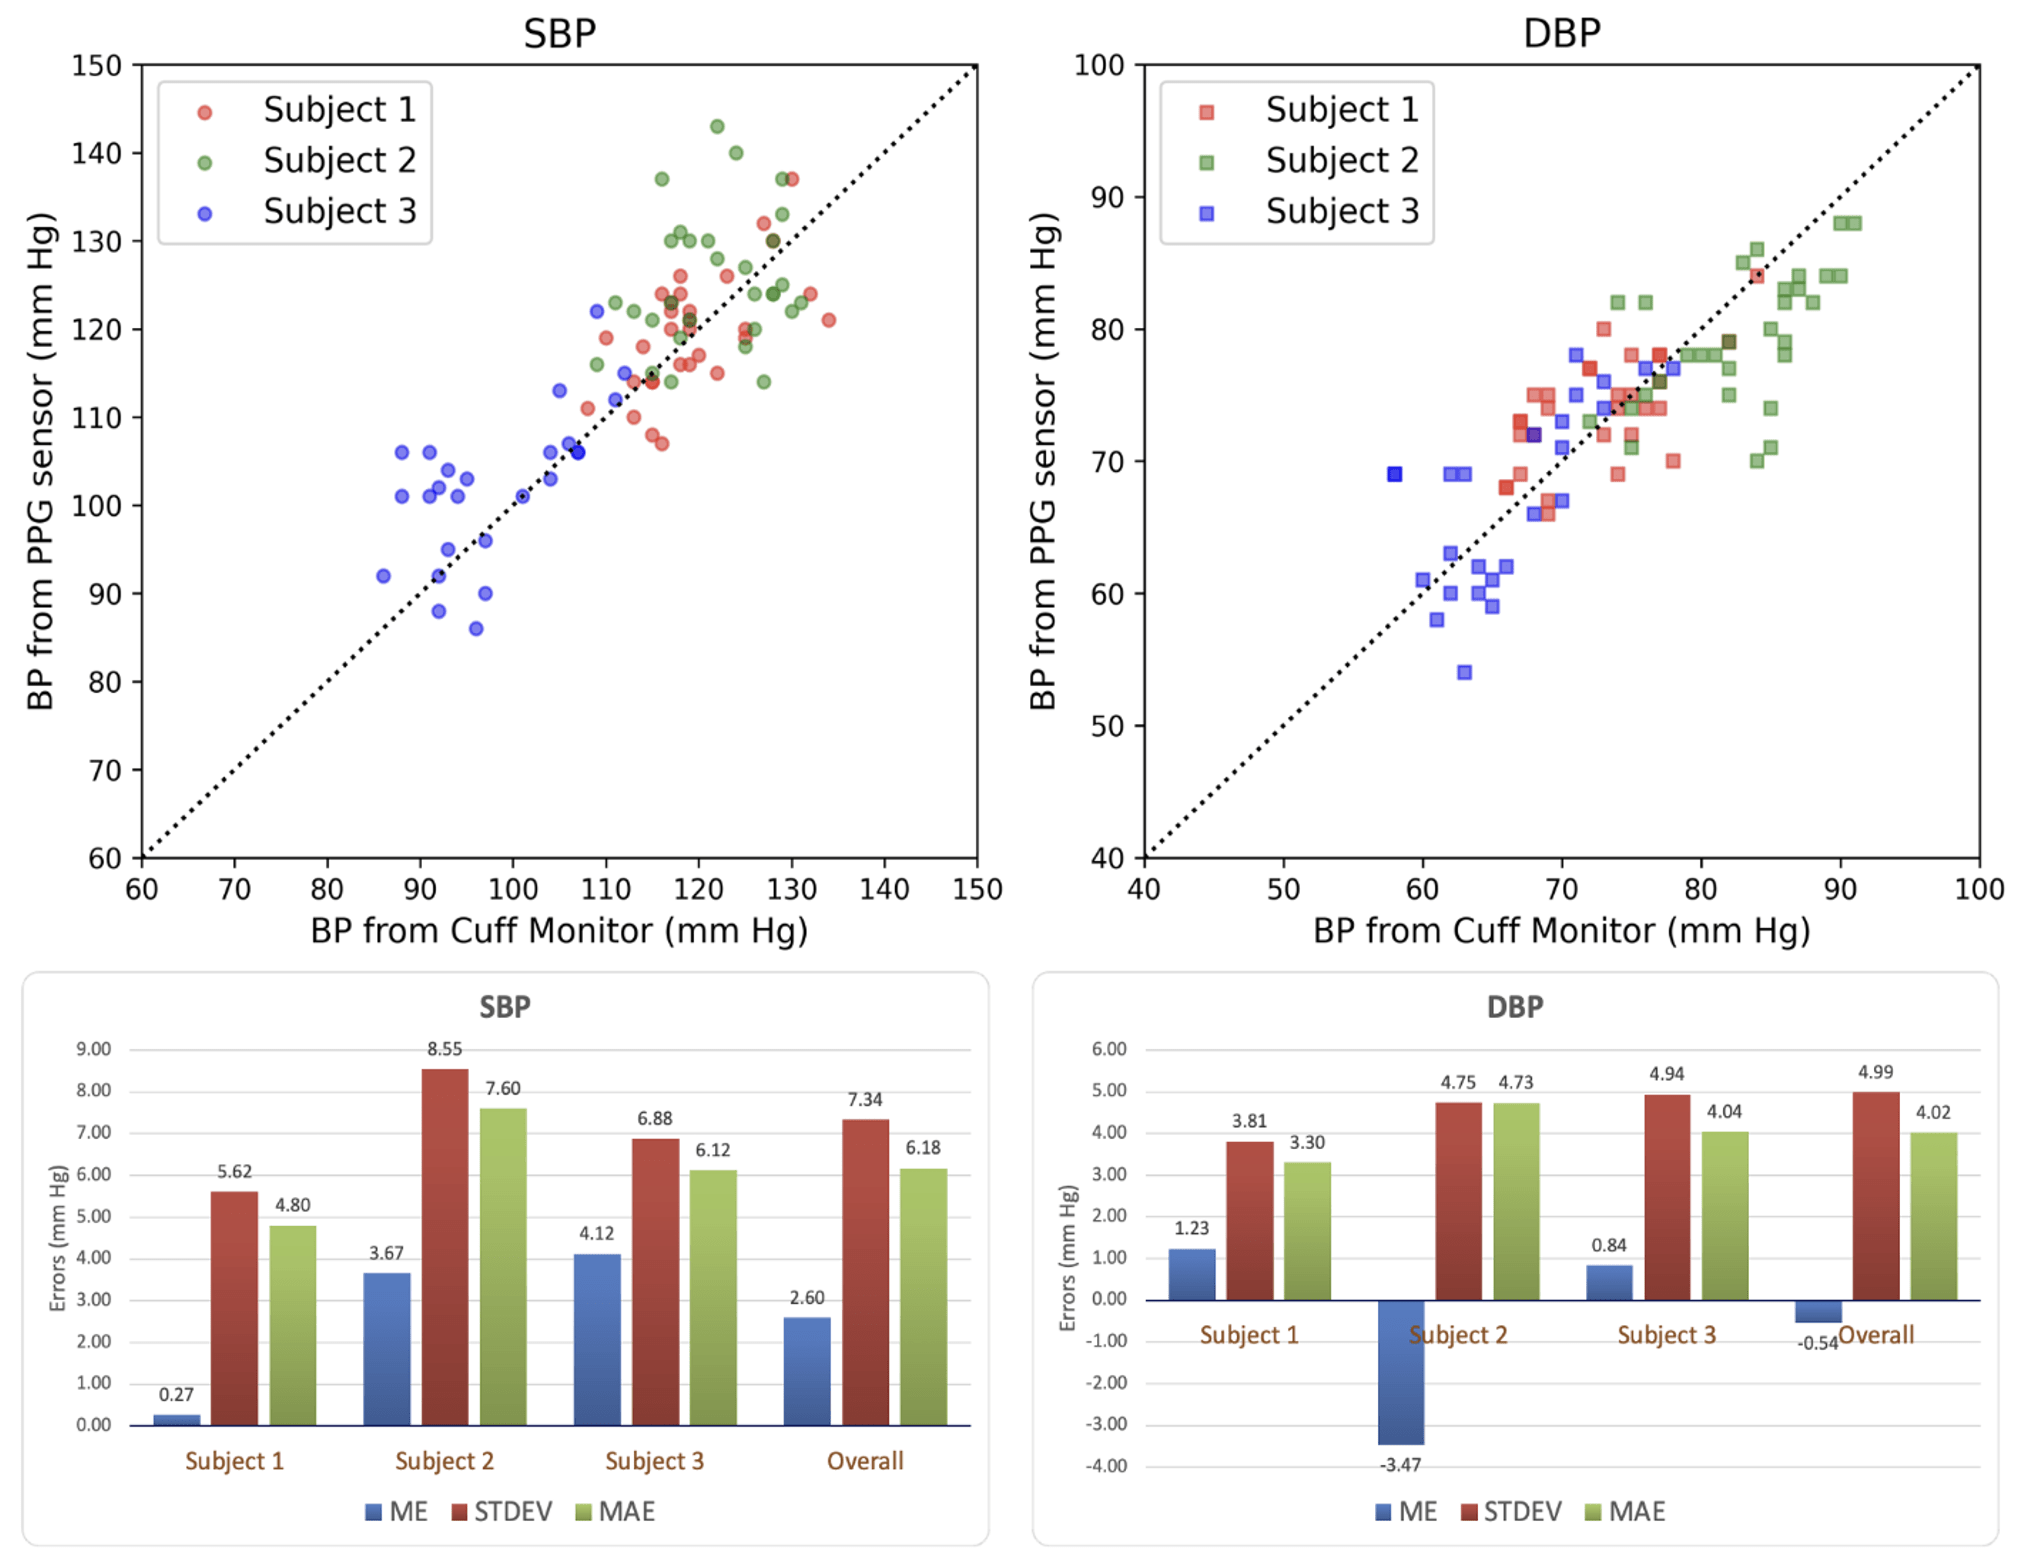
The trained DL model using PPG input was further evaluated with a prototype PPG2BP wrist sensor to estimate BP values of three human subjects. For comparison, each subject’s BP was also measured using a commercial oscillometric home BP monitor. A total of 30 measurements were conducted for each subject over one month. The resulting 90 PPG2BP measurements, plotted against BP values recorded by the oscillometric BP monitor, are presented in Figure 7, along with the evaluation metrics. BP values predicted by the DL model showed a good correlation with those obtained from the cuff-based BP monitor.
Across 90 measurements from three subjects, the ME is 2.6 mm Hg for SBP, and -0.54 for DBP. The STDEV is 7.34 mm Hg for SBP and 4.99 mm Hg for DBP, which are comparable to the evaluation results on the MIMIC III testing dataset (Table 1). They are also comparable to STDEVs reported for some home-use BP monitors22. The MAE is 6.18 mm Hg for SBP and 4.02 mm Hg for DBP, which are higher than MAEs obtained on the MIMIC III test dataset using PPG input alone (4.39 mm Hg for SBP and 2.35 mm Hg for DBP).
It is important to note that “errors” reported above and shown in Figure 7 reflect the differences between the DL model’s predictions and the readings from the home-use BP monitor. However, such BP monitors have inherent inaccuracies when compared to gold standard methods, such as auscultatory or invasive ABP measurements. As a result, the reported error metrics represent the discrepancy between two imperfect measurements, and they should not be interpreted as precise indicators of the prototype systems’ performance. The actual error of a prototype hardware system will likely exceed that observed in testing with the MIMIC dataset. This increased error may be attributed to factors including differences in sensor placement, signal quality, sampling frequency, and domain shift between controlled clinical data and measurements obtained from healthy volunteers using low-cost sensors. Future studies are needed to isolate and quantify these factors.
Discussion
The application of DL models in BP estimation presents many benefits over conventional BP monitoring approaches. Trained DL models can be integrated into wearable devices, such as smart watches and smart rings, providing convenient, real-time, and continuous BP monitoring, and representing an innovative healthcare technology which can potentially transform hypertension management.
The PPG sensor used in the prototype study was found to be sensitive to motion artifacts and sensor placement, which will affect prediction accuracy in real-world applications. Future research should focus on enhancing the reliability of wearable pulse wave sensors. Implementing multi-wavelength LEDs and advanced signal processing algorithms may improve the signal-to-noise ratio and solve problems related to motion artifacts, skin tone variations, and ambient temperature fluctuations23. Since dataset employed in this study was acquired from a single hospital, the trained DL model may have a limited generalizability across different age groups, ethnicities, and health conditions. It is therefore important for future improvement by expanding training datasets to include a more diverse population for broader applicability. Moreover, integrating additional physiological data, such as respiration rate or signals from impedance cardiography24, into a hybrid DL framework may further enhance the accuracy and generalizability of BP prediction.
The DL model in this study was designed to take fixed-length input signals (20 seconds), which may limit flexibility in real-world applications. Future studies may explore model architectures which can handle inputs with variable length and sampling frequency, such as recurrent neural networks or transformer-based networks. Additionally, while the designed architecture and hyperparameters were tuned empirically to optimize the presented model, a formal ablation study was not conducted. Future research is necessary to systematically evaluate the contribution of each model component.
DL techniques are often deemed as a “black box” approach lacking theoretical transparency. Therefore, enhancing the interpretability of DL models is crucial for future research. For instance, attention mechanisms and saliency maps can be implemented to help identifying the most relevant features in PPG or ECG signals that are physiologically correlated to BP. Additionally, improving the explainability of DL models will promote greater trust among clinicians and users, which is critical for the adoption of this technology in real-world healthcare applications.
Conclusion
In this study, a CNN-based DL model was developed to estimate BP from pulse wave signals. The input of the network was 20 seconds of PPG and ECG waveforms, either individually or in combination. The outputs were the SBP and DBP values. The model was trained using the public MIMIC III dataset which includes PPG, ECG and ABP waveforms from 5,390 de-identified patients. The trained DL model demonstrated reliable generalizability when applied to an independent testing dataset from the MIMIC III database. Testing results showed reliable performance with low mean errors (MEs), standard deviations (STDEVs), and mean absolute errors (MAEs). Specifically, results suggested that BP predictions are slightly more accurate when using ECG signals as input compared to PPG input. The most accurate results were obtained with the input of combined ECG and PPG waveforms, and the MAE was approximately 3.9 mmHg for SBP and 2.0 mmHg for DBP, outperforming most published ML models which use the same dataset. Since no test subjects were included in the training data, the results support our hypothesis that a DNN trained on pulse wave data from a large population can predict BP without additional calibration.
The prototype wrist device developed with a low-cost PPG sensor further validated the DL model. According to 90 measurements from three human subjects, BP values measured by the device showed a good correlation with readings from a commercial home-use BP monitor. The prototype testing further supported our hypothesis and demonstrated the potential of DL models as non-invasive and continuous BP monitoring tools with performance comparable to that of conventional home-use oscillometric devices.
Appendix
References
- World Health Organization. Global Report on Hypertension: The Race against a Silent Killer. World Health Organization (2023). [↩]
- P. Muntner, D. Shimbo, R.M. Carey, J.B. Charleston, T. Gaillard, S. Misra, M.G. Myers, G. Ogedegbe, J.E. Schwartz, R.R. Townsend, E.M. Urbina, A.J. Viera, W.B. White, and J.T. Wright. Measurement of Blood Pressure in Humans: A Scientific Statement From the American Heart Association. Hypertension 73(5), e35–e66 (2019). [↩] [↩]
- G.S. Stergiou. Cuffless Blood Pressure Monitoring: The Future for the Evaluation and Management of Hypertension, in The Handbook of Cuffless Blood Pressure Monitoring: A Practical Guide for Clinicians, Researchers, and Engineers, edited by J. Solà and R. Delgado-Gonzalo. Springer International Publishing, Cham. pp. 225–230 (2019). [↩]
- R. Mukkamala, J.-O. Hahn, O.T. Inan, L.K. Mestha, C.-S. Kim, H. Töreyin, and S. Kyal. Toward Ubiquitous Blood Pressure Monitoring via Pulse Transit Time: Theory and Practice. IEEE Trans Biomed Eng 62(8), 1879–1901 (2015). [↩]
- D. Barvik, M. Cerny, M. Penhaker, and N. Noury. Noninvasive Continuous Blood Pressure Estimation From Pulse Transit Time: A Review of the Calibration Models. IEEE Rev Biomed Eng 15, 138–151 (2022). [↩]
- P.S. Addison. Slope Transit Time (STT): A Pulse Transit Time Proxy requiring Only a Single Signal Fiducial Point. IEEE Transactions on Biomedical Engineering 63(11), 2441–2444 (2016). [↩]
- D.B. McCombie, P.A. Shaltis, A.T. Reisner, and H. Asada. Adaptive hydrostatic blood pressure calibration: development of a wearable, autonomous pulse wave velocity blood pressure monitor. Annu Int Conf IEEE Eng Med Biol Soc 2007, 370–373 (2007). [↩]
- M. Kachuee, M.M. Kiani, H. Mohammadzade, and M. Shabany. Cuff-less high-accuracy calibration-free blood pressure estimation using pulse transit time. in 2015 IEEE International Symposium on Circuits and Systems (ISCAS), pp.1006–1009 (2015). [↩] [↩]
- W. Wang. Data-Driven Methodologies for Cuff-Less Blood Pressure Estimation. M.S. Rutgers The State University of New Jersey, School of Graduate Studies (2021). [↩]
- S. González, W.-T. Hsieh, and T.P.-C. Chen. A benchmark for machine-learning based non-invasive blood pressure estimation using photoplethysmogram. Sci Data 10(1), 149 (2023). [↩] [↩]
- G. Thambiraj, U. Gandhi, and U. Mangalanathan. Chapter 4 – Data-driven models for cuffless blood pressure estimation using ECG and PPG signals, in Edge-of-Things in Personalized Healthcare Support Systems, edited by R. Sridhar, G.R. Gangadharan, M. Sheng, and R. Shankaran. Academic Press, pp. 77–113 (2022). [↩]
- M.R. Mohebbian, A. Dinh, K. Wahid, and M.S. Alam. Blind, Cuff-less, Calibration-Free and Continuous Blood Pressure Estimation using Optimized Inductive Group Method of Data Handling. Biomedical Signal Processing and Control 57, 101682 (2020). [↩]
- B. Huang, W. Chen, C.-L. Lin, C.-F. Juang, and J. Wang. MLP-BP: A novel framework for cuffless blood pressure measurement with PPG and ECG signals based on MLP-Mixer neural networks. Biomedical Signal Processing and Control 73, 103404 (2022). [↩] [↩]
- L. Wang, S. Tian, and R. Zhu. A new method of continuous blood pressure monitoring using multichannel sensing signals on the wrist. Microsyst Nanoeng 9(1), 1–10 (2023). [↩]
- G. Slapničar, N. Mlakar, and M. Luštrek. Blood Pressure Estimation from Photoplethysmogram Using a Spectro-Temporal Deep Neural Network. Sensors 19(15), 3420 (2019). [↩]
- F. Schrumpf, P. Frenzel, C. Aust, G. Osterhoff, and M. Fuchs. Assessment of Non-Invasive Blood Pressure Prediction from PPG and rPPG Signals Using Deep Learning. Sensors 21(18), 6022 (2021). [↩]
- A. Tazarv, and M. Levorato. A Deep Learning Approach to Predict Blood Pressure from PPG Signals. 2021 43rd Annual International Conference of the IEEE Engineering in Medicine & Biology Society (EMBC), 5658–5662 (2021). [↩]
- N.Q. Mahardika T, Y.N. Fuadah, D.U. Jeong, and K.M. Lim. PPG Signals-Based Blood-Pressure Estimation Using Grid Search in Hyperparameter Optimization of CNN–LSTM. Diagnostics 13(15), 2566 (2023). [↩]
- A. Vaswani, N. Shazeer, N. Parmar, J. Uszkoreit, L. Jones, A.N. Gomez, Ł. Kaiser, and I. Polosukhin. Attention is all you need. in Proceedings of the 31st International Conference on Neural Information Processing Systems, Curran Associates Inc., Red Hook, NY, USA, pp. 6000–6010 (2017). [↩]
- Y. Chu, K. Tang, Y.-C. Hsu, T. Huang, D. Wang, W. Li, S.I. Savitz, X. Jiang, and S. Shams, Non-invasive arterial blood pressure measurement and SpO2 estimation using PPG signal: a deep learning framework. BMC Medical Informatics and Decision Making 23(1), 131 (2023). [↩] [↩]
- A.E.W. Johnson, T.J. Pollard, L. Shen, L.H. Lehman, M. Feng, M. Ghassemi, B. Moody, P. Szolovits, L. Anthony Celi, and R.G. Mark, “MIMIC-III, a freely accessible critical care database,” Sci Data 3(1), 160035 (2016). [↩]
- Y.A. Peprah, J.Y. Lee, and S.D. Persell. Validation testing of five home blood pressure monitoring devices for the upper arm according to the ISO 81060-2:2018/AMD 1:2020 protocol. J Hum Hypertens 37(2), 134–140 (2023). [↩] [↩]
- K.B. Kim, and H.J. Baek. Photoplethysmography in Wearable Devices: A Comprehensive Review of Technological Advances, Current Challenges, and Future Directions. Electronics 12(13), 2923 (2023). [↩]
- S.M.A. Iqbal, I. Mahgoub, E. Du, M.A. Leavitt, and W. Asghar. Development of a wearable belt with integrated sensors for measuring multiple physiological parameters related to heart failure. Sci Rep 12(1), 20264 (2022). [↩]


