
Abstract
Declining fertility rates in the United States present complex challenges for healthcare planning, economic stability, and reproductive justice. While prior demographic research has documented these shifts, relatively few studies have employed interpretable machine learning methods that combine forecasting accuracy with transparency. This study examines fertility dynamics in California and Texas from 1973 to 2020, applying artificial intelligence (AI) models to project future birth totals and evaluate reproductive health indicators. Using data obtained from the Open Science Framework, the Prophet time-series model was applied to forecast annual births through 2030 and benchmarked against a linear regression baseline. Prophet consistently outperformed regression, yielding substantially lower error in both states (California: RMSE = 6,231.41, MAPE = 0.83%; Texas: RMSE = 8,625.96, MAPE = 1.84%). To enhance interpretability, XGBoost regression combined with SHapley Additive exPlanations (SHAP) quantified the relative influence of predictors. Miscarriage totals, abortion access, and state-level variation emerged as the most influential drivers of fertility outcomes. Forecasts for both states suggest continued long-term declines in births, punctuated by short-term oscillations in the late 2020s, which may reflect the influence of policy or economic volatility. These results underscore the importance of combining forecasting accuracy with interpretability. By integrating Prophet with SHAP, this study provides transparent, data-driven insights into the demographic and policy factors shaping reproductive outcomes. The findings demonstrate the potential of explainable AI to inform healthcare planning, guide reproductive health policy, and support equitable responses to demographic change.
Keywords: fertility forecasting, reproductive health, time-series modeling, SHAP (SHapley Additive exPlanations), Prophet, XGBoost, Root Mean Squared Error (RMSE), Mean Absolute Percentage Error (MAPE), Linear regression
Introduction
Fertility rates1 in the United States have been steadily declining for several decades, raising urgent questions about demographic sustainability, economic growth, and reproductive justice. Lower fertility rates1 influence multiple dimensions of society, including workforce participation, healthcare system planning, and population structure. As policymakers and healthcare providers grapple with these long-term shifts, there is growing recognition of the need for more precise forecasting tools2 that can illuminate both the direction of fertility trends and the factors driving them.
Prior research has identified several contributors to fertility decline, including contraceptive use, abortion access, socioeconomic conditions, and cultural shifts such as delayed childbearing. However, most of this work has relied on descriptive statistics or traditional forecasting models2 that often lack the transparency needed to interpret underlying drivers. Furthermore, many studies have not fully connected observed fertility patterns to the broader policy landscape, including watershed legal decisions like Roe v. Wade (1973)3 and Planned Parenthood v. Casey (1992)4, or more recent changes in reproductive healthcare access.
Artificial intelligence (AI) and machine learning provide new opportunities to address these gaps. Unlike traditional methods, interpretable AI models not only enhance predictive precision but also reveal the relative influence of social, medical, and policy factors on fertility outcomes. SHapley Additive exPlanations (SHAP)5, for example, allow researchers and policymakers to examine which predictors exert the strongest influence on model outputs, offering insights that are both statistically grounded and actionable.
This study applies time-series forecasting2 and interpretable AI to fertility data from California and Texas spanning nearly five decades (1973–2020). These two states provide instructive contrasts: California with its comparatively broad reproductive healthcare access, and Texas with more restrictive policies and demographic volatility. The study has three main objectives:
- Forecast annual birth totals in California and Texas from 2021–2030 using the Prophet6 model.
- Identify and interpret the most influential reproductive health predictors using SHAP5 applied to XGBoost7 regression.
- Evaluate model accuracy against a linear regression baseline using RMSE8 and MAPE9.
By integrating forecasting accuracy2 with interpretability, this research advances the study of fertility decline beyond descriptive analysis. It contributes to demographic and public health scholarship by providing transparent, data-driven insights into how healthcare access, policy environments, and demographic change collectively shape reproductive outcomes.
Methodology
This study employed an observational, cross-sectional, and retrospective research design. Rather than intervening or manipulating variables, the study analyzed historical fertility-related data to uncover patterns and generate forecasts. This design was chosen to capture long-term demographic trends and evaluate predictive modeling performance without the constraints of experimental research.
No human participants were directly involved. The sample consisted of state-level reproductive health statistics for California and Texas spanning 1973–2020. Data included annual totals of births, abortions, pregnancies, and miscarriages. Because the dataset was aggregated, anonymized, and publicly available, there were no individual-level demographic identifiers such as age, race, or income.
Data were obtained from the Open Science Framework (OSF)10 U.S. fertility measures dataset (1973–2020). This repository compiles official state-level statistics from government sources such as the CDC11, NCHS (National Center for Health Statistics)12, and state public health departments13, ensuring historical consistency and reproducibility. The dataset is freely available for download in CSV format from the OSF10 platform. No new surveys, experiments, or recruitment were conducted; the study relied entirely on archival data.
Variables and Measurements:
- Forecast Variable: Annual total births (1973–2020).
- Predictor Variables: Abortion totals, miscarriage totals, pregnancy rates, abortion rates, and state identifiers.
- Measurement Tools: Prophet6 (time-series forecasting2), XGBoost7 (machine learning regression), and SHAP5 (interpretability and feature importance).
- Evaluation Metrics: Root Mean Squared Error (RMSE)8 and Mean Absolute Percentage Error (MAPE)9 were used to assess predictive accuracy.
Software and Environment:
Analyses were performed in Python (version 3.9). All scripts were run in Jupyter Notebook. Required open-source libraries included:
- pandas (for data cleaning and manipulation)
- numpy (for mathematical operations)
- prophet6 (time-series forecasting2, installed via pip install prophet)
- scikit-learn (for model validation and baseline regression)
- xgboost7 (machine learning regression, installed via pip install xgboost)
- shap5 (interpretability, installed via pip install shap)
- matplotlib and seaborn (for data visualization).
Procedure
1. Data Download and Preparation
- a) Download fertility data CSV files from OSF10 .
- b) Import data into Python using pandas.
- c) Filter the dataset to include only California and Texas (1973–2020).
- d) Ensure consistency of column names and convert all date fields into datetime format.
- e) Handle missing values by forward-filling (ffill) or interpolation where appropriate.
- f) Create separate time-series objects for births, abortions, miscarriages, and pregnancies.
2. Forecasting with Prophet6
- a) Prophet requires two columns: ds (date) and y (value). Data were reformatted accordingly.
- b) Separate Prophet models were trained for each variable (births, abortions, miscarriages, pregnancies).
- c) Forecast horizons were set to extend through 2030.
- d) Prophet decomposed the series into trend and seasonal components, producing forward projections with confidence intervals.
3. Regression Modeling with XGBoost7
- a) Predictor dataset was structured with births as the dependent variable (y) and abortion totals, miscarriage totals, pregnancy rates, and abortion rates as independent variables (X).
- b)Train-test splits (80/20) were used for evaluation.Hyperparameters were tuned via grid search (max_depth, eta, n_estimators).
- c) Predictor dataset was structured with births as the dependent variable (y) and abortion totals, miscarriage totals, pregnancy rates, and abortion rates as independent variables (X).Train-test splits (80/20) were used for evaluation.Hyperparameters were tuned via grid search (max_depth, eta, n_estimators).
- d) XGBoost regression was applied to model non-linear relationships.
4. Interpretability with SHAP5
- a) SHAP values were calculated for each predictor.
- b) Feature importance plots and dependence plots were generated to interpret how predictors influenced birth totals.
- c) Results quantified which reproductive health indicators most strongly contributed to the model’s predictions.
5. Validation Against Baseline Models
- a) A linear regression model was trained as a baseline.
- b) RMSE8 and MAPE9 were calculated for Prophet6 , XGBoost7 , and baseline models.
- c) Model performance comparisons ensured that improvements were attributable to advanced methods rather than chance.
Analysis combined time-series forecasting2 and explainable AI. Prophet6 decomposed time-series into trend and seasonal components, enabling forward projections. XGBoost7 modeled non-linear relationships among predictors, while SHAP5 quantified each feature’s contribution to predictions. Visualization of forecasts and SHAP5 values ensured interpretability.
Because the dataset was public, anonymized, and aggregated at the state level, no institutional review board (IRB) approval was required. No private medical records or identifiable personal data were used. The study adhered to principles of responsible AI research, emphasizing transparency, fairness, and interpretability. Potential biases due to state-level policy differences and dataset limitations were addressed through model validation and explainability techniques.
Results

The abortion rate rose steadily after Roe v. Wade (1973)3 , peaking in the late 1980s before entering a long-term decline. This trend reflects changing access to reproductive healthcare, policy restrictions in the 1990s, and the wider adoption of effective contraception. Error bars capture reporting variability across time.
Figure 1 illustrates California’s abortion14 rate over time, which rose sharply after Roe v. Wade (1973)3, peaked in the late 1980s, and declined steadily from the 1990s onward. This trend reflects the expansion and subsequent regulation of abortion access, as well as the growing influence of contraception and reproductive health policies.
From a modeling perspective, these historical patterns are essential to both Prophet6 and XGBoost7. Prophet captures the long-term decline and short-term fluctuations, using past variability to forecast future abortion14 totals. Meanwhile, XGBoost incorporates abortion totals and rates as predictor variables, with SHAP5 analysis confirming their strong influence on birth outcomes. This connection demonstrates how shifts in abortion access—visible in Figure 1—directly inform the model’s ability to predict fertility dynamics.

Pregnancy rates increased through the late 1970s, stabilized in the 1980s, and then began a steady decline from the mid-1990s onward. These shifts reflect improvements in contraception, public health campaigns, socioeconomic changes, and delayed childbearing.
Figure 2 shows pregnancy rates increasing through the late 1970s, stabilizing in the 1980s, and declining consistently from the mid-1990s onward. These changes align with improved access to contraception, delayed childbearing, and evolving cultural and socioeconomic pressures.
Prophet6 models these declines by decomposing the time series into trend and seasonal components, producing forward projections that reflect the continuation of these downward trajectories. In XGBoost7, pregnancy rates serve as a key predictor variable; SHAP 5 values demonstrate their consistent contribution to explaining birth totals. Thus, the trend captured in Figure 2 not only reveals historical shifts but also strengthens model interpretability by showing how reductions in pregnancies correlate with future declines in births.
Synthesis of graphs
Together, Figures 1 and 2 demonstrate a parallel decline in abortion14 and pregnancy rates after the 1990s, reflecting broader improvements in contraception, family planning, and reproductive autonomy. The simultaneous reduction in unintended pregnancies and abortion demand highlights how structural changes in healthcare and policy shape multiple aspects of reproductive behavior.
For Prophet6, the alignment of declining abortion14 and pregnancy rates reinforces the model’s forecasts of sustained long-term declines in births, with only minor rebounds. For XGBoost7, the synthesis underscores why abortion and pregnancy variables are among the most influential predictors: SHAP analysis5 shows that both features strongly shape model outputs, and their joint decline helps explain the projected decreases in future fertility. By linking these two indicators, the models capture not only individual variable effects but also their combined impact on long-term demographic change.
Utilizing SHAP Library
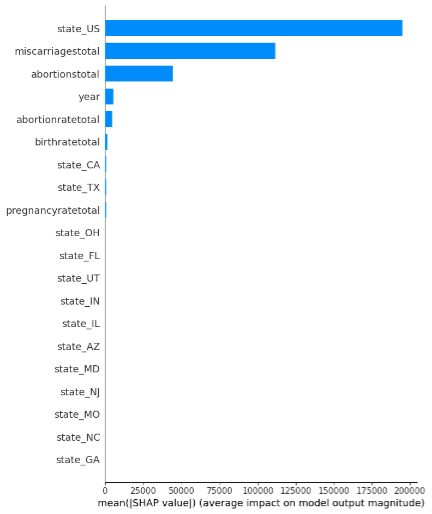
The machine learning model identified miscarriage totals, abortion access, and state-level differences as the most influential predictors of fertility outcomes. SHAP values quantify how strongly each variable contributes to the predictions.
This is a SHAP (SHapley Additive exPlanations)5 summary plot visualizing feature importance in a machine learning model. The x-axis represents the mean absolute SHAP value, indicating the average contribution of each feature to the model’s predictions. The y-axis lists the features in descending order of their importance.
The most impactful features on the model’s output are:
- state_US
- miscarriagetotal
- abortionstotal
The SHAP5 plot highlights the significant influence of factors like state US, miscarriage total, and abortion total on a machine learning model’s predictions. These variables can be tied to broader public health concerns, access to healthcare, and policy differences across states. For instance, the importance of abortion total and abortion rate total may reflect the ongoing impact of restrictive abortion14 laws and disparities in access to reproductive healthcare. Following the overturning of Roe v. Wade3, many states implemented strict abortion laws, creating significant disparities in access to abortion services. This ties directly to current debates surrounding reproductive rights, federal vs. state policies, and the challenges many individuals face in obtaining care.
Similarly, miscarriage total15 being a key factor in the model could indicate disparities in access to maternal healthcare, highlighting broader systemic issues such as rising maternal mortality16 rates and inconsistent quality of care. Current events, such as the ongoing efforts to expand Medicaid coverage for maternal care and postpartum support, align with this insight. Meanwhile, the prominence of state_US underscores how state-specific policies, healthcare systems, and cultural differences impact health outcomes. This ties into larger discussions about the need for consistent, equitable healthcare access across all states, regardless of state-level policies. To mitigate these issues, several strategies can be implemented. First, expanding access to reproductive healthcare is crucial. This can include increasing funding for clinics that offer affordable and comprehensive services, such as prenatal care, miscarriage management, and abortion services, especially in underserved areas. Supporting telemedicine for reproductive health can also help bridge access gaps in states with restrictive laws. Additionally, advocating for federal policies to ensure equitable access to healthcare across all states is vital, as state-level disparities often leave many without essential care.
Education and awareness campaigns also play a key role in addressing these issues. Public education initiatives can help reduce stigma around reproductive health while providing accurate, culturally relevant information to diverse communities. Investments in maternal and child health programs are another important step. Programs that offer prenatal care, miscarriage15 support, and postpartum assistance, particularly in underserved areas, can improve outcomes significantly. Collaborating with local organizations to provide holistic care can also help address the needs of vulnerable populations.
Finally, addressing the social determinants of health is essential for long-term change. Tackling root causes like poverty, lack of education, and inadequate healthcare infrastructure can reduce disparities in reproductive health outcomes. Partnerships between healthcare providers and social services can create integrated systems of care that address these underlying issues. By leveraging data-driven insights, advocacy groups and policymakers can create compelling narratives that drive systemic change, ensuring better health outcomes for all individuals.

The influence of miscarriages on the model increased over time, reflecting both improvements in reporting and possible rises in high-risk pregnancies associated with delayed childbearing and chronic health conditions.
This highlights the SHAP5 values for the year feature, with the color gradient representing the total number of miscarriages15 (miscarriage total). The increasing SHAP values over time indicate that the influence of year on the model’s predictions has grown. This trend could reflect improvements in data collection, changes in healthcare systems, or shifts in societal attitudes toward reproductive health. The concentration of high miscarriage totals (marked in red) in recent years might point to factors like delayed pregnancies, rising chronic health conditions, or greater awareness and reporting accuracy.
This graph underscores the importance of considering how historical and temporal trends impact reproductive health. For example, advancements in healthcare technologies or policies may have improved reporting and accessibility, but the increase in high-risk pregnancies due to lifestyle or medical factors also warrants attention.
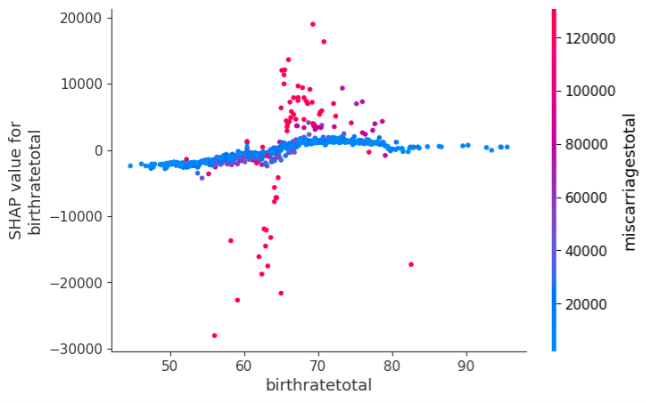
Miscarriage totals are linked to subtle variations in birth rate predictions, suggesting disparities in healthcare access and maternal health outcomes even in populations with average birth rates.
This examines the SHAP5 values for birth rate total, showing its relationship to birth rates and miscarriage15 totals. The relatively flat distribution of SHAP values suggests that birthrate has a more limited direct impact on the model’s predictions compared to year. However, clusters of red points (indicating higher miscarriage totals) near average birthrate levels suggest a nuanced relationship. This could indicate disparities in healthcare access, social or economic conditions, or other confounding factors that influence both birth rates and miscarriages.
This graph highlights the need to further explore systemic inequities affecting birth and miscarriage15 rates. For example, communities with average birthrates may still face barriers to adequate prenatal care or education about reproductive health, contributing to higher miscarriage rates.

A negative relationship indicates that higher abortion rates reduce the feature’s predictive importance. Clusters of high miscarriage totals at moderate abortion rates point to overlapping healthcare access issues.
This graph plots the SHAP5 values for the feature abortion rate total against the abortion14 rate. The color gradient reflects the total number of miscarriages15 (miscarriagetotal). The negative correlation between SHAP values and abortion rate suggests that higher abortion rates may reduce the feature’s importance in the model’s predictions. However, clusters of red points (high miscarriage totals) around moderate abortion rates highlight a potential overlap of factors influencing both abortions and miscarriages, such as healthcare access or societal norms regarding family planning.
This graph points to the need for nuanced analysis of how abortion14 rates and miscarriage15 trends intersect, focusing on improving healthcare systems that address both outcomes comprehensively.

Pregnancy rate contributes consistently to model predictions, but clusters of higher miscarriage totals reveal underlying health disparities, particularly in prenatal care access and maternal health conditions.
This graph illustrates the SHAP5 values for pregnancy rate total against pregnancy rates, again with miscarriage15 totals as the color gradient. The relatively uniform SHAP values indicate that pregnancy rates contribute consistently to the model’s predictions, regardless of fluctuations in the number of pregnancies. However, the concentration of red points around average pregnancy rates could suggest underlying stressors or risk factors that increase miscarriage totals even in regions or groups with typical pregnancy rates.
This insight highlights the importance of addressing underlying causes of miscarriages15, such as prenatal care quality or maternal health conditions, across diverse populations.

Miscarriage totals are highly predictive, with SHAP values increasing alongside miscarriage counts. This emphasizes the central role of miscarriage trends in shaping reproductive outcomes.
The final graph shows a strong linear correlation between the SHAP5 values and the miscarriage total feature, with a color gradient representing the total number of abortions (abortionstotal). The increasing SHAP values alongside miscarriage totals indicate that this feature is highly predictive in the model. High miscarriage totals (red points) are aligned with higher SHAP values, showing their dominant influence on the model’s predictions.
This graph emphasizes the central role of miscarriage data in reproductive health models. It calls for targeted interventions in areas with high miscarriage rates, ensuring that affected individuals receive adequate healthcare, counseling, and preventive measures.
Time Forecasting Model
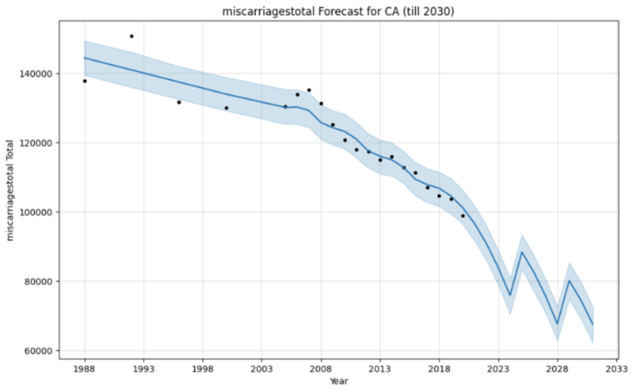
The Prophet6 forecasts for California and Texas consistently project long-term declines across births, abortions14, miscarriages15, and pregnancies through 2030. Although both states follow a downward trajectory, the patterns differ in magnitude and volatility. California’s outcomes generally display smoother declines with modest late-decade rebounds, while Texas shows sharper oscillations, reflecting its demographic volatility, restrictive reproductive health policies, and uneven access to care.

The forecast projects a continued decline in annual births, with oscillations between 2025 and 2030. The shaded area represents the uncertainty interval, which widens further into the future.
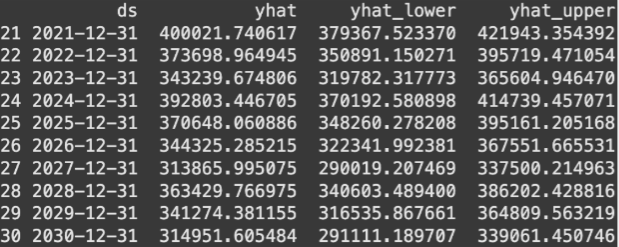
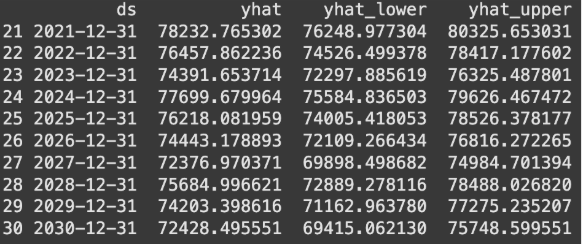
The table summarizes Prophet’s predictions, showing declining births with short-term rebounds around 2028–2029, reflecting possible sensitivity to economic and policy shifts.

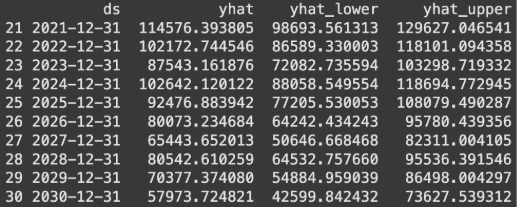
The forecast projects a gradual decline in annual births across Texas, with fluctuations between 2026–2029. The shaded region represents the 95% uncertainty interval, widening as the projection extends further into the future.

Tabular summary of Prophet’s predictions. While total births decline overall, short-term rebounds are visible around 2027–2028, suggesting sensitivity to external shocks such as policy shifts or economic changes.
In both states, birth totals are projected to decrease steadily, punctuated by fluctuations in the late 2020s. California shows relatively small oscillations, suggesting short-term rebounds that do not alter the overall downward trend. Texas, by contrast, exhibits sharper swings, with temporary recoveries around 2027–2028 followed by renewed declines. These dynamics suggest that external shocks—such as economic cycles, healthcare access, or immigration flows—may more strongly affect fertility outcomes in Texas.

The model projects a gradual decline in abortions, with minor fluctuations around 2025–2028. The shaded uncertainty interval widens further into the future, reflecting external policy and healthcare uncertainties.
Tabular summary of predicted abortion counts. Declines continue overall, though temporary rebounds appear in the late 2020s, suggesting sensitivity to policy changes and healthcare access.

The forecast shows overall declines in abortions across Texas, with short-term oscillations between 2026–2029. Policy restrictions and healthcare disparities may contribute to sharper fluctuations compared to California.

Tabular summary of projected abortion counts. While totals trend downward, the late 2020s display intermittent rebounds, highlighting Texas’s sensitivity to demographic and policy shocks.
Forecasts mirror the decline in births, with intermittent rebounds late in the decade. California’s trajectory reflects broader improvements in contraception, lower pregnancy rates, and demographic shifts such as delayed childbearing. Texas shows more volatility, where restrictive reproductive policies and disparities in healthcare access amplify fluctuations. These differences underscore how state-level policy environments directly shape reproductive outcomes.
Forecasted miscarriages show a steady long-term decline, with fluctuations around 2026–2029. The widening uncertainty interval suggests demographic and healthcare-related variability.

Tabular summary of predicted miscarriage totals. Projections indicate continued declines, but late-decade rebounds may reflect changing maternal health conditions or improved reporting.

The model predicts a general decline in miscarriages, with short-term increases around 2027–2028. The broader confidence interval suggests stronger susceptibility to healthcare and policy variability than California.
Tabular summary of projected miscarriage totals. Declines dominate the forecast, though late-decade rebounds point to potential fluctuations in maternal health outcomes.
Both states show a gradual decline with rebounds in the late 2020s, though California’s trajectory is smoother while Texas experiences greater variability. Miscarriage15 trends appear especially sensitive to maternal health factors, including delayed childbearing, chronic health conditions, and disparities in prenatal care. The widening confidence intervals highlight growing uncertainty tied to healthcare systems and demographic change.
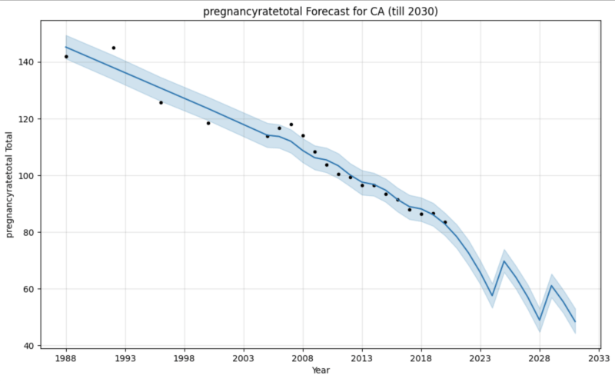
Pregnancy totals are forecasted to decline steadily, with small oscillations after 2026. The shaded interval highlights growing long-term uncertainty.
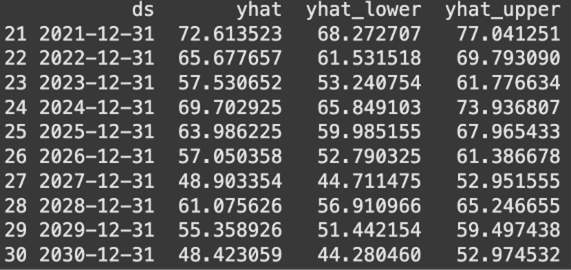
Tabular summary of predicted pregnancy totals. Projections show steady declines, with slight rebounds around 2028–2029 reflecting socioeconomic or healthcare shifts.

Pregnancy totals in Texas are forecasted to decline, with more pronounced fluctuations than California, particularly in 2026–2029.

Tabular summary of projected pregnancy totals. While long-term declines dominate, short-term rebounds underscore sensitivity to state-level policy and demographic change.
Pregnancy totals are projected to decline steadily in both states, with modest rebounds in the late 2020s. California’s declines are gradual and shaped by delayed family formation, economic pressures such as housing and childcare costs, and cultural shifts toward higher education and career prioritization. Texas shows sharper oscillations, influenced by restrictive reproductive health laws and uneven healthcare infrastructure. Immigration may buffer declines in Texas by sustaining a younger childbearing population, but policy barriers may offset these demographic advantages.
Synthesis of graphs
Taken together, the forecasts reveal a consistent long-term decline across fertility-related indicators in both states, with intermittent rebounds that do not alter the overall trajectory. California’s trends are relatively stable, while Texas exhibits more volatility due to demographic growth, restrictive policies, and healthcare inequities. Across both states, widening uncertainty intervals underscore the influence of unpredictable external factors, including economic recessions17, policy shifts, and public health crises. These findings highlight that while structural demographic shifts drive the overall decline, state-specific policy contexts amplify or moderate fluctuations.
Prophet Evaluation

Comparison of observed vs. predicted births highlights Prophet’s superior performance, with errors consistently smaller than linear regression. Prophet’s ability to capture nonlinear trends improves accuracy over traditional statistical baselines.

Error metrics (RMSE and MAPE) demonstrate Prophet’s advantage over linear regression, achieving an RMSE of 6,231.41 compared to 49,041.27 for linear regression. Prophet deviates by less than 1% on average from observed fertility outcomes.
To evaluate the accuracy of the Prophet6 forecasting model, its performance was compared against a simple linear regression baseline using two widely accepted time-series error metrics: Root Mean Squared Error (RMSE)8 and Mean Absolute Percentage Error (MAPE)9. Prophet achieved an RMSE of 6,231.41 and a MAPE of 0.83%, while linear regression produced a much higher RMSE of 49,041.27 and MAPE of 10.13%. These results indicate that Prophet’s predictions were very close to the actual fertility counts, with deviations averaging less than 1% relative to the observed values. In contrast, linear regression struggled to capture the dynamics of the data, resulting in large errors that reflect its inability to model nonlinear trends and seasonal variation.
The substantial gap in performance highlights Prophet’s6 strength as a time-series forecasting tool, particularly for demographic datasets where fertility outcomes are shaped by both long-term trends and fluctuations in response to policy and economic conditions. Prophet’s capacity to incorporate seasonality and uncertainty intervals enables it to outperform simpler models that assume linear change over time. The validation results reinforce that Prophet provides a reliable forecast of California’s declining fertility trends, supporting its use as a robust model for anticipating demographic shifts and informing healthcare and policy planning.
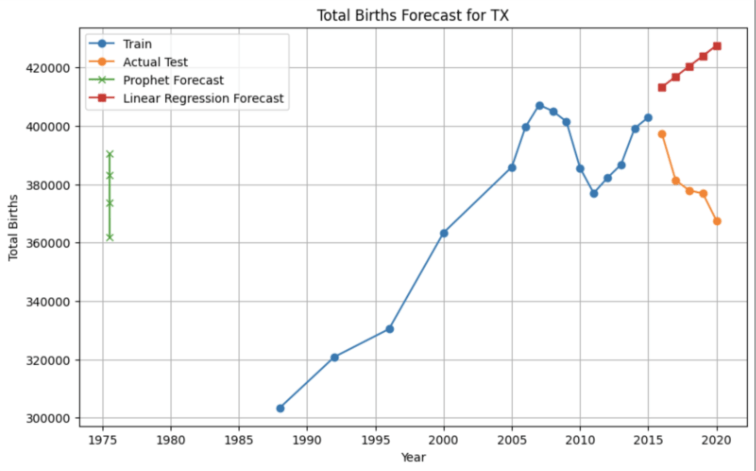
Observed vs. predicted births show Prophet’s closer alignment with actual fertility patterns in Texas, while linear regression produces greater deviations and fails to capture short-term oscillations.

Evaluation metrics show Prophet outperforming linear regression (RMSE: 8,625.96 vs. 42,771.15; MAPE: 1.84% vs. 10.68%), confirming the model’s reliability in a state with different demographic and policy contexts.
To validate the accuracy of the Prophet6 model in Texas, forecasts were again compared against a linear regression baseline using RMSE8 and MAPE9. Prophet achieved an RMSE of 8,625.96 and a MAPE of 1.84%, whereas linear regression performed considerably worse, with an RMSE of 42,771.15 and a MAPE of 10.68%. These results show that Prophet was able to closely reproduce the observed fertility patterns in Texas, with average prediction errors under 2% of the actual values. In contrast, the linear regression model significantly misrepresented the data, reflecting its limitations in capturing nonlinear fertility dynamics.
The evaluation underscores Prophet’s6 superior ability to handle state-level fertility time series compared to simple baselines. Although Prophet’s error rates in Texas were slightly higher than those observed for California, they remain low enough to ensure that forecasts provide meaningful insights into demographic change. By capturing fluctuations and long-term decline more effectively than linear regression, Prophet offers a reliable approach to modeling future fertility trends in Texas, highlighting its robustness across different states with distinct demographic and policy contexts.
Discussion
This study combined machine learning and time-series forecasting to analyze fertility dynamics in California and Texas from 1973 to 2020 and to project future birth totals through 2030. The Prophet6 model revealed sustained long-term declines in fertility across both states, punctuated by fluctuations in the mid- to late 2020s that suggest temporary rebounds followed by continued decreases. California’s projections indicated relatively modest oscillations, while Texas displayed sharper variability, reflecting the state’s distinctive demographic growth, immigration dynamics, and restrictive reproductive policy environment.
Beyond forecasting, the integration of SHAP5 analysis with XGBoost7 regression identified miscarriage15 totals, abortion14 access, and state-level differences as the most influential predictors of fertility outcomes. These results emphasize how reproductive health trends are not only demographic in nature but also deeply intertwined with access to care and the sociopolitical landscape. The comparison between California and Texas underscores this point: while both states share a general downward fertility trajectory, the drivers and magnitude of decline vary according to policy context and healthcare availability.
The methodological contribution of this study lies in demonstrating how forecasting accuracy can be paired with interpretability. Prophet 6 outperformed linear regression in both states, with error rates under 2% of actual values, while SHAP5 provided transparent explanations of model predictions. Taken together, these approaches illustrate how interpretable AI can enrich demographic forecasting, supporting policymakers, healthcare providers, and researchers in anticipating fertility shifts and planning responsive interventions.
The study successfully met its objectives by generating accurate forecasts, identifying influential predictors, and demonstrating the utility of explainable AI for public health research. Nevertheless, limitations remain. The reliance on state-level aggregated data constrains generalizability, and long-term projections are inherently uncertain, subject to external shocks such as recessions17, legislative changes, or public health crises. Moreover, while SHAP5 illuminates associations, it does not establish causality, and results must therefore be interpreted with caution.
Future research should expand to multi-state or national datasets, incorporate socioeconomic and healthcare access variables, and explore hybrid models that combine demographic theory with advanced machine learning. Such approaches could further strengthen the balance between predictive power and interpretability.
Overall, this study demonstrates the potential of interpretable AI to deepen our understanding of fertility decline. As reproductive health in the United States continues to be shaped by evolving policies, economic conditions, and cultural shifts, transparent, data-driven forecasting tools2 like Prophet6 —combined with explainable methods such as SHAP5 —offer critical guidance for equitable healthcare planning, resource allocation, and policy design.
References
- Livingston, G. (2019). Why is the U.S. fertility rate falling? Pew Research Center. https://www.pewresearch.org/short-reads/2019/05/22/why-is-u-s-fertility-rate-falling [↩] [↩]
- Taylor, S. J., & Letham, B. (2018). Forecasting at scale. The American Statistician, 72(1), 37–45. https://doi.org/10.1080/00031305.2017.1380080 [↩] [↩] [↩] [↩] [↩] [↩] [↩] [↩]
- Roe v. Wade, 410 U.S. 113 (1973). Oyez. https://www.oyez.org/cases/1971/70-18 [↩] [↩] [↩] [↩]
- Planned Parenthood v. Casey, 505 U.S. 833 (1992). Human Life International. https://www.hli.org/resources/planned-parenthood-vs-casey/ [↩]
- Lundberg, S. M., & Lee, S.-I. (2017). A unified approach to interpreting model predictions. In Advances in Neural Information Processing Systems (NeurIPS). https://shap.readthedocs.io [↩] [↩] [↩] [↩] [↩] [↩] [↩] [↩] [↩] [↩] [↩] [↩] [↩] [↩] [↩] [↩] [↩] [↩] [↩] [↩] [↩]
- Hyndman, R. J., & Athanasopoulos, G. (2021). Forecasting: Principles and practice (3rd ed.). OTexts. https://otexts.com/fpp3/prophet.html [↩] [↩] [↩] [↩] [↩] [↩] [↩] [↩] [↩] [↩] [↩] [↩] [↩] [↩] [↩] [↩] [↩]
- Chen, T., & Guestrin, C. (2016). XGBoost: A scalable tree boosting system. In Proceedings of the 22nd ACM SIGKDD International Conference on Knowledge Discovery and Data Mining (pp. 785–794). ACM. https://doi.org/10.1145/2939672.2939785 [↩] [↩] [↩] [↩] [↩] [↩] [↩] [↩] [↩] [↩]
- University of Illinois Urbana-Champaign. (n.d.). Root mean square error (RMSE) – Statistics with Python. Discovery Partners Institute. https://discovery.cs.illinois.edu/guides/Statistics-with-Python/rmse/ [↩] [↩] [↩] [↩] [↩]
- Scikit-learn developers. (n.d.). sklearn.metrics.mean_absolute_percentage_error. https://scikit-learn.org/stable/modules/generated/sklearn.metrics.mean_absolute_percentage_error.html [↩] [↩] [↩] [↩] [↩]
- OSF. (2020). Fertility rate measures by state and year (1973–2020). Open Science Framework. https://osf.io/duj6a [↩] [↩] [↩]
- Centers for Disease Control and Prevention. (2023). National vital statistics reports. https://www.cdc.gov/nchs/nvss [↩]
- National Center for Health Statistics. (2020). Births: Final data for 2020. https://www.cdc.gov/nchs/data/nvsr/nvsr70/nvsr70-17.pdf [↩]
- Hamilton, B. E., Martin, J. A., Osterman, M. J. K., & Rossen, L. M. (2022). Births: Provisional data for 2021 (Vital Statistics Rapid Release; No. 20). National Vital Statistics System. https://www.cdc.gov/nchs/nvss/vsrr/births.htm [↩]
- Guttmacher Institute. (2023). State abortion policy landscape. https://www.guttmacher.org/state-policy [↩] [↩] [↩] [↩] [↩] [↩] [↩] [↩] [↩]
- Rossen, L. M., Ahrens, K. A., & Branum, A. M. (2018). Trends in risk of pregnancy loss among U.S. women, 1990–2011. Paediatric and Perinatal Epidemiology, 32(1), 19–29. https://doi.org/10.1111/ppe.12417 [↩] [↩] [↩] [↩] [↩] [↩] [↩] [↩] [↩] [↩] [↩] [↩]
- Petersen, E. E., Davis, N. L., Goodman, D., Cox, S., Syverson, C., Seed, K., … Barfield, W. (2019). Racial/ethnic disparities in pregnancy-related deaths—United States, 2007–2016. MMWR Morbidity and Mortality Weekly Report, 68(35), 762–765. https://doi.org/10.15585/mmwr.mm6835a3 [↩]
- Morgan, S. P., Cumberworth, E., & Wimer, C. (2011). The Great Recession’s influence on fertility, marriage, divorce, and cohabitation. In R. R. Rugh (Ed.), The Great Recession (pp. 220–245). Russell Sage Foundation. [↩] [↩]


