
Abstract
Heart Disease is the leading cause of death worldwide, and improving the diagnostic accuracy of cardiac imaging and intervention can help improve outcomes and decrease mortality. Artificial intelligence and machine learning are revolutionizing healthcare by enhancing efficiency and precision in medical diagnostics and personalizing treatment. This research investigates the effectiveness of deep learning models combined with loss functions in the prediction of the location of structural abnormalities in the heart. In our research, we compared the U-Net model with the Convolution Neural Network (CNN) model in cardiac segmentation, and combined it with different loss functions to test their efficacy. We trained the models on our dataset of 2052 MRI training image slices and tested with 219 MRI image slices. Accuracy metrics as well as a visual comparison are used to analyze the performance and results of the model. We observed the U-Net with Dice-loss had a high accuracy of 99.79%, a precision of 78.46%, recall of 77.12%, and F1 score of 0.7784 which were all superior compared to the other models tested. The U-Net model optimized with the Dice Loss function outperformed the CNN model and other loss functions like Binary and Weighted Cross Entropy. Furthermore, we generated 3D scannable images of the heart from 2D input, label, and prediction images with potential to improve treatments. Overall, the improved accuracy of U-Nets and Dice-loss in cardiac segmentation can result in early and cost-effective diagnosis of heart disease and can have a positive impact on patients’ lives.
Keywords: Heart Disease, Deep Learning, Artificial Intelligence, Machine Learning, Neural Networks, MRI Images
Introduction
According to the CDC, one person dies every 33 seconds from a cardiovascular-related disease in the United States1. Early, cost effective and accurate diagnosis is crucial to improve treatment outcomes. Magnetic Resonance Imaging, or MRIs, are an important imaging modality in the field of medicine that helps detect structural abnormalities in the human body. However, the process of diagnosis involves manual image segmentation and interpretation of hundreds of images by radiologists, which can be labor-intensive, time-consuming, expensive, and prone to human error. Automation of this process by deep learning models not only helps with rapid diagnosis but also enhances the accuracy by minimizing human errors and interobserver variability. The integration of Artificial Intelligence (AI) in medical imaging is transforming the landscape of healthcare by early and rapid detection of abnormalities with enhanced accuracy, thereby improving care delivery and treatment outcomes.
Image segmentation is a complex process that is critical to successful image interpretation. The objective of this study is to compare deep learning models for the segmentation of cardiac MRI images and automated diagnosis. The U-Net model and CNN model have proven to be highly successful in the field of biomedical imaging, as referenced in Related Work.
CNNs tend to struggle with image segmentation tasks because they are not designed for pixel-level predictions, leading to inaccurate segmentation. In contrast, accurate imaging relies on the labeling of each pixel in the image. The U-Net model addresses this challenge, is more reliable and has been highly successful in the biomedical field. Ronneberger et al address the fact that the U-Net model architecture is more efficient for the pixel-level segmentation tasks, a key reason for our choice of the model over similar deep learning networks2. U-Net models employ an encoder-decoder structure with skip connections that preserve information and localization accuracy. It also has had many proven successes with medical imaging and segmentation tasks. Unlike other models, the U-Net is highly accurate due to its ability to read the high dimensionality of medical images and to read and analyze every pixel. Due to these reasons, we selected the U-Net as our primary model and to establish a baseline comparison we compared it to the CNN model before optimizing it with various loss functions.
In comparison with the Res-UNet model, we decided to use the U-net model as it is found to be more efficient in the realm of this study. The Res-UNet model requires more complex parameter tuning, which was nonessential in this investigation. Res-Unet, a variant of U-net, incorporates residual connections which increases the architectural complexity and requires extensive tuning to achieve the optimal performance. Our study prioritizes model efficiency, which the U-Net model achieves for segmentation tasks all while allowing for faster training and effective integration of our loss function comparison. We individually trained each of the models with our training dataset of MRI images and analyzed its performance using its accuracy metrics as well as by visualizing the model’s performance in generating an accurate image of the label of the diseased portion of the heart. These findings can help enhance diagnostic precision and efficiency and help formulate treatment plans.
While our model proved to be effective, our study was limited to MRI images of the left atrial septal defects on which it was trained. We do expect the same approach to work for other cardiac abnormalities, but this would require additional research and further clinical testing.
This study’s key contribution is to compare the efficacy of the U-Net and CNN models when combined with the dice, binary cross-entropy, and weighted cross-entropy loss functions to accurately and cost-effectively segment structural abnormalities and predict the diseased portions in the heart from cardiac MRIs. The research area of incorporating diverse loss functions with deep learning models is an emerging opportunity. An additional contribution of the study is the generation of a 3-D image of the heart and the diseased segment from the MRIs, which can provide additional valuable data and enable effective treatment.
Related Work
Traditional diagnostic and imaging techniques often face limitations in segmentation and precise localization. Many different studies have been conducted on the application of AI in medical imaging that can enhance the diagnostic utility, specifically in cardiac disease. Daubert et al emphasize the remarkable evolutions in cardiac imaging techniques, and how these advancements can significantly improve non-invasive techniques to treat cardiovascular diseases3. Mohan et al. demonstrate how machine learning techniques can help predict heart disease and cardiac abnormalities early on, with the Hybrid Random Forest model4. Shah et al. explore this idea by using Naive Bayes, decision tree, and K-Nearest neighbor, establishing that K-nearest neighbor has the highest accuracy5. Ramalingam et al. support these techniques, while adding supervised learning algorithm, Support Vector Machines (SVM) to the list, as notable models and algorithms for heart disease prediction6. However, while these models are useful for prediction, they do not address the complexity of the MRI images and lack the spatial resolution needed for the segmentation of cardiac MRIs, a problem that Deep Learning models address.
Specifically, CNNs have been used in medical imaging. Moeskops et al trained a CNN to segment tissues and the coronary arteries in MRI images7. However, Ronneberger et al address the fact that the U-Net model architecture is more efficient for the pixel-level segmentation tasks2. U-Net models are more efficient for improved precision and localization accuracy.
Methods
This research investigation was an experimental design. We studied the U-net model trained with the dice loss function, to accurately identify structural abnormalities in the heart. Using clinical MRI images, our model utilized real-world data to draw meaningful conclusions to improve diagnostic accuracy, which can lead to better treatment outcomes in patients.
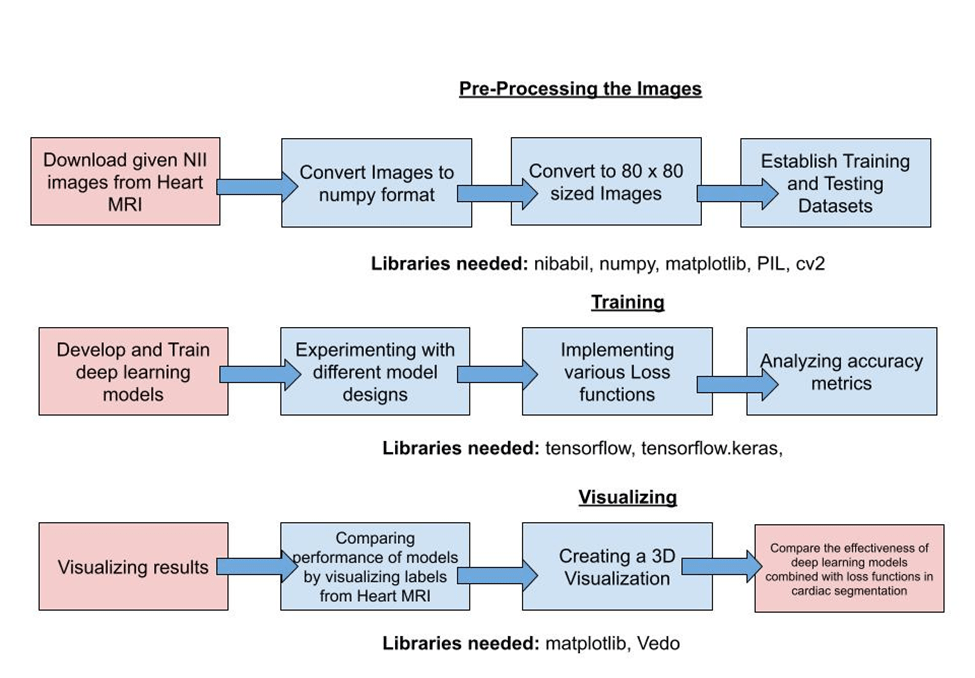
Our investigation consisted of three main steps: preprocessing the images, then training the given models on our images, and finally visualizing the results. From the King’s College dataset, we downloaded the images and converted them into a numpy array. We then resized the images to 80 x 80 pixels, and split the data into training and testing datasets. We trained our CNN and U-Net models, and implemented various loss functions. We evaluated the performance by analyzing the accuracy, precision, recall, and F1 score. Furthermore, we visualized the results using the matplotlib library, and finally, constructed a 3D image of the heart from MRI images.
Data Collection and Preparation
This dataset was provided by King’s College, London, United Kingdom8. It includes 30 MRI datasets covering the entire heart through various slices, in a single cardiac phase. According to the dataset source, the left atrium appendage, mitral plane, and portal vein end points were segmented manually by an expert. The images are in nii file types, an open file format by The Neuroimaging Informatics Technology Initiative (NIfTI), commonly used to store imaging data using imaging methods such as Magnetic Resonance Imaging. Each of the 30 datasets has approximately 80-140 slices of images, covering the full heart in one respiratory cycle, encapsulating a total of 2271 images in the dataset. The dataset has dimensions of 320 x 320 x 130 slices, approximately, for each file. We were only provided the labeled dataset for our training. Because of this constraint, we split this into a separate testing and training dataset, consisting of 28 nii files for the training and 2 nii files for the testing, an 80% to 20% split. Additionally, we resized our images to be 80 x 80 pixels so that it can be more comfortably trained with minimal errors, in optimal time. Each of the slices was treated as an individual sample in our dataset.
After data preprocessing, we experimented with different models and corresponding loss functions, including the CNN model, U-Net model, Dice Loss, Weighted and Binary Cross Entropy Loss functions.
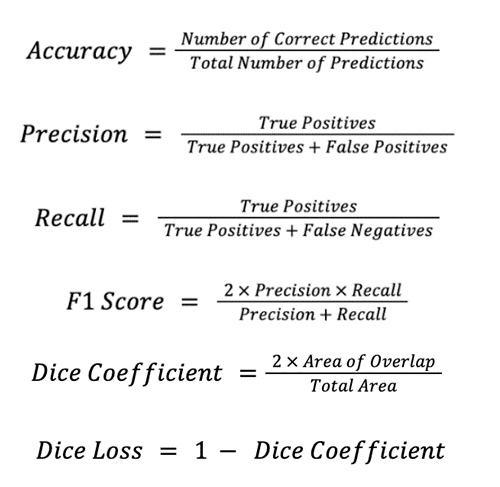
During training, we implemented a specific number of epochs to achieve the best-performing model. An epoch is a complete pass through the entire training dataset to help the algorithm learn. We also used specific metrics to analyze our results. Accuracy is the number of correct predictions, consisting of correct positive and negative predictions divided by the total number of predictions. Precision is the number of true positive results divided by the number of all positive results. Recall is the number of true positive results divided by the number of all samples that should have been identified as positive. The F1 score is 2 times the precision times the recall divided by the sum of precision and recall. Furthermore, Dice loss adapts the training to be sensitive to imbalance. The dice loss is defined as 1 minus the Dice Coefficient which is 2 times the area of overlap divided by the total area, which measures the area of overlap divided by the total area of the predicted and ground truth. The formulas for each of the accuracy metrics are as follows:
Neural Network Models
Convolutional Neural Network (CNN)
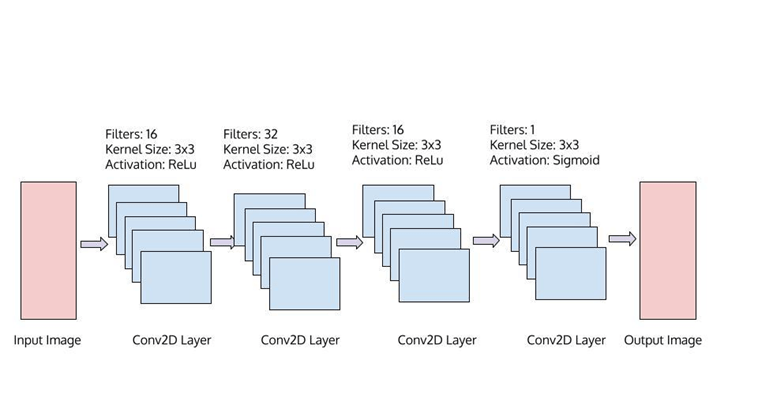
A Convolutional Neural Network (CNN) is a machine learning model which specializes in specific image identification. In our research, we used CNNs to properly identify the abnormalities in MRI heart images. CNNs are made up of multiple convolutional layers, and incorporate various weights for the model to understand the importance of the image segments and obtain the best results. The input, output, and hidden layers of the model alter, and learn the data. Specifically, the input layer is the data we feed or input to our model, containing the same number of neurons, as the number of features our input data has. Next, it is fed into the hidden layers, whose number of neurons can vary, and with matrix multiplication, learns the weights and biases for the data, which is followed by the activation functions. Weights and biases help the model recognize which parts of the image hold more value, and lead to more accurate results. Finally, the final output layer converts the output to a probability score which we can measure. The convolution, ReLU, and pooling layers, which are repeated many times, help activate features and simplify output to help the model learn to identify these features. The convolution layers activate features from the images, using a set of convolution filters. The ReLU, or rectified linear unit, layers maintain only positive values, by mapping the negative values to zero. This helps carry only the activated features forward to the next layer, maintains efficiency and optimizes training. Finally, pooling helps reduce the number of parameters the network needs to learn, which helps simplify the output by downsampling. Overall, this combination of layers, activation functions, and neurons help CNN model’s reach optimal and accurate results. Figure 2 shows the CNN model, including its parameters we used in our research. The CNN model consists of four Conv2D layers, each with a 3×3 kernel size. The first three have ReLu activation, and the first one has 16 filters, while the second one has 32 filters and the third one has 16. The final layer has one filter with Sigmoid activation.
U-Nets
U-Nets are a neural network architecture that are used for image segmentation, such as identifying diseased portions in the heart. In this research, we used U-Nets to perform the segmentation of cardiac images. Our U-Net model consists of Conv2D and MaxPool 2D layers. First, the input image of 80×80 pixels goes through a contracting path and encoding path with Conv2D layers and MaxPool Layers, followed by upsampling. In the end, it outputs the final segmentation image.
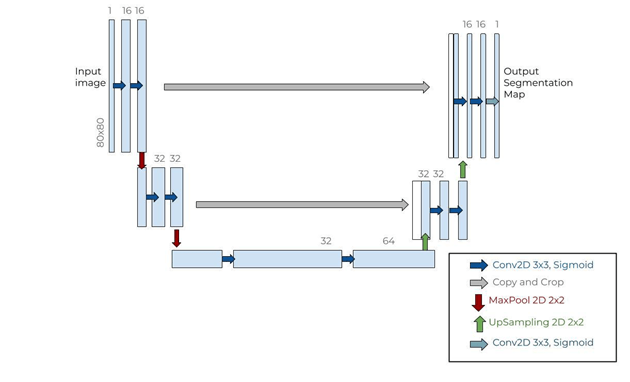
The U-Net architecture consists of a U shape path, including convolution and pooling layers, which enables precise localization of the labels and abnormalities through upsampling and various activations. The final layer of the U-Net model is a convolution layer with a sigmoid activation to produce the final predictions. The contracting or encoding path consists of convolutional layers and max pooling operations, which lowers the spatial dimensions of the input images, by capturing the low-level characteristics. The expanding or decoding path consists of upsampling layers. The convolutional architecture of U-Nets helps the model handle images of any size, while keeping a high accuracy, making it one of the best models for this cause. Additionally, using the 2D model architecture, taking each slice as we do in this research, enables us to calculate the accuracy of each pixel in the slices of the heart label, showcasing the high-performance accuracy.
Loss Functions
Dice Loss
Dice Loss is commonly used for segmentation tasks and was the loss function with which we achieved the most accurate output. It is a metric used for evaluating the performance of machine learning models in image segmentation tasks. It closes all positive instances predicted by a model to the ground-truth segmentation masks.
Binary Cross Entropy Loss
The Binary Cross Entropy Loss function is a standard loss function used in binary classification tasks. It is used to measure the difference between the predicted binary outcomes and actual binary labels. It is most well suited for binary functions, and will only highlight all the image, or none of the image, which is why it is not as suitable for our research, which aims to identify specific areas of cardiac abnormalities.
Weighted Cross Entropy Loss
Weighted Cross Entropy Loss is an extension of Binary Cross Entropy, which incorporates weights and a scaling parameter, allowing us to negate false positives or false negatives more harshly. This helps improve the function’s ability to identify the abnormalities in cardiac images.
Overall, after data preprocessing, we experimented with each of these different models and analyzed which one of these functions yielded the best results. These models were implemented using Tensor-flow framework and especially its extensive library of deep learning functionalities. We compared each of the models by looking at the performance metrics, including accuracy, loss, precision, recall and F1 score. Alongside these metrics, we visualized each of the models’ performances by comparing the label generated by the model to the given label and comparing each of the model’s predicted outputs to others. Overall, we observed that the U-Net model along with the Dice Loss function obtained the best results, with an accuracy of over 99%.
3D Visualization
To visualize the 3D structure of the heart from the 2D MRI slices, we used the Vedo Python library to construct the volumetric medical imaging data. Specifically, we loaded the NifTi files which stored the 2D image slices and used Vedo’s Volume function to convert them into a 3D volumetric representation.
Results
Our approach for this research is to train various models with cardiac MRI image data sets and evaluate the model with test images to compare the predictions with labels. We compared the models by evaluating the accuracy, precision, recall and F1 score on test data. Then, we further experimented by evaluating the performance of the model combined with various loss functions.
We chose to compare the CNN model with the U-Net model. Once we determined the effective model, we combined it with different loss functions to evaluate the results. The loss functions we experimented include the Dice Loss, binary cross entropy loss, and weighted cross entropy loss.
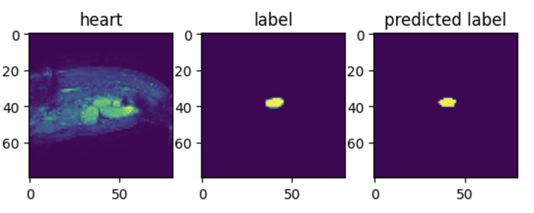
The training involved building model parameters with input images and labels. Once trained, the model will display a predicted image segment for an image input. An example of these images for the U-Net model trained with the Dice loss function is shown in Figure 4. This image was visualized with matplotlib and nibabel libraries.
CNN and U-NET Models
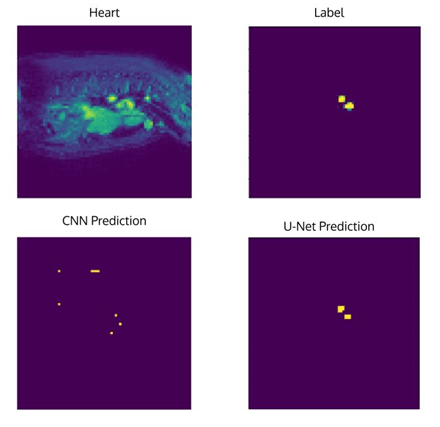
We compared the CNN model and the U-Net model, and how effective each of them were in identifying and classifying the diseased portion of the heart.
| Neural Network Architecture | Epochs | Dice Coefficient | Dice Loss | Accuracy | Precision | Recall | F1 Score |
| CNN | 20 | 0.2321 | 0.7679 | 0.9933 | 0.3263 | 0.4536 | 0.3796 |
| U-Net | 10 | 0.4562 | 0.5438 | 0.9979 | 0.7846 | 0.7712 | 0.7778 |
We tested the model on other images as well to see if it maintains its accuracy. Another example of the model’s performance is below.

When analyzing these two models, while both models have similar accuracy levels of over 99%, the actual prediction on the image comparison shows that the U-Net model is far more accurate than the CNN model. Accuracy alone is an insufficient measure of the model efficacy in this case because of class imbalance as there is a large portion of the image that is not diseased, hence we introduced the F1 score which combines precision and recall effectively when class imbalance exists and positive classification is rare compared to negative classification. Overall, from this comparison we are able to conclude that the U-Net model is more efficient in the segmentation of the structural abnormalities in the heart.
Loss Functions
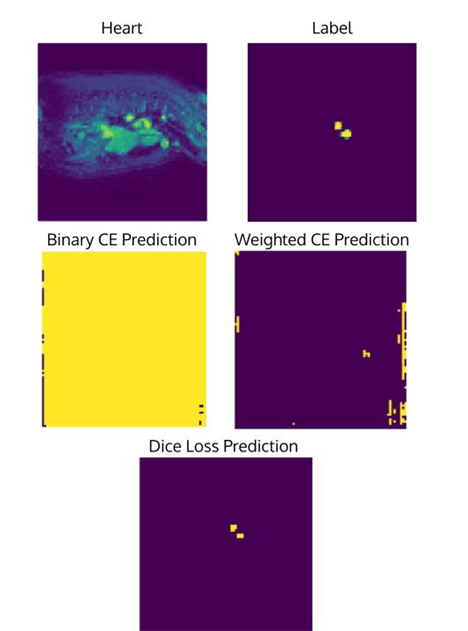
Next, we analyzed the influence of loss functions. Loss functions help improve accuracy of the model. We compared the output of different loss functions (Binary cross entropy, weighted cross entropy, and Dice Loss) when combined with the U-Net Model.
| Loss Function | Epochs | Loss | Accuracy | Precision | Recall | F1 Score |
| Binary Cross Entropy Loss | 10 | 4.9846E-05 | 0.0054 | 0.0046 | 1.00 | 0.009157 |
| Weighted Cross Entropy Loss | 10 | 1.3098 | 0.0148 | 0.0047 | 1.00 | 0.009357 |
| Dice Loss | 10 | 0.5438 | 0.9979 | 0.7846 | 0.7712 | 0.7784 |
We also tested another example image to show the continued accuracy:

We are able to conclude that the Dice Loss with U-Net has the best accuracy, with it being over 99% while the other loss functions have an accuracy less than 1%. Additionally, dice loss improves the F1 score of the model. We noticed that the recall for the Binary Cross Entropy is always 1.0. This is due to the model completely masking the entire heart image, creating no false negatives, however being inaccurate.
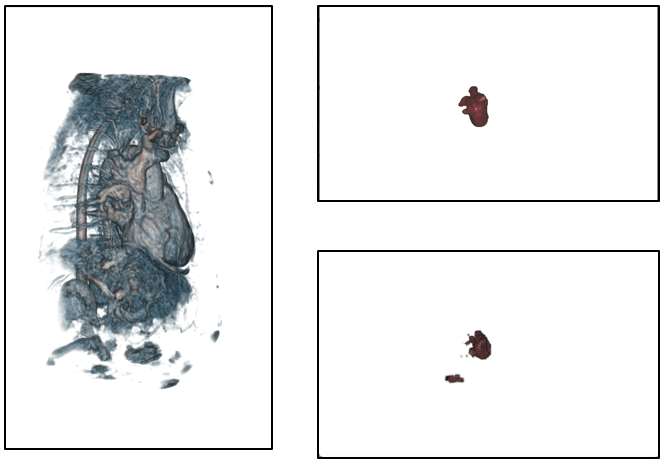
We further developed a novel method to generate 3D images, labels, and predictions from the corresponding 2D images (Figure 9). As future research we can analyze the actual 3D model of the heart by constructing a 3D scannable image with its corresponding labels and predictions and automate this process as well.
Discussions
In this research, we investigated the effectiveness of different deep learning models in the segmentation of cardiac images, to improve diagnostic accuracy of structural heart disease. We utilized cardiac MRI images to train the U-Net and Convolutional Neural Network (CNN) models to optimize accuracy. Our experiments demonstrated that the U-Net architecture, particularly when optimized with the Dice Loss function outperformed the CNN model in accurately identifying structural abnormalities in the heart.
In our study, we experimented with various loss functions, to analyze which function yields the best output. We observed and concluded that training with the Dice Loss function was the most effective method, with an accuracy of over 99%, a precision of over 78% and a recall of over 77%. Additionally, it achieved an F1 score of 0.7784, and a dice coefficient of 0.4563. The results that we obtained show that the U-Net Model optimized with the Dice Loss function had a better accuracy with their predictions compared to CNN and U-Net with Binary Cross Entropy Loss, and the Weighted Cross Entropy Loss function. Furthermore, because the diseased portion is much smaller than the surrounding area, it creates an imbalance in the dataset which is why we observed lower precision and recall value compared to the accuracy metric. While the Dice Loss handled much of the imbalance, more false positives and false negatives will respectively decrease the precision and recall values while keeping the accuracy value high.
The findings in our study have the potential for significant practical application in the medical field, and this study aims to improve the deep learning techniques by identifying the model architecture that is effective in identifying anatomical location of abnormalities in heart disease. The cardiac MRI is a critical tool for diagnosing heart disease, yet current segmentation processes and manual techniques are time-consuming and prone to human error. Automating and improving this step can enhance diagnostic accuracy and can assist cardiologists and healthcare professionals in formulating intervention and treatment plans. We successfully achieved our goal and identified that the U-Net architecture trained with the dice loss function achieved the maximum accuracy when predicting the diseased portion of the heart in cardiac MRIs in comparison to the other models and loss functions.
We have developed the basic version of a website that will allow users to upload their heart MRI images and run our model to output the mask and the abnormal areas of the heart. In the future, we plan to refine this tool and make this website public and universally accessible. The GitHub link for this can be found here:https://github.com/advikap1026/heartMRI.
Furthermore, we explored and successfully generated 3D scannable images from 2D images, by using the library Vedo. We hope that constructing anatomical 3D visuals can help assist medical professionals in diagnosis and treatments requiring surgical intervention. In the future, we can use 3D U-Net models to train and predict 3D MRI images and confirm the effectiveness and accuracy of these predictions.
We can also explore transformer-based models with other segmentation models including FCN and DeepLabV3. In the future, we also hope to apply our work in a clinical setting, to get feedback from healthcare professionals in diagnosing and treating structural abnormalities from MRI images. We want to continue to do trials to test our model and generate 3D images on real patient data and evaluate the model’s performance to be applied in real world scenarios.
While our findings showcased promising results, some limitations were present. Potential sources of error that can cause inaccuracies with our model are technical variations in the MRI scan, and image quality. Additionally, the limited size of our dataset may have caused selection and sampling bias, reduced generalizability, and the restrictions may have prevented our model from predicting results to its full potential. Furthermore, there were limitations with the GPU and Disk Space in our personal computer, making it difficult to run models with a high number of epochs or run images with larger dimensions.
Conclusion
Overall, this research shows the potential of various deep learning models and compares them to identify the most accurate model in cardiac segmentation that can improve the diagnostic accuracy. We successfully achieved our goal and identified that the U-Net model trained with the dice loss function was most accurate in predicting the diseased portion of the heart in cardiac MRIs. This application of AI in medical imaging can improve efficiency and accuracy of diagnostic modalities, improve patient outcome and transform healthcare globally.
References
- Centers for Disease Control and Prevention. Heart Disease Facts. www.cdc.gov/heart-disease/data-research/facts-stats/index.html (2024). [↩]
- O. Ronneberger, P. Fischer, T. Brox. U-Net: Convolutional Networks for Biomedical Image Segmentation. ArXiv.org, (2015). [↩] [↩]
- M. A. Daubert, T. Tailor, O. James, L. Shaw, P. Douglass, L. Koweek. Multimodality cardiac imaging in the 21st century: Evolution, advances and future opportunities for innovation. The British Journal of Radiology (2021). [↩]
- S. Mohan, C. Chandrasekar, and V. Maheswaran. Effective heart disease prediction using hybrid machine learning techniques. IEEE Access. 7, 1329–1333 (2019). [↩]
- D. Shah, S. Patel, S. K. Bharti. Heart disease prediction using machine learning techniques. SN Computer Science. 1, (2020). [↩]
- V. Ramalingam, A. Dandapath, M. K. Raja. Heart disease prediction using machine learning techniques: A survey. Science Publishing Corporation; International Journal of Engineering and Technology, (2024). [↩]
- P. Moeskops, J. Wolterink, B. Van der Velden, K. Gilhuijis. Deep Learning for Multi-Task Medical Image Segmentation in Multiple Modalities. Research Gate (2016). [↩]
- C. Tobon-Gomez, A. Geers. Heart MRI image dataset: Left atrial segmentation. www.kaggle.com/datasets/adarshsng/heart-mri-image-dataset-left-atrial-segmentation?select=imagesTr (2024). [↩]


 Sensor Array for Breath-Based Diabetes Screening")