
Abstract
Climate change continues to escalate, yet the United States still sees limited legislative action due to political polarization and concerns over economic impacts. In contrast, many countries around the world have taken pragmatic action, demonstrating the effectiveness of climate legislation when supported by unified political will. Prior studies on the international adoption of climate change legislation show that new policies have increasingly been implemented since the turn of the 21st century, with numerous factors influencing their rate of adoption. This study analyzes climate legislation adopted between 2000 and 2022 in the European Union and BRICS countries to identify effective frameworks for adoption in the United States. These countries were selected to diversify the sample data by incorporating differing economic drivers and political landscapes. Using a quantitative approach, this analysis employs 91 multivariate linear regressions to examine correlations between policy aspects—categorized by instrument, sector, type, and objective—and CO2 emissions per capita. The models control for GDP per capita, population, fossil fuel share, and carbon pricing to ensure valid cross-country comparisons. Findings reveal that policies involving tendering schemes, general legislative measures, low-carbon technology promotion, fuel switching, and climate adaptation are consistently associated with statistically significant reductions in emissions (p < 0.05). The results suggest that a data-driven approach can contribute to bipartisan climate policy and highlight policy features that reduce emissions while supporting favorable economic outcomes. This research informs a policy proposal tailored to the United States to guide lawmakers in implementing effective climate measures.
Introduction
Climate change has progressively worsened since the Industrial Revolution due to increased human activity, resulting in rising global temperatures and disastrous environmental implications. The burning of fossil fuels, deforestation, and industrial processes have led to a rise in greenhouse gas emissions, resulting in a warming planet. Over the past 50 years alone, the average temperature of the United States has increased by 2 degrees Fahrenheit1. The rise in global temperatures has resulted in an increase in the frequency and magnitude of adverse weather events—meaning more destructive hurricanes, more extreme weather, and increased sea levels. These conditions particularly affect vulnerable communities, with poorer people in developing nations among the most impacted by the consequences of climate change1.

More acutely shown is the damage done to the economy by climate change. According to an article by the National Oceanic and Atmospheric Administration, a US governmental agency that forecasts weather and monitors oceanic and atmospheric conditions, the total cost of large scale disasters in the US over the past five years was $746.7 billion4. At the current rate, the impacts of global climate change are likely to be even more pronounced in the near future, negatively affecting human health and the economy.
The emission of greenhouse gasses (GHGs) is a primary driver of climate change. GHGs consist of compounds extruded into the atmosphere resulting in the trapping of heat, including carbon dioxide, methane, and hydrofluorocarbons1. A number of metrics exist to evaluate and predict climate change, with each metric being dependent on the use case. For example, an analysis of the oceanic impacts of climate change might focus more on the resulting rise in sea levels. In policy discussions, Greenhouse Gas Emission (GHG) is a commonly used metric to measure climate change. The reduction of GHG emissions is regarded as the most viable option for slowing down climate change and has been a major focus of international policy. The United States is the second greatest emitter of GHGs in the world behind China5. Therefore, the level of involvement of the United States in climate policy has major implications for global climate mitigation.
Although the United States is one of the biggest emitters of GHG emissions, it has seen limited action to curb emissions due to political polarization and perceived impacts on the broader economy and individual constituents6. An analysis of the effectiveness of international climate actions backed by data will provide an unbiased framework for policymakers and academia to generate support for bipartisan climate legislation. The goal of this research is to compile and quantitatively analyze global climate policy with an emphasis on national laws in the European Union and BRICS nations. This research aims to identify characteristics shared among the most effective climate policies, so that future legislation in the United States can be more targeted and impactful.
Background
In recent years, the topic of climate change has become more polarized, leading to limited action. The tight margins in the United States Congress demand bipartisan support for effective policies to be enacted and to endure. An analysis by political scientists Patrick J. Egan and Megan Mullin has shown that, due to polarization, both primary political parties have grown cohesive around a set of shared priorities at the expense of collaboration across party lines6. Members of the Democratic Party are generally in favor of increasing resources put into fighting climate change. Meanwhile, the Republican Party has backtracked on its support for renewables, instead pushing policies that support the fossil fuel industry. The Republican position on climate change, however, contrasts with the fact that many of the states leading in the generation of renewable energy are historically Republican-dominated. A bipartisan climate approach that addresses both the general progressive appeal for effective climate policy and conservative concerns on the economy through supporting state industry would be more likely to endure through Congress

Julie Marie Hubbard conducted an empirical analysis of the effectiveness of US state-level climate change policies in a thesis paper presented to the Department of Economics at California State University. Hubbard noted that the United States has yet to implement any strict national policies across all states to lower emissions since the Kyoto Protocol5. The lack of the implementation of federal climate policy has resulted in individual states passing their own climate targets and laws. The five most common types of statewide climate policies are greenhouse gas emissions reduction targets, climate action plans, cap-and-trade programs, renewable electricity portfolio standards, and alternative fuel standards5. Forty-three states have adopted at least one of these policies. However, due to minimal enforcement by the federal government, there is a general lack of uniformity in state policies and targets. Like Egan and Mullin, Hubbard found that the implementation of climate policies is strongly associated with state party affiliation, as states that have enforced climate policies with stricter targets tend to be more Democratically aligned6,5. The lack of federal enforcement of climate policies and extreme partisanship have resulted in an ineffective national effort to address climate change.
The United States was previously involved in the Kyoto Protocol and is now involved in the Paris Agreement. Both these international treaties have had significant impacts on state climate policy in the United States. Margaret Rosso Grossman, a Professor of Agricultural Law at the University of Illinois Urbana-Champaign, discusses the United States’ legislative response to climate change up to 2010. One of the first international climate treaties the United States was involved in was the Kyoto Protocol, which was created in 19971. The Kyoto Protocol set legally binding standards for GHG emissions but faced difficulty in being ratified by the Senate. Replacing the weaker Kyoto Protocol, the Paris Agreement established a goal to cut carbon dioxide emissions by 45% by 2045 and set a limit for the rise in temperature to 1.5°C5. Since signing onto the Paris Agreement in 2016, the United States has yet to implement any sort of national policy to ensure the lowering of emissions across all states. Primarily due to partisanship, the United States has been inconsistent in its involvement in the Paris Agreement. For example, the United States exited the Paris Agreement in 2017 under the Trump administration and rejoined in 2021 under the Biden administration.
Literature Review
This literature review is organized in two parts—firstly, the international climate policy landscape and, secondly, the climate stance of the European Union and BRICS nations. By observing approaches to climate mitigation abroad, it may be possible to draw lessons for an effective climate stance in the US.
International Climate Policies
Various approaches have already been undertaken internationally to combat partisanship, namely by undergoing political compromise. Insights can be taken from these countries to learn how to increase bipartisan support for the United States climate policies.
Australia is one example of a nation that has taken significant steps in combating partisanship. According to Peter Christoff, an Associate Professor at the University of Melbourne, Australia suffers from a history of political infighting on the topic of climate mitigation. He described Australia as a “climate laggard”, being the only country to ever repeal a national emissions policy7. Successful efforts were started in South Australia, where a framework of climate legislation with a 2050 emissions target was enacted. The subnational climate change legislation has since diffused to the rest of Australia and renewable energy promotion has helped to encourage future climate policy. Policy diffusion is also present beyond Australia. According to Hubbard, countries whose neighbors have adopted carbon policies are over 3 times more likely to adopt a policy5. Hubbard claims this same effect is present in the United States, where neighboring states are more likely to adopt similar climate policies due to policy diffusion. If statewide climate policies are generally shared between numerous states already, federal enforcement can potentially be made more effective.
Like Australia, Sweden has also faced setbacks in climate policy due to partisanship but has ultimately created a successful climate policy framework. Mikael Karlsson, an Associate Professor at the Department of Earth Sciences at Uppsala University, analyzed the main factors that influenced the unanimous passage of a proposal from the Sweden All Party Committee on Environmental Objectives in 2018. Karlsson interviewed politicians from two blocs of the Swedish parliament8. One of the factors that was most important was the impact of policy diffusion from the U.K. Climate Change Act. Understanding the positive implications of a similar policy passed in a nearby country helped committee members overcome their doubts. The impact of policy diffusion serves as a qualitative consideration when analyzing potential multiparty support for climate policies in the United States. However, this research, being a quantitative analysis, was not able to incorporate these geographic factors. Future research can complement the findings of this research by including policy diffusion into the analysis.
Past surveys of global climate legislation have identified trends in the international implementation of climate laws. Recent studies of the international adoption of climate change legislation have shown that new legislation has increasingly been implemented since the turn of the 21st century, with numerous factors affecting the rate of adoption. Sam Fankhauser, Professor of Climate Change Economics and Policy at the University of Oxford, studied climate legislation in 66 national jurisdictions over the period 1990–2013. He found that countries with an established “flagship law,” which set the tone of their climate stance, tended to participate more actively in climate action9. Implementing a federal flagship law or policy framework in the United States could provide the initial radical step needed to lead the way for more active climate policymaking. L. Delta Merner, Lead Scientist at the Union of Concerned Scientists, reflected similar ideas to Fankhauser in her comparative study of the climate legislation of Germany, the United States, Brazil, and China. Each of these countries have very different forms of governance with varying political leanings. Yet, with the exception of the US, they have all implemented framework policies to combat climate change. Brazil and China, two BRICS nations, have commitments to reach net zero emissions in 2050 and 2060 respectively10. This provides stark contrast with the current lack of a net-zero legislation in the United States. The lack of federal mandate towards a net-zero target in the United States dilutes efforts for climate change mitigation and leaves it to the states to enforce often inconsistent targets. A national emissions scheme informed by the results of this research could more directly control GHG emissions.
Climate Stance in the European Union and BRICS
The European Union and BRICS are two major political blocs, with differing approaches to climate mitigation. Using quantitative analysis, these countries can provide major insights into creating more effective climate policies in the United States.
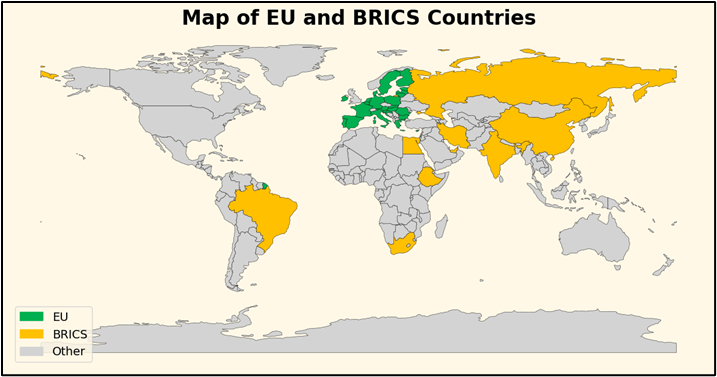
The European Union is a political and economic alliance consisting of 27 member countries located primarily in Europe11. The European Union is governed by several institutions, with the European Commission being able to propose and enforce legislation on member countries. BRICS, on the other hand, is an informal bloc consisting of Brazil, Russia, India, China, and South Africa as well as five newer members formed in 2009 to combat a perceived growing Western influence12. Climate legislation implemented by the European Union—representing predominantly developed nations—and BRICS—representing developing nations—can provide important insights for climate policy adoption in the United States. Refer to Appendix A for the full list of EU and BRICS member states.
A journal article from the Journal of Environmental Law by Kati Kulovesi, Sebastian Oberthür, Harro van Asselt, and Annalisa Savaresi—professors of political science and environmental law—describes climate policy in the European Union. In 2021, the European Union adopted the European Climate Law (ECL), establishing the goal of shifting to a climate-neutral economy by 2050 and updating the emissions target for 203013. The policy is a major example of procedural climate governance—policymaking in which overarching goals are set as opposed to directly addressing GHG emissions13. As a result of the ECL, many countries in the European Union have adopted national frameworks to meet the goals established in the law. As exemplified by the ECL, European Union climate legislation often consists of the united agreement on a common goal enforced through national policy.
BRICS, meanwhile, is generally less united in its climate goals. In an article published in the Third World Quarterly, Göktuğ Kıprızlı and Seçkin Köstem—International Relations researchers at Bilkent University in Turkey—describe the development of the BRICS stance on climate change. Kıprızlı and Köstem claim that due to the Kyoto Protocol separating member countries into annexes based on development, developing countries felt that the duty to address climate change belonged more to industrialized nations14. Grossman dives deeper into the involvement of nations in the Kyoto Protocol, describing how China, India, and Brazil were not included in Annex I—industrial nations which had to reduce GHGs to 5% below levels in 1990 as part of their commitment1. Generally, this lack of responsibility and commitment placed upon developing countries resulted in their refusal to impose policies related to climate change. However, prior to the COP-15 conference, BRICS countries revised their climate responsibilities and pledged targets to reduce emissions. The result of this diplomacy was climate change policy convergence due to the priorities shared by member nations14. The recognition of the need for international diplomacy on climate change has led all BRICS member countries to participate in the Paris Agreement.
The EU and BRICS countries provide diverse lenses towards climate mitigation. By analyzing their policy implementation and corresponding effectiveness, this research aims to inform a data-backed approach to climate legislation, thereby addressing stalemate in US climate policymaking with unbiased and impactful measures.
Gap in Prior Research
In spite of the growing necessity for a national climate framework, limited research has been done on how an analysis of international legislation might inform better US national climate policy. Previous research in the field of policymaking has primarily focused on the analysis of US climate efforts and theme-focused surveys of international climate policy. In order to bridge the gap in the practical application of quantitative analysis in national policymaking, the guiding question of this research is “based on the effectiveness of climate policies in the European Union and BRICS, which policies would be most suitable for implementation in the United States?” Through data-backed legislation, it may be possible to navigate partisan divisions in the United States.
Methods
In order to identify the strongest policy measures for implementation in the US, the effectiveness of these measures have to be quantified. The purpose of this research is to quantify the effectiveness of 91 climate policy measures through correlation analysis—specifically through an approach known as Multiple Linear Regression. Policy effectiveness, in the context of climate policy, is the extent to which a policy is able to reduce CO2 emissions5. In this research, this definition was adapted to those policies that had the greatest correlation with a decrease in CO2 emissions, with the aim of identifying correlations and not causations. Observations are made using data from EU and BRICS nations over the time period 2000–2022. A pooled cross-country regression was chosen over a country-specific fixed effects model in order to highlight policy effectiveness trends on the macro scale.
Previously, cost-benefit analysis—a well-used approach in policymaking—was considered as an approach to evaluating policy effectiveness. However, this approach is time-consuming due to the need to identify scattered qualitative information on each policy. The use of a correlation method allows for the streamlined analysis of policy effectiveness as a whole, since this methodology allows for the use of quantitative data already available in public datasets.
This study examines the relationship between international climate policy and CO2 emissions with the purpose of finding the most effective policy measures for implementation in the United States. The methodology makes the primary assumption that evaluating this relationship can serve as a valid indicator of policy effectiveness. Furthermore, the assumption was made that data from the European Union and BRICS could carry some insight into a general climate legislative framework, which in turn could suggest measures to be implemented in the US. In this research, a regression analysis was conducted to identify correlations between a given policy model and CO2 emissions per capita. In past studies, analyses have been conducted at the national level in order to compare climate policy between states. The statistical methodology of this research is primarily based upon the work of Julie Hubbard, who used regression analysis to model carbon emissions against different policy models in US states. However, this sort of direct comparison between countries on the international scale is complicated by additional factors that must be considered and controlled for: namely, differences in population and economic development. Additionally, Hubbard analyzed five policy frameworks in her regressions: GHG reduction targets, climate action plans, cap-and-trade policies, renewable electricity portfolio standards, and alternative fuel standards5. This research differs from Hubbard’s work in that large economic differences between countries were accounted for in the regression model, with a priority placed on how policies led to changes in CO2 emissions over time. Additionally, regressions were conducted by quantifying data on specific policy measures as opposed to expansive policy frameworks, within the categories of policy instrument, sectors, type, and objective. The regression methodology analyzes each category to identify the most effective measures.
For the regression analysis, data on global climate policy were extracted from the Climate Policy Database (CPDB), compiled by the NewClimate Institute. The CPDB contains 6273 policies from 198 countries, with each policy being tagged by instrument, sector, type, and objective15. Figure 4 portrays the categorical structure of the Climate Policy Database.
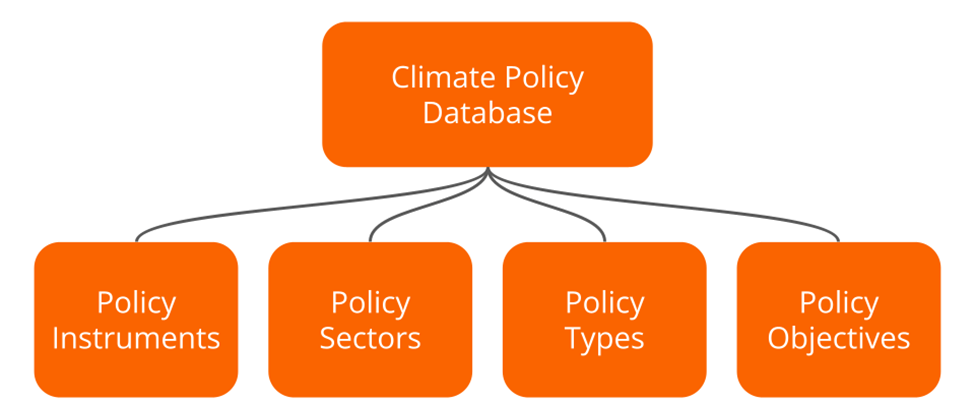
Brief definitions of each category are listed below16:
- Policy Instruments: The tools and techniques used by governments to enforce their policy goals (e.g., Fiscal Incentives, GHG Reduction Target).
- Policy Sectors: The industry or section targeted by a policy (e.g., Agriculture and Forestry, Transport).
- Policy Types: The approach a policy uses to target GHG emissions (e.g., Energy Efficiency, Renewables).
- Policy Objectives: The overarching purpose of a policy (e.g., Mitigation, Food Security).
Official CPDB category definitions are provided in Appendix B.
The regression analysis aims to compare the strength of the correlation between a specific policy measure and CO2 emissions per capita in order to measure “effectiveness”—the level to which a policy is able to achieve its goals. Regression analysis, a form of quantitative correlation analysis, provided the opportunity to study datapoints using existing datasets and the determination of mathematical relationships between variables. A Multiple Linear Regression is a regression model that allows estimation of one dependent variable based upon multiple independent variables. The R programming language was used to run the Multiple Linear Regressions, observe results, and synthesize data.
In order to more accurately make comparisons across countries with very different baselines, several control factors were added to the regression model, including GDP per capita (Gross Domestic Product divided by population), Population, Fossil Fuel %, and Carbon Price. These were included as faux independent variables alongside policy measure data for the purpose of regression modeling. The inclusion of GDP per capita as a measure of the economic health of a country and population as a measure of a country’s size were informed by Hubbard’s research5. Furthermore, population helps to scale the size of the national energy system accordingly. On the international level, countries display much larger deviations in their energy economies and carbon pricing, thus necessitating the inclusion of Fossil Fuel % and Carbon Pricing as controls. Fossil Fuel % controls for the percentage of a country’s energy mix dominated by fossil fuels, and indicates existing progress made in alternative energy17. Carbon Price was included as a binary variable marking whether a broad price signal was in place—0 representing no carbon price and 1 representing the presence of a carbon price—to control for the economic effects and outcomes on emissions stemming from the implementation of carbon pricing18. GDP per capita, Population, Fossil Fuel %, and Carbon Price were chosen over indicators such as industrial output, technological development indices, or political stability because they are collected consistently across countries, serve as direct determinants of emissions, and minimize the risk of multicollinearity introduced through the use of overlapping indices. Overall, the inclusion of these economic markers allow for the improved comparison of climate policy across borders. An additional factor that was taken into consideration was multicollinearity—when variables are not only correlated with a dependent variable, but with each other, thus resulting in the findings having statistical error. Control variables were specifically chosen to have limited relationships with one another to limit multicollinearity. Table 1 displays the strength of each relationship on a scale of -1 to 1, with an ideal value of 0 indicating no linear correlation. The most significant correlation was present between ln(GDP per capita) and ln(population), which is likely due to the fact that countries with higher populations tend to have lower GDP per capita. However, this is a moderate correlation and both variables should still be included as they pose useful insight as national-level indicators. Table 2 provides the Variable Inflation Factor (VIF) and Tolerance for the control variables as a diagnostic for multicollinearity, with VIF showing how much a given control is inflated because of a linear relationship with other predictors and Tolerance being the reciprocal of VIF. Since both the VIF and Tolerance are close to 1, mulitcollinearity is at an acceptable level. The dependent variable in this study was CO2 emissions per capita. While policy diffusion is an important consideration based on learnings from Australia and Sweden, it was not a factor analyzed in this research as it is not a quantitative variable. Future research can enhance findings from this analysis by incorporating policy diffusion into the regression models.
| var | ln_gdp_pc_norm | ln_pop_norm | fossil_pct_norm | carbon_pricing_dummy |
| ln_gdp_pc_norm | 1 | -0.519 | -0.042 | 0.27 |
| ln_pop_norm | -0.519 | 1 | -0.01 | -0.273 |
| fossil_pct_norm | -0.042 | -0.01 | 1 | -0.167 |
| carbon_pricing_dummy | 0.27 | -0.273 | -0.167 | 1 |
| variable | VIF | Tolerance |
| ln_gdp_pc_norm | 1.403136788 | 0.7126888898 |
| ln_pop_norm | 1.410488349 | 0.708974307 |
| fossil_pct_norm | 1.033086257 | 0.9679733838 |
| carbon_pricing_dummy | 1.140375069 | 0.8769044743 |
Information about GDP per capita, Fossil Fuel %, Carbon Price, and CO2 emissions is found in publicly available datasets. The World Bank Group compiles a large catalog of data on countries, which includes the indicators of GDP and Population19. Data regarding Fossil Fuel %, CarbonPrice, and CO2 emissions per capita were provided by Our World in Data, a website that aggregates data from a number of credible sources20. All collected data was isolated over the time period 2000–2022 to the—as of January 1, 2025—27 member countries of the European Union and 9 member countries of BRICS. These clusters of countries were chosen for their informative value pertaining to adopting policy frameworks in the United States. With the Kyoto Protocol implemented in 1997 and serious efforts at climate mitigation beginning in the early 21st century, 2000 was chosen as a rough starting year for this analysis. Due to limited access, 2022 was the last year for which all necessary data was publicly available. To narrow down the most effective policy model, separate regressions were conducted for CO2 emissions over policy instruments, sectors, types, and objectives. Within each regression, policy implementation was categorized as a binary dummy variable, 0 if the country did not have a policy that year and 1 if the country did have a policy that year5. The use of dummy variables allowed for the quantization of qualitative data listed in the CPDB. Dummy variables eliminate the redundancy that might affect data if a country had multiple similar policies. Furthermore, to account for differences between countries, the regressions were adjusted for GDP per capita, Population, Fossil Fuel %, and Carbon Pricing—which were transformed prior to regression modeling to improve accuracy. Both population and GDP per capita were log-transformed using the natural logarithm: population was transformed in order to mitigate large coefficients, while GDP per capita was transformed to improve linearity in its relationship with CO2 emissions per capita. The log-transformation of GDP per capita was in accordance with the Environmental Kuznets Curve theory, which suggests diminishing returns between GDP and CO2 emissions5. Furthermore, non-dummy variables—including GDP per capita, Population, Fossil Fuel %, and CO2 emissions per capita—were normalized using the z-score formula in order to improve comparability across variables by adjusting scaling. This transformation was necessary due to the varying ranges present in the data for each variable, which—if not standardized— would have introduced statistical error into the analysis. The formula was used to normalize the datapoints—where
represents the variable’s global mean and
represents the datapoint’s standard deviation. Furthermore, a lag of two years was included in the model to account for delays in implementation and updates to indicators. Table 3 shows the statistical implications of transforming variables in the analysis. The raw model displayed an R2 of 0.481 while the transformed model provided an R2 of 0.710, a significant increase in the ability of the regression model to explain variance in emissions. On the global scale, the average shift in R2 between policy results in the raw and transformed models was 0.232. These results suggest that log transformation and normalization capture the relationship between policy implementation and emissions more consistently across a diverse set of countries.
| policy_name | category | estimate | std_error | statistic | p_value | r.squared | adj.r.squared |
| Target (Raw) | Policy Instrument | -0.962 | 0.269 | -3.570 | 0.000 | 0.481 | 0.477 |
| Target (Transformed) | Policy Instrument | -0.177 | 0.045 | -3.952 | 8.45E-05 | 0.710 | 0.708 |
To ensure that the data revealed a statistically significant relationship between variables, the p-value must have been less than the standard maximum of 0.05. Formally defined, p-value measures statistical significance, or the probability of observing extreme values in a relationship assuming the null-hypothesis is true21. The null-hypothesis is the assumption that no relationship exists between studied variables. If the p-value was measured to be higher than 0.05 in a given regression, the relationship was ignored as a statistically significant correlation was not evident. The most effective model under each examined category was the policy measure with the least regression coefficient, such that the existence of the policy measure was most closely correlated with a decrease in CO2 emissions. Due to this relationship, a low regression coefficient indicated a high policy effectiveness.
Results
In the course of this analysis, 91 multiple linear regressions were performed. The calculated regression coefficients between the policy measures and CO2 emissions per capita were then isolated from the regression summaries and compared. The policies with the lowest coefficient in each category are shown in Table 2. A negative regression coefficient indicates a reduction in CO2 emissions per capita when a policy is implemented. On the other hand, a positive regression coefficient would indicate that a policy is actually related to a rise in CO2 emissions per capita when implemented. Due to log-transformation and normalization, this value is unitless and only provides for comparative purposes.
The results indicate that tendering schemes, general policies, other low-carbon technologies and fuel switching, and adaptation policies are the most effective.
Brief definitions of the most effective policy measures are listed below16:
- Tendering Scheme: An economic incentive for companies to invest in renewable energy projects
- General Sector: Cross-sector policies are shown to be more effective than narrow sectoral initiatives
- Other Low-Carbon Technologies and Fuel Switch: Investment in technologies that can enhance energy efficiency
- Adaptation: Policies that mitigate the environmental risks posed by climate change
| Policy Measure | Coefficient | Statistical Significance (p-value) | |
| Policy Instrument | Tendering Schemes | -0.5018457 | 6.61E-18 |
| Policy Sector | General | -0.2934944 | 2.64E-08 |
| Policy Type | Other Low-Carbon Technologies and Fuel Switch | -0.3158922 | 3.59E-09 |
| Policy Objective | Adaptation | -0.2198897 | 1.57E-07 |
Official CPDB policy measure definitions are provided in Appendix C.
As shown in Table 4, these policy measures are all statistically significant with p-values well below the threshold of 0.05. Out of all the policy measures, tendering schemes were the most highly correlated with a decrease in emissions, having the lowest regression coefficient.
Charts and Figures

Figure 5 indicates that the most variation was present in the Policy Instrument category, while the least variation was present in the Policy Type category. This was primarily due to the higher number of policy measures included under the Policy Instrument category. A significant number of policy measures actually correlated with a rise in emissions when implemented (Regression Coefficient > 0), indicating that those policies had minimal effectiveness.

Figure 6 is another visual display of the results of this research, showcasing the most and least effective policy measures across each analyzed category. Tendering Schemes, General Policies, Other-Low Carbon Technologies and Fuel Switching, and Adaptation objectives were the most effective measures at emissions reduction (Regression Coefficient < 0). Out of the least effective policies in each category, Energy Efficiency is the only one to have a regression coefficient less than 0, indicating that the measure still has some level of effectiveness

The sample data presented significant biases, particularly with regard to the dataset being most concentrated by policies put in place in France, Germany, and China. While controls were included in the regression models to mitigate economic differences between the countries, the geographic distribution of policy measures may have induced a level of bias into the regressions—a major source of error in this analysis.
Discussion
Placing the EU and BRICS in Perspective
The European Union has adopted a system of procedural governance, in which the European Commission establishes a framework of climate policies that are then implemented at the national level by member states. Thus, the integration and enforcement of policies such as the European Climate Law are largely similar across EU countries. On the other hand, BRICS functions as a decentralized bloc. While climate policies are discussed collectively, their design, budgeting, and implementation are solely the responsibility of member nations. Thus, BRICS leaves more room for uneven country-specific paths, with certain policies in certain countries moving more quickly than others. It is important to take this institutional backdrop into account in a comparative analysis. An instrument shown to be stronger in one setting than another should be taken as a signal of administrative success on the ground as opposed to solely a difference in national income or energy mix.
The manner of institutional framing can help to reconcile policy differences. In the EU, regular targets and compliance checks amplify the effects of climate measures, with procurement practices being largely uniform across countries. In BRICS, national priorities and administrative capacity vary greatly, and so implementation and enforcement vary greatly too. The goal of this analysis is not to show that one bloc’s approach to climate policy is better than another, but to show trends in how governments shape and enforce effective legislation.
Considering Lagged Effects
Of course, climate policies do not affect emissions the day they are legislated, with the necessity of funding, auctions, and permitting. For this reason, a policy is considered active at the time it’s announced, and the results are implemented with a delay in mind. Thus, more weight is given to patterns that emerge between one and three years after implementation as opposed to same-year movements, which may be reflective of the policy’s announcement or associated short-term shocks.
Positive Correlations and Unexpected Results
26 out of the 91 policy regression models conducted presented regression coefficients greater than 0, meaning that those 26 policies statistically correlated with an increase in CO2 emissions. Of course, it would be premature to conclude that those policies were directly causative for greater emissions. Rather, background externalities have a significant influence on the regression coefficients. The most significant externality in this case is economic and population growth over time, which are both correlated with an increase in CO2 emissions. Binary implementation of a policy is not a sound indicator of its strength in enforcement, and countries around the globe vary in their commitment to their own climate standards. Another important factor to note when seeing positive correlations is the rebound effect, or the intended benefits of a policy being offset by behavioral or economic responses. For instance, a policy meant to promote fuel-efficient vehicles would lead to people saving money on gas, encouraging them to drive more often. A combination of high economic and population growth, weak implementation, and the rebound effect can influence the regression model in a manner that lowers policy effectiveness for certain legislation.
Several policies displayed unexpected results, warranting further investigation. CO2 Taxes, for instance, were positively correlated with a rise in CO2 emissions. This may be due to reverse causality, where governments introduce or raise CO2 Taxes as a response to already increasing emissions. If the increasing trend were to continue beyond the fixed two-year lag, the model would pick up on the rising emissions trend. On another hand, many policies with a positive correlation to CO2 emissions had limited relation, if any, to CO2 mitigation. For instance, Food Security indicated a positive correlation, and, due to its lack of direct impact on CO2 emissions, the model picked up on the background externalities presented earlier. Despite the unexpected correlations, these policies merit further examination into how and why those outcomes were produced.
Comparison with Prior Econometric Studies
Comparing the findings from this research with prior econometric analyses can help situate the results within the broader context of climate policy effectiveness. Prior literature has indicated that monetary incentives to lower emissions have tended to be effective. Specifically, Hubbard and Szasz both identified cap-and-trade policies as most effective within their analyses22,23. Although the CPDB did not explicitly list cap-and-trade as a form of policy, this research corroborates prior findings by showing that the most effective policies largely share the characteristic of being monetary incentives. On the other hand, Sæther’s model suggested that policies supporting technological innovation and deployment tended to correlate most negatively with CO2 emissions24. Although ranked below market-based incentives, Technology Deployment and Diffusion was the ninth most effective policy in this analysis.
Prior literature also highlights the limitations of this research. Bergquist & Warshaw’s cross-sectional OLS regression models indicate that the level of climate policy stringency is correlated with a decrease in emissions25. On another note, Stechemesser et al. suggest that policy mixes are far more effective than policies implemented in isolation, underscoring the need for further investigation into how legislation can be packaged to increase overall effectiveness26. The regression models employed in this research were limited by the exclusion of climate policy stringency and policy mixes, and future studies should incorporate these factors to enhance the accuracy of the model.
Design Implications for the United States
In practice, patterns line up with how policy instruments function when implemented. Tendering schemes, for instance, lower procurement risk and encourage competition in the form of auctions, which help to move projects from plans to operating assets. Cross-sector frameworks address coordination issues; planning and reporting ensure that regulators are aligned, so that gains in one sector are not offset by losses in another. Low-carbon technologies and fuel-switching directly replace high-carbon utilities, and their impact will only continue to grow as permits clear and older assets are retired. Where adaptation appears alongside a decrease in emissions, it is read cautiously as promoting climate salience as opposed to being a direct instrument for mitigation.
A practical package can be taken from this research: pairing an implement for competitive procurement (e.g., Tendering Schemes) with an economy-wide framework, and incentives for more energy-efficient assets. Each piece of this package plays a distinct role: the framework aligns agendas cross-sectorally, competitive procurement helps to build assets at a lower cost, and pricing incentives guide actions taken by businesses and households. To build such policies to last beyond a singular budget and encourage energy equality, it is necessary to build in protections for low-income customers and small firms. Public utility commissions, labor, and energy-intensive industries ultimately decide whether a package endures, and including incentives that speak to their needs will allow the climate framework to endure.
Conclusion
This research aimed to explore how historical legislative data from the European Union and BRICS nations could be leveraged in order to inform more effective and data-backed climate policies. The results demonstrate that—out of the 91 policy measures analyzed—Tendering Schemes, General policies, Other Low-Carbon Technologies and Fuel Switch, and Adaptation objectives were the most highly correlated with emissions reductions.
Limitations
It is important to note that this research analyzed correlations between policy implementation and CO2 emissions per capita—not causations. Thus, while the results from this research can provide general guidance on how to construct more effective climate policies, future research should study these trends in greater detail to provide a more substantive policy framework. Due to limitations on the timespan of publicly available data used in this research, the sample size was delimited to the year 2022. As a result, the datapoints included the economic impacts of COVID-19 with limited data on post-pandemic economies. The availability of data within the timespan was a minor limitation in this research. Particularly, the Fossil Fuel % dataset lacked a datapoint for Ethiopia in 2022; a rough value was predicted by calculating a best fit line.
Furthermore, extraneous cultural, geographic, and political variables were not able to be accounted for in this research as these factors are less concrete and quantitative than economic variables. For example, a distinction was not made between China’s and France’s geographical and political structures, which would intuitively indicate different policy directions for each country. Future research could address this limitation by implementing methods of quantitatively coding cultural, geographic (including cross-border policy diffusion), and political variables to diversify controls.
Furthermore, this research makes the simplification that climate policies are sustained because of their effect on carbon emissions. However, in the real world, policies are sustained through a variety of socio-political means (e.g., popular reactions to certain climate policies). While an analysis of these factors is currently out of the scope of this research, future work should consider the impacts of these more qualitative variables within the political environment of the US to provide a more nuanced report of possible policy options. In the real world, policies often interact in a manner that affects their overall effectiveness. The current framework is designed to evaluate individual policies in isolation using a standardized multivariate linear regression approach, which does not allow for the testing of policy interactions. Future research should explore such policy combinations and their resultant combined effects on CO2 emissions.
The binarization of the policy variable poses another limitation in this research, since the model does not account for the age of policies and resulting robustness of implementation. Future research should analyze if policy age is correlated with implementation fidelity, and, if so, implement a factor within the policy variable to more accurately account for this trend.
Implications in Policy Research
Historically, limited research has been conducted on the use of Multiple Linear Regression in policy analysis, especially in the domain of climate policy. This research indicates that Multiple Linear Regression can serve as a viable avenue for analyzing the effectiveness of climate legislation. The limited human intervention required in this methodology can also help to address political polarization by providing results based primarily on historical data, reducing the level of bias present in resulting policy recommendations.
Broadly, this research aims to identify the most effective policy measures based on data from European Union and BRICS nations. The results of this research may contribute to more productive discussions in the realm of national policymaking and inform the reallocation of funding towards more effective policies, making US climate efforts more fruitful and constructive.
Errors and Suggestions for Future Research
While this research largely incorporates quantitative analysis, the construction of the methodology may have been a source of error. While the inclusion of GDP per capita and population was informed by Hubbard’s regression analysis, Fossil Fuel % and Carbon Pricing were chosen in order to control for large deviations in international energy economies and to limit multicollinearity. However, limited prior research has evidentiated the use of these variables as controls in multiple linear regressions. Furthermore, policies were tagged in the CPDB with multiple policy measures, which may have led to a significant overlap of datapoints and thus additional error.
Future research can supplement the results of this work by conducting a cost-benefit analysis of the most effective policy measures, which allows for the weighing of pros against cons. This would quantify the trade-offs for each policy, offering additional datapoints to guide policymakers. Future research should also focus on identifying control variables that can further support the accuracy of a multiple linear regression approach, specifically through including more geographical, cultural, and political controls as datapoints.
While this research primarily focuses on quantitative factors, it is important to note that many of the political mechanisms affecting effectiveness are more qualitative in nature. Case studies and interviews with policymakers could both offer expert verification of this analysis and offer deeper insight into the political mechanisms that favor or hinder policy effectiveness. Additionally, future research should expand on this research by addressing aspects of policy implementation specific to the US context, including the ethical, social, and political implications of adopting certain climate measures.
Furthermore, while implementing governance factors such as level of democracy, degree of decentralization, or political stability may influence policy outcomes, incorporating them as controls would shift the research beyond its current quantitative scope. The inclusion of these factors as controls should serve as grounds for future research on the implementation of qualitative perspectives.
In summary, US climate policies based on international historical data can serve as an avenue for more effective and more data-backed legislation. Ultimately, the battle against climate change is a race against time. This research is a step towards a more quantitative and bipartisan discussion of climate policy—one that bridges divides and guides political action.
Appendix A
| EU Members | BRICS Nations |
| Austria Belgium Bulgaria Croatia Cyprus Czechia Denmark Estonia Finland France Germany Greece Hungary Ireland Italy Latvia Lithuania Luxembourg Malta Netherlands Poland Portugal Romania Slovakia Slovenia Spain Sweden | Brazil China Egypt Ethiopia India Iran Russia South Africa United Arab Emirates |
Appendix B
| Policy Category | CPDB Official Definition |
| Policy Instrument | This variable indicates the policy instrument(s) used. |
| Policy Sector | This variable indicates the sector(s) impacted by the policy. Economy-wide policies are categorized as “General”. Information from this field serves to organize policies by row within our policy matrix. |
| Policy Type | This variable serves to identify how a policy contributes to mitigation outcomes. Information from this field serves to organize policies by column within our policy matrix. |
| Policy Objective | This variable serves to specify the objectives of a policy. |
Appendix C
| Policy Category | Policy Measure | CPDB Official Definition |
| Policy Instrument | Tendering Schemes | Bidding competition by potential providers of a required good or service aimed at reducing provision costs, e.g., through auctions (del Río & Bleda, 2012). |
| Policy Sector | General | Cross-sectoral policies or policies that apply to any sector and that provide framing for or enable the implementation of other sectoral policies. These include, but are not limited to, national or sectoral climate strategies and Research and Development (R&D) policies. |
| Policy Type | Other Low-Carbon Technologies and Fuel Switch | To accomplish the switch to low-carbon sources the decline of emitting technologies must be complemented by the uptake low-emissions alternatives besides renewables. This area includes policy options that tackle the uptake of non-renewable low-carbon technologies as well as options that impose limitations on the use of emissions-intensive technologies, e.g. coal- and oil- fuelled technologies. |
| Policy Objective | Adaptation | Adaptation – adapting to life in a changing climate – involves adjusting to actual or expected future climate. The goal is to reduce vulnerability to harmful effects of climate change (NASA, 2021). |
Appendix D
Regression correlations of CPDB policies with ln(CO2 emissions per capita) with comprehensive statistics. Policies are listed in rank from most to least effective.
| policy_name | category | estimate | std_error | statistic | p_value | r.squared | adj.r.squared | sigma | AIC | BIC |
| Tendering Schemes | Policy Instrument | -0.502 | 0.057 | -8.832 | 0.000 | 0.731 | 0.730 | 0.513 | 1,199.298 | 1,232.020 |
| Demonstration Project | Policy Instrument | -0.439 | 0.062 | -7.097 | 0.000 | 0.722 | 0.721 | 0.522 | 1,225.053 | 1,257.774 |
| Fiscal or Financial Incentives | Policy Instrument | -0.403 | 0.049 | -8.276 | 0.000 | 0.728 | 0.727 | 0.516 | 1,208.075 | 1,240.797 |
| Grants and Subsidies | Policy Instrument | -0.355 | 0.048 | -7.411 | 0.000 | 0.724 | 0.722 | 0.520 | 1,220.742 | 1,253.464 |
| Unilateral Commitments (Private Sector) | Policy Instrument | -0.349 | 0.110 | -3.175 | 0.002 | 0.708 | 0.706 | 0.535 | 1,264.148 | 1,296.870 |
| Funds to Sub-National Governments | Policy Instrument | -0.336 | 0.064 | -5.214 | 0.000 | 0.714 | 0.713 | 0.529 | 1,247.317 | 1,280.039 |
| Retirement Premium | Policy Instrument | -0.335 | 0.086 | -3.891 | 0.000 | 0.710 | 0.708 | 0.533 | 1,259.132 | 1,291.854 |
| Direct Investment | Policy Instrument | -0.332 | 0.051 | -6.475 | 0.000 | 0.720 | 0.718 | 0.524 | 1,233.091 | 1,265.813 |
| Technology Deployment and Diffusion | Policy Instrument | -0.323 | 0.062 | -5.252 | 0.000 | 0.715 | 0.713 | 0.529 | 1,246.926 | 1,279.648 |
| Institutional Creation | Policy Instrument | -0.323 | 0.046 | -7.028 | 0.000 | 0.722 | 0.720 | 0.522 | 1,225.971 | 1,258.693 |
| Infrastructure Investments | Policy Instrument | -0.320 | 0.052 | -6.217 | 0.000 | 0.718 | 0.717 | 0.525 | 1,236.221 | 1,268.943 |
| Other Low-Carbon Technologies and Fuel Switch | Policy Type | -0.316 | 0.053 | -5.970 | 0.000 | 0.717 | 0.716 | 0.526 | 1,239.119 | 1,271.841 |
| Endorsement Label | Policy Instrument | -0.312 | 0.062 | -5.033 | 0.000 | 0.714 | 0.712 | 0.530 | 1,249.117 | 1,281.839 |
| Removal of Split Incentives (Landlord Tenant Problem) | Policy Instrument | -0.307 | 0.244 | -1.256 | 0.209 | 0.705 | 0.703 | 0.538 | 1,272.654 | 1,305.376 |
| Economic Instruments | Policy Instrument | -0.303 | 0.048 | -6.289 | 0.000 | 0.719 | 0.717 | 0.525 | 1,235.358 | 1,268.080 |
| Renewables | Policy Type | -0.302 | 0.056 | -5.371 | 0.000 | 0.715 | 0.713 | 0.529 | 1,245.697 | 1,278.419 |
| General | Sector | -0.293 | 0.052 | -5.621 | 0.000 | 0.716 | 0.714 | 0.528 | 1,243.031 | 1,275.753 |
| Agriculture and Forestry | Sector | -0.282 | 0.052 | -5.432 | 0.000 | 0.715 | 0.713 | 0.528 | 1,245.057 | 1,277.779 |
| Unknown | Policy Type | -0.272 | 0.039 | -6.900 | 0.000 | 0.721 | 0.720 | 0.523 | 1,227.664 | 1,260.386 |
| Political & Non-Binding Climate Strategy | Policy Instrument | -0.256 | 0.045 | -5.739 | 0.000 | 0.716 | 0.715 | 0.527 | 1,241.731 | 1,274.453 |
| Vehicle Air Pollution Standards | Policy Instrument | -0.250 | 0.107 | -2.348 | 0.019 | 0.707 | 0.705 | 0.536 | 1,268.707 | 1,301.429 |
| Information Provision | Policy Instrument | -0.246 | 0.057 | -4.292 | 0.000 | 0.711 | 0.710 | 0.532 | 1,255.898 | 1,288.620 |
| Energy Service Demand Reduction and Resource Efficiency | Policy Type | -0.245 | 0.054 | -4.539 | 0.000 | 0.712 | 0.710 | 0.531 | 1,253.747 | 1,286.469 |
| Policy Support | Policy Instrument | -0.233 | 0.049 | -4.799 | 0.000 | 0.713 | 0.711 | 0.530 | 1,251.369 | 1,284.091 |
| Climate Strategy | Policy Instrument | -0.228 | 0.045 | -5.076 | 0.000 | 0.714 | 0.712 | 0.530 | 1,248.699 | 1,281.421 |
| Research & Development and Deployment (RD&D) | Policy Instrument | -0.226 | 0.058 | -3.912 | 0.000 | 0.710 | 0.708 | 0.533 | 1,258.974 | 1,291.696 |
| GHG Reduction Target | Policy Instrument | -0.222 | 0.041 | -5.410 | 0.000 | 0.715 | 0.713 | 0.528 | 1,245.290 | 1,278.012 |
| Adaptation | Policy Objective | -0.220 | 0.042 | -5.292 | 0.000 | 0.715 | 0.713 | 0.529 | 1,246.517 | 1,279.239 |
| Procurement Rules | Policy Instrument | -0.206 | 0.068 | -3.020 | 0.003 | 0.708 | 0.706 | 0.535 | 1,265.105 | 1,297.827 |
| Loans | Policy Instrument | -0.201 | 0.050 | -4.043 | 0.000 | 0.711 | 0.709 | 0.533 | 1,257.946 | 1,290.667 |
| Research Programme | Policy Instrument | -0.201 | 0.065 | -3.080 | 0.002 | 0.708 | 0.706 | 0.535 | 1,264.744 | 1,297.465 |
| Formal & Legally Binding GHG Reduction Target | Policy Instrument | -0.199 | 0.042 | -4.713 | 0.000 | 0.713 | 0.711 | 0.531 | 1,252.171 | 1,284.892 |
| RD&D Funding | Policy Instrument | -0.193 | 0.064 | -3.023 | 0.003 | 0.708 | 0.706 | 0.535 | 1,265.087 | 1,297.809 |
| Mitigation | Policy Objective | -0.192 | 0.062 | -3.124 | 0.002 | 0.708 | 0.706 | 0.535 | 1,264.470 | 1,297.191 |
| Strategic Planning | Policy Instrument | -0.187 | 0.052 | -3.587 | 0.000 | 0.709 | 0.707 | 0.534 | 1,261.382 | 1,294.103 |
| White Certificates | Policy Instrument | -0.186 | 0.074 | -2.506 | 0.012 | 0.707 | 0.705 | 0.536 | 1,267.940 | 1,300.662 |
| Target | Policy Instrument | -0.177 | 0.045 | -3.952 | 0.000 | 0.710 | 0.708 | 0.533 | 1,258.662 | 1,291.384 |
| Obligation Schemes | Policy Instrument | -0.176 | 0.045 | -3.940 | 0.000 | 0.710 | 0.708 | 0.533 | 1,258.755 | 1,291.477 |
| Other Mandatory Requirements | Policy Instrument | -0.173 | 0.058 | -3.001 | 0.003 | 0.708 | 0.706 | 0.535 | 1,265.220 | 1,297.942 |
| Technology Development | Policy Instrument | -0.173 | 0.064 | -2.701 | 0.007 | 0.707 | 0.705 | 0.536 | 1,266.924 | 1,299.646 |
| Energy and Other Taxes | Policy Instrument | -0.168 | 0.052 | -3.219 | 0.001 | 0.708 | 0.707 | 0.535 | 1,263.872 | 1,296.593 |
| Green Certificates | Policy Instrument | -0.159 | 0.058 | -2.725 | 0.007 | 0.707 | 0.705 | 0.536 | 1,266.795 | 1,299.517 |
| Energy Access | Policy Objective | -0.158 | 0.054 | -2.923 | 0.004 | 0.708 | 0.706 | 0.535 | 1,265.682 | 1,298.404 |
| Renewable Energy Target | Policy Instrument | -0.122 | 0.042 | -2.923 | 0.004 | 0.708 | 0.706 | 0.535 | 1,265.682 | 1,298.404 |
| User Charges | Policy Instrument | -0.118 | 0.087 | -1.368 | 0.172 | 0.705 | 0.703 | 0.538 | 1,272.359 | 1,305.080 |
| Voluntary Approaches | Policy Instrument | -0.118 | 0.059 | -1.988 | 0.047 | 0.706 | 0.704 | 0.537 | 1,270.271 | 1,302.992 |
| Coordinating Body for Climate Strategy | Policy Instrument | -0.117 | 0.063 | -1.838 | 0.066 | 0.706 | 0.704 | 0.537 | 1,270.846 | 1,303.568 |
| Formal & Legally Binding Renewable Energy Target | Policy Instrument | -0.112 | 0.042 | -2.668 | 0.008 | 0.707 | 0.705 | 0.536 | 1,267.104 | 1,299.826 |
| Net Metering | Policy Instrument | -0.097 | 0.061 | -1.597 | 0.111 | 0.706 | 0.704 | 0.537 | 1,271.679 | 1,304.401 |
| Electricity and Heat | Sector | -0.089 | 0.052 | -1.727 | 0.085 | 0.706 | 0.704 | 0.537 | 1,271.243 | 1,303.965 |
| Political & Non-Binding GHG Reduction Target | Policy Instrument | -0.084 | 0.054 | -1.555 | 0.120 | 0.705 | 0.704 | 0.537 | 1,271.809 | 1,304.531 |
| Energy Efficiency | Policy Type | -0.084 | 0.058 | -1.446 | 0.149 | 0.705 | 0.703 | 0.537 | 1,272.139 | 1,304.861 |
| Energy Security | Policy Objective | -0.082 | 0.056 | -1.450 | 0.147 | 0.705 | 0.704 | 0.537 | 1,272.127 | 1,304.849 |
| Political & Non-Binding Renewable Energy Target | Policy Instrument | -0.078 | 0.048 | -1.604 | 0.109 | 0.706 | 0.704 | 0.537 | 1,271.656 | 1,304.378 |
| GHG Emission Reduction Crediting and Offsetting Mechanism | Policy Instrument | -0.060 | 0.075 | -0.806 | 0.421 | 0.705 | 0.703 | 0.538 | 1,273.590 | 1,306.312 |
| GHG Emissions Allowances | Policy Instrument | -0.053 | 0.060 | -0.876 | 0.381 | 0.705 | 0.703 | 0.538 | 1,273.471 | 1,306.193 |
| Land Use | Policy Objective | -0.051 | 0.063 | -0.810 | 0.418 | 0.705 | 0.703 | 0.538 | 1,273.583 | 1,306.305 |
| Barrier Removal | Policy Instrument | -0.041 | 0.058 | -0.706 | 0.480 | 0.705 | 0.703 | 0.538 | 1,273.741 | 1,306.463 |
| Tax Relief | Policy Instrument | -0.031 | 0.051 | -0.603 | 0.547 | 0.705 | 0.703 | 0.538 | 1,273.877 | 1,306.599 |
| Regulatory Instruments | Policy Instrument | -0.028 | 0.048 | -0.593 | 0.553 | 0.705 | 0.703 | 0.538 | 1,273.889 | 1,306.611 |
| Transport | Sector | -0.024 | 0.048 | -0.504 | 0.615 | 0.705 | 0.703 | 0.538 | 1,273.988 | 1,306.710 |
| Political & Non-Binding Energy Efficiency Target | Policy Instrument | -0.021 | 0.050 | -0.420 | 0.675 | 0.705 | 0.703 | 0.538 | 1,274.065 | 1,306.787 |
| Information and Education | Policy Instrument | -0.006 | 0.055 | -0.102 | 0.919 | 0.705 | 0.703 | 0.538 | 1,274.233 | 1,306.955 |
| Monitoring | Policy Instrument | -0.005 | 0.055 | -0.086 | 0.932 | 0.705 | 0.703 | 0.538 | 1,274.236 | 1,306.958 |
| Market-Based Instruments | Policy Instrument | 0.007 | 0.055 | 0.126 | 0.900 | 0.705 | 0.703 | 0.538 | 1,274.227 | 1,306.949 |
| Advice or Aid in Implementation | Policy Instrument | 0.019 | 0.060 | 0.310 | 0.756 | 0.705 | 0.703 | 0.538 | 1,274.146 | 1,306.868 |
| Formal & Legally Binding Climate Strategy | Policy Instrument | 0.024 | 0.049 | 0.477 | 0.633 | 0.705 | 0.703 | 0.538 | 1,274.014 | 1,306.736 |
| Product Standards | Policy Instrument | 0.034 | 0.054 | 0.627 | 0.531 | 0.705 | 0.703 | 0.538 | 1,273.847 | 1,306.569 |
| Performance Label | Policy Instrument | 0.044 | 0.061 | 0.731 | 0.465 | 0.705 | 0.703 | 0.538 | 1,273.704 | 1,306.426 |
| Energy Efficiency Target | Policy Instrument | 0.056 | 0.046 | 1.223 | 0.222 | 0.705 | 0.703 | 0.538 | 1,272.738 | 1,305.460 |
| Industry | Sector | 0.062 | 0.046 | 1.339 | 0.181 | 0.705 | 0.703 | 0.538 | 1,272.440 | 1,305.162 |
| Feed-In Tariffs or Premiums | Policy Instrument | 0.072 | 0.048 | 1.481 | 0.139 | 0.705 | 0.704 | 0.537 | 1,272.037 | 1,304.759 |
| Professional Training and Qualification | Policy Instrument | 0.083 | 0.067 | 1.239 | 0.216 | 0.705 | 0.703 | 0.538 | 1,272.697 | 1,305.419 |
| Negotiated Agreements (Public-Private Sector) | Policy Instrument | 0.092 | 0.060 | 1.520 | 0.129 | 0.705 | 0.704 | 0.537 | 1,271.920 | 1,304.642 |
| Vehicle Fuel-Economy and Emissions Standards | Policy Instrument | 0.097 | 0.065 | 1.492 | 0.136 | 0.705 | 0.704 | 0.537 | 1,272.002 | 1,304.724 |
| CO2 Taxes | Policy Instrument | 0.106 | 0.063 | 1.683 | 0.093 | 0.706 | 0.704 | 0.537 | 1,271.394 | 1,304.116 |
| Building Codes and Standards | Policy Instrument | 0.129 | 0.045 | 2.885 | 0.004 | 0.708 | 0.706 | 0.535 | 1,265.900 | 1,298.622 |
| Sectoral Standards | Policy Instrument | 0.138 | 0.055 | 2.496 | 0.013 | 0.707 | 0.705 | 0.536 | 1,267.988 | 1,300.710 |
| Formal & Legally Binding Energy Efficiency Target | Policy Instrument | 0.146 | 0.060 | 2.430 | 0.015 | 0.707 | 0.705 | 0.536 | 1,268.315 | 1,301.037 |
| Buildings | Sector | 0.148 | 0.048 | 3.064 | 0.002 | 0.708 | 0.706 | 0.535 | 1,264.839 | 1,297.561 |
| Grid Access and Priority for Renewables | Policy Instrument | 0.149 | 0.053 | 2.814 | 0.005 | 0.708 | 0.706 | 0.536 | 1,266.305 | 1,299.026 |
| Codes and Standards | Policy Instrument | 0.197 | 0.046 | 4.242 | 0.000 | 0.711 | 0.709 | 0.532 | 1,256.312 | 1,289.034 |
| Auditing | Policy Instrument | 0.197 | 0.055 | 3.567 | 0.000 | 0.709 | 0.707 | 0.534 | 1,261.524 | 1,294.246 |
| Water | Policy Objective | 0.205 | 0.081 | 2.541 | 0.011 | 0.707 | 0.705 | 0.536 | 1,267.765 | 1,300.487 |
| Industrial Air Pollution Standards | Policy Instrument | 0.215 | 0.072 | 3.008 | 0.003 | 0.708 | 0.706 | 0.535 | 1,265.180 | 1,297.902 |
| Comparison Label | Policy Instrument | 0.233 | 0.057 | 4.121 | 0.000 | 0.711 | 0.709 | 0.532 | 1,257.316 | 1,290.038 |
| Food Security | Policy Objective | 0.312 | 0.145 | 2.146 | 0.032 | 0.706 | 0.704 | 0.537 | 1,269.614 | 1,302.336 |
| Economic Development | Policy Objective | 0.326 | 0.057 | 5.742 | 0.000 | 0.716 | 0.715 | 0.527 | 1,241.704 | 1,274.426 |
| Air Pollution | Policy Objective | 0.355 | 0.052 | 6.792 | 0.000 | 0.721 | 0.719 | 0.523 | 1,229.072 | 1,261.794 |
| Removal of Fossil Fuel Subsidies | Policy Instrument | 0.508 | 0.126 | 4.018 | 0.000 | 0.711 | 0.709 | 0.533 | 1,258.143 | 1,290.865 |
| Other | Policy Instrument | NA | NA | NA | NA | 0.705 | 0.703 | 0.538 | 1,272.243 | 1,300.291 |
References
- M. R. Grossman, Climate change and the law. Am J Comp Law. 58, 223–255 (2010). [↩] [↩] [↩] [↩] [↩]
- Global Carbon Project, Per capita CO2 emissions – GCB. https://ourworldindata.org/grapher/co-emissions-per-capita (2024). [↩]
- EM-DAT, CRED/UCLouvain, Emergency events database – Number of natural disasters by year. https://www.emdat.be (2024). [↩]
- A. B. Smith, U.S. billion-dollar weather and climate disasters, 1980–present (NCEI Accession 0209268). https://doi.org/10.25921/STKW-7W73 (2020). [↩]
- J. Hubbard, The effectiveness of U.S. state-level climate change policies (Master’s thesis, California State University, 2024). [↩] [↩] [↩] [↩] [↩] [↩] [↩] [↩] [↩] [↩] [↩]
- P. J. Egan, M. Mullin, US partisan polarization on climate change: Can stalemate give way to opportunity? PS Polit Sci Polit. 57, 30–35 (2024). [↩] [↩] [↩] [↩]
- P. Christoff, R. Eckersley, Convergent evolution: Framework climate legislation in Australia. Climate Policy. 21, 1190–1204 (2021). [↩]
- M. Karlsson, Political conditions for effective climate policy: Evidence from the Swedish Climate Act. Climate Policy. 20, 1133–1146 (2020). [↩]
- S. Fankhauser, C. Gennaioli, M. Collins, The political economy of passing climate change legislation: Evidence from a survey. Glob Environ Change. 35, 52–61 (2015). [↩]
- L. D. Merner, M. Aklin, F. Geels, A. L. Rodríguez, Comparative analysis of legal mechanisms to net-zero: Lessons from Germany, the United States, Brazil, and China. Carbon Manag. 15, 2288592 (2024). [↩]
- European Union, Countries in the EU and EEA. https://european-union.europa.eu/principles-countries-history/country-profiles_en (n.d.). [↩] [↩]
- Council on Foreign Relations, What is the BRICS group and why is it expanding? https://www.cfr.org/backgrounder/what-brics-group-and-why-it-expanding (2025). [↩] [↩]
- K. Kulovesi, S. Oberthür, H. van Asselt, A. Savaresi, The European Climate Law: Strengthening EU procedural climate governance? J Environ Law. 36, 23–42 (2024). [↩] [↩]
- G. Kıprızlı, S. Köstem, The onset of BRICS cooperation on climate change: Material change, ideational convergence and the road to Copenhagen 2009. Third World Q. 44, 1192–1210 (2023). [↩] [↩]
- NewClimate Institute, Climate Analytics, NCI Collaborators, Climate Policy Database. https://doi.org/10.5281/ZENODO.10869734 (2024). [↩] [↩]
- Climate Policy Database, Climate Policy Database codebook (Version 1.3). https://climatepolicydatabase.org/sites/default/files/2024-03/CPDB%20Codebook%20v1.3.pdf (2024). [↩] [↩] [↩] [↩]
- Ember, Energy Institute, Our World in Data, Share of electricity generated by fossil fuels – Ember and Energy Institute. https://ourworldindata.org/grapher/share-electricity-fossil-fuels (2024). [↩]
- G. Dolphin, Y. Xiahou, Which countries have a carbon tax? https://ourworldindata.org/grapher/carbon-tax-instruments (2022). [↩]
- World Bank Group, World Bank open data. https://data.worldbank.org (2025). [↩]
- M. Roser, H. Ritchie, E. Ortiz-Ospina, Our World in Data. https://ourworldindata.org (2025). [↩]
- O. Y. Chén, R. Raghavan, J. A. Paul, J. Welling, The roles, challenges, and merits of the p value. Patterns. 4, 100878 (2023). [↩]
- J. M. Hubbard, The effectiveness of U.S. state-level climate change policies (Master’s thesis, California State University, Sacramento, 2024). [↩]
- J. Szasz, Which approaches to climate policy decrease carbon dioxide emissions? Evidence from US states, 1997–2017. Energy Research & Social Science. 97, 102969 (2023). [↩]
- S. R. Sæther, Climate policy choices: An empirical study of the effects on the OECD and BRICS power sector emission intensity. Economic Analysis and Policy. 71, 499–515 (2021). [↩]
- P. Bergquist, C. Warshaw, How climate policy commitments influence energy systems and the economies of US states. Nature Communications. 14, 4850 (2023). [↩]
- A. Stechemesser, N. Koch, E. Mark, E. Dilger, P. Klösel, L. Menicacci, D. Nachtigall, F. Pretis, N. Ritter, M. Schwarz, H. Vossen, A. Wenzel, Climate policies that achieved major emission reductions: Global evidence from two decades. Science. 385, 884–892 (2024). [↩]


