
Abstract
Today, transportation is the leading source of greenhouse gas emissions in the US, accounting for 28% of emissions, with the largest portion of transportation being motor vehicles. Transportation’s central role in catalyzing climate change is only growing due to urbanization. In order to drastically reduce emissions, we must increase active modes of transportation such as walking and biking. By making US cities more bikeable and ensuring equitable access to bike safety and infrastructure, we can reduce air pollution and emissions, alleviating climate change and negative health effects. However, a lack of bike infrastructure and policies serve as an impediment to safe, sustainable, and equitable transportation in communities. This paper examines the extent to which a lack of access to biking infrastructure correlates with environmental racism and socioeconomic discrimination in the San Francisco Bay Area, with a specific focus on East Palo, Menlo Park, and Palo Alto. The methodology includes a comparative assessment of bicycle-related plans/policies, as well as a geo-spatial analysis on bicycle facilities and socioeconomic demographic data for the focus geographies. The findings indicate a clear correlation between lesser bicycle facilities and higher racial diversity and lower income levels in East Palo Alto as compared to the neighboring cities of Palo Alto and Menlo Park. This outcome highlights the importance of equitable sustainable transportation planning as it’s essential for social mobility, human health, and the long-term viability of our planet.
Keywords: Bicycle Infrastructure, Bicycle Facilities, Transportation Justice, Active Transportation, Equitable Transportation Planning, Mobility
1. Introduction
1.1 Transportation Justice in the Context of Climate Change
Today, transportation is the leading source of greenhouse gas emissions in the US and accounts for 28% of emissions, with the largest portion of transportation being motor vehicles1. Transportation’s central role in impacting climate change is only growing due to urbanization. Currently, 56% of the world’s population – 4.4 billion people – live in cities. At the same time, cities account for more than 70% of greenhouse gas emissions. By 2050, the population in the world’s cities is expected to double – seven out of ten people will live in cities2. In order to drastically reduce emissions, we must increase active modes of transportation such as walking and biking. Choosing a bike over a car just once a day reduces the average person’s carbon emissions from transportation by 67%3. By making US cities more bikeable and ensuring equitable access to bike safety and infrastructure, we can reduce air pollution and emissions, alleviating climate change and negative health effects. However, a lack of bike infrastructure and policies serve as an impediment to safe, sustainable, and equitable transportation in communities. By examining policies and comparing bike facility data from East Palo Alto, Palo Alto, and Menlo Park, we see opportunities for transportation equity and justice – GIS analysis on bicycle facilities and socioeconomic demographic data uncovers inequality among the cities. Bike deserts (defined as geographic areas with limited or poor bicycle infrastructure making it more difficult for residents to travel by bike) dominate East Palo Alto, which is home to large Hispanic and African American populations, as well as lower income populations. Transportation planning rooted in racism and socioeconomic discrimination has led to a lack of adequate biking infrastructure, creating traffic congestion, diminished optionality of transportation modes, and hazardous biking conditions that disproportionately affect marginalized communities; transportation justice hinges on high-quality and high-density bike networks that promote physical and social mobility for our most vulnerable populations, and contribute to our ability to win against climate change.
1.2 The Importance of Biking
Neighborhood infrastructure is important for human health, economic growth, and community safety. Pedestrian and bike-friendly streets, green spaces, and maintained infrastructure (for example, sidewalks, crosswalks, street lighting, healthcare, food stores, and community centers) promote healthy activities such as walking and bicycling and cultivate a strong sense of community4. Biking is an active mode of transportation that can be used for many everyday activities like getting to school and work or running errands. Robust bicycle infrastructure is important as it encourages more trips to be made by bicycle by providing separation from vehicle traffic, enhances intersection designs, and decreases conflict between drivers and cyclists5.
European cities such as Zurich, Amsterdam and Copenhagen have invested heavily in multi-modal development and as a result have reaped economic value, along with the environmental and health benefits of less air pollutants and traffic. These cities have focused on the built environment and accessibility factors to influence behavior such as land use, density, street grid connectivity and adjacent uses6. However, the United States is more dispersed and has a long history of driving and highway development. As a result, there are bicycle infrastructure deserts everywhere in the United States4. To consider a specific example, we can compare Amsterdam (Netherlands) with Los Angeles (USA). Amsterdam has invested heavily in dedicated bicycle infrastructure as a core urban planning principle, and nurtured a cycling-first culture. In contrast, Los Angeles has been historically resistant to adopt alternative transportation means to cars (including mass transit and bicycles). As a result, there is a massive differential in the resulting bikeability of these cities, quantified as 84 for Amsterdam and 25 for Los Angeles (on a 0-100 scale according to the Bicycle Network Analysis conducted by PeopleForBikes7.
1.3 Overview of Bicycling in the United States
Bicycling is an under-utilized form of transportation in the United States due to a lack of infrastructure. According to the 2017 National Household Travel Survey (NHTS), even though 46% of all single occupancy motor vehicle trips in the U.S. are three miles or less, only 1% of all trips are completed by bicycle. This mismatch is principally due to the danger cyclists feel or experience when they share the same right-of-way with motor vehicles. As a result, bicycle ridership increases with the presence and density of bicycling facilities8. It is true historically, cycling in the US has lagged significantly behind other modes of transportation. However, federal and local governments have been investing and consequently, the density of cycling infrastructure in the most populated 50 US cities doubled between 2007 and 20169.
The state of California has been particularly focused on promoting active transportation. According to a Mineta Institute report, in California, 37% of statewide emissions come from transportation and increasing non-motorized transportation can have a large impact on reduction. Still, in 2017, less than 2% biked to work and less than 3% walked to work10. Decreasing automobile usage and increasing walking, cycling, and other non-motorized travel is critical for California to reduce greenhouse gas emissions by 40% below 1990 levels by 203010. The California’ Active Transportation Program (ATP) was started in 2013 and is the country’s first and largest state program focused on active transportation projects. Even though the ATP budget was increased to $1.6 Billion as of 2023, the program has not kept up with the demand for projects, with many projects going unfunded. While the ATP program is supposed to prioritize funding in disadvantaged communities to rectify the inequality in past transportation planning, there remain open questions about what the prioritization framework should be for deciding which projects to execute.
Caltrans’ Smart Mobility Framework recommends prioritization of transportation projects and programs that invest in streets and safer walking and biking infrastructure, increase commute transit service and ridesharing, and improve connectivity to reduce trip lengths and increase non-auto trips. Walking and biking, ride-share, ride-hailing, and bike share are important because they serve as first and last-mile connectors to public transit11. Despite the recognition of the importance of biking infrastructure and the intent to invest in it, there is a lack of sufficient coverage and the pace of implementation for new projects and improvements is too slow.
1.4 General Challenges for Bicycle Infrastructure
The need for bicycle infrastructure is particularly acute in marginalized communities because these areas often have the highest traffic congestion, least public transit options, and greatest need for lower cost transportation options like bicycling. Yet, questions persist about whether lower-income and minority groups have less access to bicycling infrastructure and if they are demanding it.
Promoting safe biking environments is especially important for lower-income and racial minority communities as they are less likely to own personal vehicles. About 18% of Black households and 11% of Latino and Asian households do not own a personal vehicle and rely on other methods of transportation, including cycling5. Given that disadvantaged groups are often more reliant on less costly modes of travel, it is critical that planners and policymakers understand and address the barriers that may be preventing disadvantaged groups from engaging in active transportation.
Even though programs like the California ATP have a framework mandating that 25% of funds must benefit disadvantaged communities, the demand for bicycling infrastructure far outstrips supply10. Additionally, not all local governments prioritize equity, and a strong commitment to social equity is necessary to accomplish true sustainability12. According to the Greenlining Institute, a San Francisco Bay Area organization focused on social equity, California local, regional, and state transportation planning, investing, and policymaking are not responsive to the mobility needs of low-income communities of color, and the plans reinforce unequal land-use patterns11. These communities “breathe disproportionate levels of toxic smog from transportation-related emissions, which contributes to higher rates of asthma, cancer, and other illnesses than their white counterparts” and “the poorest 20 percent of Americans spend 40.2 percent of their take home pay on transportation while those who make $71,898 and greater only spend 13.1 percent11.” Transportation accentuates racial inequalities which are derived from a history of discriminatory policies like redlining and racial covenants11. A study from Harvard University found that a person’s commute time is the most significant factor in their chances of escaping poverty11. A lack of access to reliable and efficient transportation options severely reduces access to jobs, schools, health care and services11.
However, many communities are distrustful of new infrastructure because they are concerned about gentrification, and they push back on projects. Transportation improvements such as bike infrastructure, can go along with redevelopment, rising property values, and displacement and act as a concerning signal if they are rolled out without community input13. Bike lanes can signify a good neighborhood14. Walking and bicycling infrastructure is frequently seen as a manifestation of privilege, where bicycle lanes represent “white stripes of gentrification15.” Census tracts that had at least one bike path or route and lacked a freeway or a major arterial road had a higher proportion of white residents. These areas with bicycle infrastructure had lower proportions of people of color and lower rates of poverty and limited-English proficiency. On the contrary, census tracts with freeways had higher proportions of Blacks and Hispanics, and areas with major arterials had more Hispanic, Asian, poor, and limited-English-proficient residents16. The threat of gentrification acts as an impediment to planning for bike infrastructure and must be addressed within communities.
Furthermore, disadvantaged populations are disproportionately represented in bicycle crashes. Bicyclists in geographic areas with higher populations of non-White residents, lower median income, and high poverty experience bicycle crashes more frequently than others16. In evaluating 7,088 bicycle crashes over a three-year period in the San Francisco Bay Area, a study examined the influence of socioeconomic, transportation, and land-use characteristics as potential causes of differences in bicycle crash occurrences among racial and ethnic groups in the focus geography. While areas of high poverty and high land-use intensity are associated with higher numbers of bicycle crashes overall, lower-traffic streets and bicycle infrastructure do not affect the frequency of crashes involving Black and Hispanic cyclists16. As a result, there are cultural and language barriers that must be addressed to make biking safer for minorities. Overall, though, bicycle infrastructure is associated with more bicycling and lower risk of collisions16.
Integrating infrastructure for bicycling and walking may be easier in wealthier areas but in poorer communities there is less funding and fewer projects6. Additionally, community pushbacks because of gentrification concerns and problems in the planning process exacerbate the problem.
1.5 Transportation Equity
A deep history of transportation inequity in highways, public transit and infrastructure also hinders equity in bike infrastructure. Limited opportunities for biking or walking exist because there are fewer pathways and also, highway infrastructure has been put in its place, especially in poorer areas. Socioeconomic discrimination is deeply rooted in transportation planning and traditional planning methods do not consistently analyze transportation in the context of race and income level. Executive Order 12898 directs federal agencies to assess equity impacts of all policies and activities on defined Environmental Justice communities (including low income, underrepresented, and other vulnerable groups). Additionally, Title VI of the Civil Rights Act of 1964 outlaws discrimination, denial of benefits, or exclusion from participation in federally funded activities, on the grounds of race, color, or national origin. However, regional transportation equity analysis of transportation is not standardized and does not consistently prioritize equity17. Consequently, there is a lot more work to be done on both transportation equity and justice. To complicate the issue, pedestrian and bicycle safety has appealed to a narrow demographic–citizens who make up bicycle advocacy groups are mostly young and white and historically, planners have not been diverse. Mobility, transportation, and race have been intertwined from colonial times through slavery and Jim Crow to the civil rights movement and up through current urban and transportation planning18.
Transportation equity analysis is critical because it examines discrepancies in resource allocation. It also addresses planning and infrastructure development19.The equity component within sustainability’s “three Es”—environment, economy, and equity– is often overlooked. A 2010 national survey shows that while environmental and economic efforts are common, many local governments neglect social equity initiatives. Governments that are focused on equity engage citizens, partner with nonprofits, and align with initiatives of the HUD (US Department of Housing and Urban Development), the EPA (Environmental Protection Agency) and the DOT (Department of Transportation)20. Equality in communities is not necessarily prioritized in all urban planning, and as a result, there can be a lack of biking infrastructure and unsafe biking policies in marginalized communities.
Additionally, planning is decentralized. In the San Francisco Bay Area, most incorporated cities (San Mateo, Menlo Park, East Palo Alto etc.) engage in independent planning and are responsible for setting development policies and building and maintaining general transportation infrastructure (roads, bicycle & pedestrian amenities, bus stops etc.). The County does not have any say or jurisdiction over these cities’ decisions21. The County may collaborate and strive to improve regional connectivity, but they do not own or direct the planning.
According to Bharat Singh, Planning Services Manager, Planning & Building Department, County of San Mateo, “due to the historic bias towards private automobiles over public transit, development patterns and standards for housing and employment have ignored building infrastructure for pedestrian and bicycle modes of travel. This has made it difficult to retrofit our suburban neighborhoods and employment centers to work well for walking and biking.” The challenge is that “communities are now working to rectify the imbalance, but it is an uphill task to change the built environment to orient their design towards transit, pedestrian and bicycle modes of travel. Much of the reorientation is happening in older neighborhoods that were designed prior to the advent of the private automobile21.” The ill effects of having highways and other transportation infrastructure constructed in areas where marginalized populations live continue and make it more challenging to implement equitable biking infrastructure and foster transportation justice.
In summary, the key reasons for inequitable access to bicycle infrastructure include:
- Historical under-investment aligned with patterns of socioeconomic discrimination in planning
- Friction from community members fearing the ill-effects of potential gentrifications (most notably threats to housing affordability)
- Additional complexity of adding biking infrastructure to areas with higher concentration of highways and major arterial roadways, which are more typically located in disadvantaged communities
1.6 Peer Biking Studies
Researchers have examined equality and bike infrastructure and have found areas of lower-income and minority populations with bike deserts. The Mineta Institute examined investments made in San Jose bike infrastructure and improvement projects. San Jose is one of the largest cities in the US and is also one of the most diverse. The average resident in San Jose spends 80+ hours commuting by car annually. In 2020, San Jose launched the “Better Bike Plan 2025” in order to be one of the most bike-friendly areas in the US with the goal that 20% of all trips should be made by bike by 2050. However, San Jose is segregated around socioeconomic lines with West San Jose being more affluent. The Mineta report uses biking network data and geospatial analyses to assess bike infrastructure availability and make recommendations. The report found that regions that did not have good infrastructure were still used but bikers and pedestrians could have more collisions when they used the same areas like sidewalks. The bike deserts were located in East San Jose which has a large percentage of Hispanic and Asians as well as low-income residents. Also, “the city is divided by Highway 101 with strong disparities in race and income on either side of the freeway22.” The San Jose study illustrates race and income factors and raises questions about East Palo Alto and Palo Alto given the similarities regarding proximity to Highway 101, as well as racial and income differences.
A 2019 report in the Journal of Transport Geography examined the disparities in access to bike lanes across different communities. The report used data from 22 large cities and explored the relationship between bike lanes and sociodemographic factors such as race, income, and educational level. The report indicated that in neighborhoods with minorities and lower-income people, there are fewer bike lanes even after adjusting for cycling demand. Specifically, these groups experience higher risks when getting around relative to more advantaged groups and neighborhoods where there is better bicycle infrastructure that makes biking safer. There are multiple problems with unsafe bike lanes and less wealthy communities have less bike infrastructure, and as a result, there is mobility inequality9.
A dissertation from the University of California at Berkeley analyzed the discrepancies between regions within the city of Oakland and found that West Oakland has “dramatic concentration of bicycle infrastructure “ which “contrasts sharply with the vast neglect of car- and bus-dependent East Oakland, where people on bicycles, primarily of color, face freeway-like conditions on surface streets and often ride on sidewalks14.”
2. Methods
The general structure of this research study was observational, with two primary methodologies.
The first research focus was to examine city-specific policy and planning relevant to bicycle infrastructure. This was conducted via review of accessible city planning documents and corresponding publications, in addition to interviews with selected city and county officials. Interviewees were selected based on knowledge and experience with their city’s bicycle infrastructure planning. Interviews were conducted utilizing a semi-structured interview protocol and interviewees were asked a similar set of questions, noted in Appendix A for reference. This course of research was conducted for three cities: East Palo Alto, Palo Alto, and Menlo Park.
The second research focus was a GIS-centric analysis of the relationship between bicycle infrastructure and demographic variables, specifically income and minority populations, as detailed below:
- To analyze the median household income for East Palo Alto and compare it with the neighboring cities of Palo Alto and Menlo Park, median household income data from the American Community Survey (B19013) was obtained via the US Census Bureau. Tabular data at the Block Group geographic level for San Mateo County and Santa Clara County was also obtained and subsequently joined with the TIGER/Line Shapefiles (for California Block Groups) to enable GIS analytics in QGIS.
- To assess racial composition, racial population data from the American Community Survey (B02001) was obtained via the US Census Bureau. To enable a single-variate analysis, a proxy value for disadvantaged minorities was computed by summing the percentages for Black and Other groups, as reported by the U.S. Census, as a best-available estimate for the African-American and Hispanic population. Tabular data at the Block Group geographic level for San Mateo County and Santa Clara County was obtained and joined with the TIGER/Line Shapefiles (for California Block Groups) to enable GIS analytics in QGIS.
- To examine bicycle facilities available for each of these cities, bicycle infrastructure data was obtained from OpenStreetMaps (OMS), an open-source mapping data platform. Queries for bicycle facilities were executed via Overpass Turbo and the resulting GeoJSON artifacts were imported into QGIS. An attempt was made to cross-reference the OMS-sourced bicycle infrastructure data with a secondary city-provisioned source, however analogous data was not made available from the cities of interest. As a substitute, the OSM-sourced data was reviewed by the author (with knowledge of local bicycle infrastructure) to validate the output. A geospatial intersection analysis was conducted to identify all the bicycle-compatible routes in the reference cities.
- Biking facilities in the focus region were categorized into three tiers, according to a methodology from PeopleForBikes and based primarily on the highway and cycleway fields within the OpenStreetMaps data model. (See Appendix B for tiering methodology.)
- A spatial analysis was then conducted in QGIS to compute the length of bicycle infrastructure by tier by city.
3. Results
3.1 Bicycling Policy and Planning in East Palo Alto
East Palo Alto is a vulnerable community where bicycling infrastructure is lacking, especially relative to neighboring cities. East Palo Alto is a suburb of the San Francisco Bay Area and highway 101 separates affluent Palo Alto and East Palo Alto, a city with an estimated poverty rate of 12.2%23. The city has a history of racial segregation that has characterized the community. After World War II, minorities began coming to the Bay Area to look for a place to settle. However, in Palo Alto, some properties in neighborhoods subdivided from 1925 to 1950 had deed restrictions stating that “no person not wholly of the white Caucasian race shall use or occupy such property unless such person or persons are employed as servants of the occupants24.” People of color could not settle in most Palo Alto neighborhoods and they turned to East Palo Alto, where housing prices were lower and there were less housing restrictions. Although these racial restrictions were eventually outlawed, some remnants persisted through bylaws and deeds, creating segregation that still exists today24. Additionally, in Palo Alto, neighborhoods seen as “high risk” from a lending perspective were outlined in red lines, leading to the term of “redlining.” Neighborhoods of color were outlined in red more often, also leading to segregation24. Meanwhile, Palo Alto was thriving as a result of a growing technology industry.
East Palo Alto has a number of transportation challenges. According to the U.S. Census’ American Community Survey, East Palo Alto residents currently own cars at a lesser rate than the county average (9% of households have no vehicle, as compared to 6% countywide)25. East Palo Alto has a transit dependent population relative to other cities in San Mateo County because of poor east-west transit connectivity and limited bicycle and pedestrian infrastructure. While bicyclists can legally ride on any city street, many streets are not bicycle friendly25. Streets with high volumes of faster traffic can be daunting especially if there is no dedicated roadway space or bikeways. Disconnected and incomplete facilities can strand bicyclists. There is a lack of connections within East Palo Alto (via bicycle, pedestrian, or transit) to regional transit corridors such as Caltrain and El Camino Real, and job and activity centers in neighboring municipalities. Palo Alto, followed by Menlo Park, is the primary location of employment for many East Palo Alto residents. Furthermore, many streets in East Palo Alto lack sidewalks on either one, or in many cases, both sides. U.S. Highway 101 also creates barriers, and the lack of adequate bicycle and pedestrian crossing accommodations on University Avenue (State Highway 109) and Willow Road (State Highway 114) overpasses further limit connectivity25. Travel via non-car modes is challenging but there is demand for better transit service and bicycle and pedestrian infrastructure, as evidenced by community surveys of East Palo Alto citizens26.
According to East Palo Alto’s city plan from 2017 “improving transit, bicycle, and pedestrian connectivity will help decrease traffic, increase mobility and access to jobs, reduce greenhouse gas emissions, and improve East Palo Alto’s overall health and wellness, and quality of life25.” Goals include implementing pedestrian and bicycle crossings at key locations such as Highway 101 near Bay Road. The city also wants to promote walking and bicycling through multiple initiatives: education, outreach programs and events, coordination with neighboring cities (create a path along Newell road between 101 and San Francisquito Creek), a citywide wayfinding system, promoting bike safety, increasing public bike parking, expanding bike share programs and supporting the completion of the San Francisco Bay Trail. The Ravenswood Bay Trail project cost $2.4 million and in 2020, this trail was completed – it is a Class I bike trail from Bayfront Expressway to Bay Road and near Cooley Landing26.
The city plan proposed spending $23.9 million to improve the bike network. Class I bikeways make up $20.0 million of these recommended improvements. The plan is for 3.4 miles of Class I trails, 2.9 miles of Class II trails, and 2.61 miles of Class III trails. This plan, which outlines the vision for 2035, is certainly a strong positive step. One representative project is the in-progress construction of an important pedestrian/bicycle facility along the north side of the US 101/University Avenue overcrossing27. However, East Palo Alto is still behind its immediately neighboring cities.
According to Christopher Kao, Public Works & Transportation Commissioner of East Palo Alto, walking and biking infrastructure is “currently still not that great, but it is getting a lot better.” According to Kao, “there just aren’t that many interesting stores and places to walk and bike to within our 2.5 square miles. Our city doesn’t have a downtown anymore. Also, a lot of students don’t bike or walk to school. They get dropped off even if it’s only a 6-minute walk since parents don’t feel road intersections are safe for kids28.” He says it is a council priority to implement the mobility study that was created in 2020. Current projects that are in the works are resurfacing streets that serve as class II and class III bike lanes, installation of bikeways as part of the East Bayshore Road improvement, and constructing a class I bikeway connecting the pedestrian overcrossing to Woodland Avenue to the west, and Donohoe Street to the east as part of the University Avenue Overcrossing and Interchange project28. Gentrification concerns related specifically to ongoing bicycle facility investments were not cited as a cause for any community friction, most likely due to broader gentrification pressures in East Palo Alto related to its location and Silicon Valley and the associated proximity to expensive real estate.
Kao also notes that infrastructure is not equitable within East Palo Alto. He says “the west side of EPA (lots of higher density apartments) in my opinion is not as good in terms of transportation infrastructure compared to the rest of EPA. There literally are not sidewalks for most of it, and there isn’t even a path along the river banks. It’s a lot of cars parked everywhere.” Furthermore, infrastructure in East Palo Alto is not on par with the surrounding areas of Palo Alto. Kao says “Definitely not. We don’t have the Caltrain and we don’t have as many sidewalks and bike lanes28.” Despite the pressing needs and inequality, according to Humza Javed, Public Works Director, City of East Palo Alto, “We don’t have any projects in the state’s ATP at this time. We submitted an application for the state’s ATP in the past for the University Ave./101 pedestrian overcrossing project. Although we did not receive the grant, we received alternate funding sources to construct the project29.”
On a relative basis, East Palo Alto trails neighboring cities across most dimensions related to bike infrastructure, including access to funding from ATP and other sources. This fact is partially attributable to historical under-investments, which are thematically consistent with general patterns of under-investment in disadvantaged communities. In addition, the condition is also a reflection of competing priorities within the city of East Palo Alto. While transportation-related initiatives continue to be noted priorities for East Palo Alto, some city leaders (encouraged by vocal support from citizens) are pushing to increase focus on housing-related initiatives (to increase affordability and mitigate displacement) which may divert focus and funding from other measures, including bicycle infrastructure projects30.
3.2 Bicycling Policy and Planning in Palo Alto
In contrast to East Palo Alto, neighboring Palo Alto has been a leader in bicycle and pedestrian planning since the 1980s and continues to offer robust bicycling infrastructure. Palo Alto has a rich history of biking and is one of the most bike friendly communities in the country, leading to be named a Gold-Level Bicycle Friendly Community31. The Palo Alto 2012 Bicycle Plan proposed 7.06 miles of Class I trails, 27.92 miles of Class II and Class III trails, and 18.2 miles of bicycle boulevards–far more than East Palo Alto. The plan cited direct, identified funding and need for bicycle and pedestrian projects costing $65 million under current planning (2011-2035)32. There is a new bicycle and pedestrian plan update being worked on for completion in September 2025.
Inequality between Palo Alto and East Palo Alto is evident in several ways. Even though The Bay Trail in East Palo Alto is heavily used by East Palo Alto residents and non-residents, it is owned by the City of Palo Alto. It is unclear why East Palo Alto is not the owner of this land. Some believe that Palo Alto owning and controlling attractive real estate in East Palo Alto is an injustice that needs to be fixed33.
According to Ana Lopez, Associate Planner in the Palo Alto Office of Transportation, Palo Alto is a bike-friendly city with a strong biking culture34. There is a high number of students who bike in Palo Alto using the Safe Routes to School Program. More than 57% of Palo Alto middle and high school students bike to school35. Palo Alto has several active transportation projects ongoing. As with many cities, “Palo Alto faces numerous competing priorities, which can limit funding for active transportation projects. Securing funding through grants is also a challenge, as there are multiple deadlines to meet, competing interests to balance, and the fact that grants can expire quickly. When the city can secure grant funding, managing these grants requires significant staff time and administrative resources to track progress, ensure compliance, and support implementation34.” Unlike East Palo Alto, Palo Alto received ATP funding in the 2023 ATP Cycle 6-for the South Palo Alto Enhanced Bikeways Project.
Palo Alto is focused on reducing collisions and growing sustainable modes of transportation and micro mobility options. Palo Alto is also creating a mechanism to analyze and improve equitability of infrastructure among socioeconomic and racial groups. For example, improvements are being made near affordable housing projects. According to Lopez, Palo Alto and East Palo Alto are quite different in terms of walkability and bikeability and this can be seen when driving through the areas34. Despite its proximity to East Palo Alto, Palo Alto looks and feels like a polar opposite biking environment.
3.3. Bicycling Policy and Planning in Menlo Park
Like Palo Alto, neighboring Menlo Park has also evolved into a leader in bicycle planning and continues to make meaningful progress. The City of Menlo Park was recently recognized by the League of American Bicyclists as a Gold-level Bicycle Friendly Community for 2023-2027, continuing its gold-level status, which previously was certified in 2017. As of Fall 2023, there were 480 Bicycle Friendly Communities across the United States, with 34 being Gold-level. Of those 34, only eight were in California including Menlo Park and Palo Alto36.
Menlo Park faces many issues with regards to transportation, including traffic congestion on local roadways, intersections that are a challenge for pedestrians to cross, and lack of a fully interconnected bicycle network. The city is working on enhanced bicycle and pedestrian detection at traffic signals, a separate bikeway on Willow Road from Hamilton Avenue to US 101, and the Willows bike boulevard and multi-use path to improve school access. As of 2020, there were 89 bicycle projects, making up 50% of total tier 1 transportation projects (eg. bicycle facilities such as striped bike lanes and signed bike routes). There are $77 million of planned tier 1 projects37. According to Catrine Machi, Senior Transportation Planner, City of Menlo Park, Menlo Park is “committed to enhancing its walking and biking infrastructure to promote safety, accessibility, and sustainability. The city’s Transportation Master Plan outlines a vision to improve network performance and implement strategies for local and regional transportation improvements. Additionally, the Vision Zero Action Plan, adopted in January 2024, aims to eliminate all traffic fatalities and serious injuries by 2040, emphasizing the safety of all road users, including pedestrians and cyclists38.” Some of the projects that are ongoing include Willow Road pedestrian and bicycle safety project in collaboration with Caltrans; Middle Avenue Complete Streets Project; and Coleman-Ringwood Avenues Transportation Study. Menlo Park also works with the MTC (Metropolitan Transportation Commission) on a variety of grants that are funded by California’s Active Transportation Program (ATP). MTC administers the Bay Area’s share of ATP money38. Like Palo Alto, Menlo Park has a bicycle infrastructure plan with sizable funding and momentum.
A significant challenge that Menlo Park faces in terms of increasing walking and biking is infrastructure gaps: some areas may lack continuous sidewalks or bike lanes, hindering safe and convenient travel. These gaps are not always easy to close because of space limitations for all modes of transportation—including pedestrians, cyclists, transit users, and drivers. With limited right-of-way and limited budget, balancing the needs of all users is difficult. Also, securing adequate funding can be challenging38. Outside of Menlo Park, according to Machi, “Infrastructure equity between Menlo Park and neighboring cities can vary based on historical development patterns and resource allocation. Menlo Park collaborates with regional partners to enhance connectivity and ensure equitable infrastructure development across the region38.” Menlo Park has a comprehensive plan and set of resources in place to grow biking infrastructure and also to increase bike usage and safety in the city.
3.4 Comparative Analysis of Median Household Income
Figure 1 below is a choropleth map displaying median household income (per US Census Bureau) in East Palo Alto, Palo Alto, and Menlo Park. This GIS analysis visualizes the stark contrast between the fairest colors of the green spectrum (indicative of lower income) in East Palo Alto versus the darker colors (indicative of higher income) in Palo Alto and Menlo Park. The contrast in income levels is also evidenced in numerical analysis, which indicates that 93% of block groups in East Palo Alto have a median household income below $140K, as compared to 17% and 15% in Menlo Park and Palo Alto, respectively. Collectively these analyses validate the assertion that the East Palo Alto geography provides a strong, localized contrast with its neighboring cities with respect to income levels.

3.5 Comparative Analysis of Racial Diversity
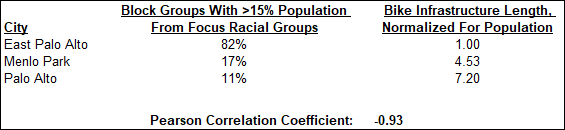
Figure 2 below illustrates the analysis of racial diversity by block group across these three cities. This choropleth map conveys a visible difference in the color spectrum for East Palo Alto relative to Palo Alto and Menlo Park. The East Palo Alto polygon consists primarily of block groups with the two darkest colors, indicating a 30% or greater percentage of African American and Hispanic racial groups within the area (per US Census Bureau). Menlo Park and Palo Alto by contrast are predominantly shown in the lightest color, representing < 10% population percentage for those racial groups. A parallel quantitative analysis indicates that 82% of block groups in East Palo Alto have more than 15% of their population in the focus racial groups, as compared to 17% and 11% in Menlo Park and Palo Alto, respectively. Collectively these analyses validate the assertion that the East Palo Alto geography provides a strong, localized contrast with its neighboring cities with respect to racial diversity.

3.6 Comparative Analysis of Bicycle Infrastructure
Figure 3 below provides a baseline analysis for the comparative biking infrastructure (indicated by the red lines) for the three focus cities. According to OpenStreetMaps data, there is very minimal bike facility coverage in East Palo Alto, especially in relative comparison to Palo Alto and Menlo Park, which visually reinforces the inverse correlation between lower income levels and biking infrastructure, as well as the inverse correlation between higher racial diversity and biking infrastructure.

3.7 Comparative Analysis of Bicycle Infrastructure By Tier
An important principle in the assessment of biking infrastructure is that the quantity (i.e. length) of bicycle-compatible paths is an important, but imperfect, metric. It is helpful to also consider the quality of the facility, where higher quality correlates to lower stress for the bicyclist. Guided by established classification schemes in the industry, biking facilities in the focus region are categorized using a three-tiered taxonomy as outlined below:
- Tier 1 – Off-street bike paths or protected, on-street bike lanes
- Tier 2 – Dedicated, painted bike lanes
- Tier 3 – Shared bike lanes or other
Refer to Appendix B for details on categorization methodology.
Figure 4 below visualizes the bike infrastructure, color-coded according to the quality tiering referenced above.

3.8 Normalized Analysis of Bicycle Infrastructure by Tier
Table 1 below quantifies the large difference in bike infrastructure across the focus cities. Taken as an aggregate across all tiers of biking facilities, East Palo Alto has a total of 10.0km of biking routes. In comparison, Menlo Park has greater than five times that distance (with a total of 51.2km) and Palo Alto has greater than sixteen times as much as East Palo Alto (with a total of 165.1km). The large deltas in infrastructure length are also evidenced in direct comparison of bike infrastructure length per tier.
A contributing factor in the observed deltas in absolute bike infrastructure is the differing size of the three cities, with East Palo Alto being the smallest. To allow for a more consistent comparison, the relationship between bike infrastructure distance and total land-based geographic area per city was analyzed, and a corresponding normalized index was computed. This perspective also confirms East Palo Alto’s inferior infrastructure, with Menlo Park exhibiting a 23% higher relative density of biking infrastructure, and Palo Alto exhibiting a 73% higher relative density of biking infrastructure.
An alternative approach to normalizing the comparison would be on the basis of population. As the differences in population for these cities – 30,034 for East Palo Alto, 33,780 for Menlo Park, and 68,572 for Palo Alto, all according to the 2020 US Census – is considerably less than the delta in land area, considering this normalization perspective indicates a much larger gap in relative biking facilities. Menlo Park has over four times the bike infrastructure distance on a per-capita basis when compared to East Palo Alto, and Palo Alto has over seven times the infrastructure on a per-capita basis when compared to East Palo Alto.

Statistical analysis of these results corroborates the strong inverse correlation (r = -0.91) between income profile and bike infrastructure length (normalized on a per capita basis) as shown in Table 2 below.

In addition, statistical analysis of these results corroborates the strong inverse correlation (r = -0.93) between racial diversity profile and bike infrastructure length (normalized on a per capita basis) as shown in Table 3 below.
4. Discussion
All of the focus cities (East Palo Alto, Palo Alto, and Menlo Park) have established plans and initiatives to support bikeability. However, in reviewing their respective approaches, there are some notable differences. In summary, Palo Alto and Menlo Park both have advanced bicycle infrastructure plans with sizable funding and momentum. As a result, both Palo Alto and Menlo Park have been individually recently recognized by the League of American Bicyclists as a Gold-level Bicycle Friendly Community. In contrast, while East Palo Alto is also considering bicycle infrastructure, as reflected by local leaders identifying bikeability as a council priority, they are behind their neighboring cities in terms of current infrastructure and active investments.
This assessment was further validated through the bespoke GIS analysis, which examined the quantity and quality of bicycle facilities across the three cities. The geo-spatial analysis indicates inferior bike facility coverage in East Palo Alto in relative comparison to Palo Alto and Menlo Park, and illustrates the inverse correlation between lower income levels and biking infrastructure, as well as the inverse correlation between higher racial diversity and biking infrastructure. The focus of this analysis specifically on race and income variables follows from key learnings in a relevant prior study that established direct evidence of disparities in access to bike lanes by race and socioeconomic status across 22 large U.S. cities10.
The relative comparison of bicycle infrastructure was assessed in multiple perspectives. With respect to total facility length (irrespective of quality tiers), Menlo Park has greater than 5x kilometers as East Palo Alto, and Palo Alto has greater than 16x as East Palo Alto. Large deltas in infrastructure length were also found when evaluating bike infrastructure length per quality tier. When normalized for land-area differentials, Menlo Park exhibited a 23% higher relative density of biking infrastructure vs. East Palo Alto, and Palo Alto exhibited a 73% higher relative density of biking infrastructure vs East Palo Alto. Lastly, when normalized for population differentials, Menlo Park has over four times the bike infrastructure distance on a per-capita basis when compared to East Palo Alto, and Palo Alto has over seven times the infrastructure on a per-capita basis when compared to East Palo Alto. These findings consistently underscore the correlation between lesser bicycle facilities and higher racial diversity and lower income levels in East Palo Alto as compared to the neighboring cities of Palo Alto and Menlo Park. A potential opportunity for follow-up analysis would be evaluate additional comparative metrics for the bicycle infrastructure, such as the bike network length as a proportion of total road network or the nature of bicycle network interconnectivity.
There is additional corroboration for the disparity. A third-party rating made available by PeopleForBikes is the Bicycle Network Analysis that utilizes the same bicycle infrastructure dataset (from OpenStreetMaps) to score cities on the basis of bikeability relating to a variety of core use cases. According to this analysis, Menlo Park (score = 47) is rated 47% higher than East Palo Alto (score = 32), and Palo Alto (score = 55) is rated 72% higher than East Palo Alto. The Bicycle Network Analysis rated East Palo Alto with a lower score for each use case, including access to educational/employment opportunities, core services, recreation outlets, and retail. The most significant delta was in the subscore for Transit, where East Palo Alto was rated as a 2 for biking accessibility to major transit hubs, more than an order of magnitude lower than Menlo Park (35) and Palo Alto (39) for the same attribute39. This detail underscores the current challenge for East Palo Alto citizens to couple biking and transit to minimize car trips.
The Bicycle Network Analysis from PeopleForBikes provides a complementary perspective on the relative bikeability for each of the target geographies. While the core analysis is based on the same underlying OpenStreetMaps infrastructure data as used in the GIS analysis, the PeopleForBikes analysis quantifies how the disparate levels of bicycle infrastructure quality/quantity translate into impacts for community access to common destinations, such as retail outlets, places of employment, and transit hubs. Therefore, this analysis further illustrates the real-world community impacts of bicycle facilities.
The insights from the GIS analyses reconcile with key themes surfaced in review of city planning/policy and stakeholder interviews. City planners for all three cities highlighted 1) initiatives related to active transportation as current priorities; 2) the challenge of attaining funding for bicycle infrastructure due to competing civic priorities; and 3) demand for infrastructure projects consistently outstripped supply of resources. However, there were also notable differences between East Palo Alto and its neighboring cities. For instance, the following themes were observed in studying Palo Alto and Menlo Park:
- A long history (dating back to the 1980s) of investing in bicycle infrastructure and promoting a biking culture
- A strong bike network already in place, established over decades of consistent focus, with ongoing opportunities to further optimize (i.e. improved connectivity, reduction in accidents, etc.)
- Integrated biking with regional transit, most notably Caltrain
- Deliberate focus on promoting students commuting to school on bikes with “Safe Routes to School” programs
- Relatively high density of bikeable destinations (i.e. transit hubs, places of employment, downtown area with retail/dining outlets, etc.)
These thematic observations were common for Palo Alto and Menlo Park, but not for East Palo Alto. These important thematic differentials help to explain the large disparity in established bike infrastructure and illustrate alignment between the planning/policy reviews and GIS/spatial analyses.
Collectively, these findings reflect the sharp inequality in bicycle infrastructure between cities that are directly adjacent, yet divergent in racial and economic profile. This is a significant finding that provides tangible evidence of transportation injustice in the San Francisco Bay Area and complements studies in other geographies. As such, the analysis accomplishes its objective of illustrating how the lack of access to biking infrastructure correlates with environmental racism and socioeconomic discrimination in the San Francisco Bay Area, with a specific focus on East Palo, Menlo Park, and Palo Alto.
Naturally, socioeconomic and racial inequities in our society are always concerning. In this case, the transportation inequity is especially acute due to its connection with the existential threat of climate change, which necessitates that we reduce emissions caused by the transportation sector. Active transportation modes like biking are critical in our fight to combat climate change. However, an extensive history of discrimination on the basis of income and race has pervaded transportation planning and continues to play a role in the development of biking infrastructure. This dynamic manifests in the current state of biking facilities in East Palo Alto, which are significantly more modest in comparison to its neighboring cities of Palo Alto and Menlo Park.
The fidelity of available data did not enable an intra-city analysis (i.e. by comparing the presence of biking facilities at the block geographic unit) in the scope of this study but would be an interesting area for further research. However, based on the analysis within the current scope, the vivid transportation inequality evidenced in this inter-city analysis highlights the correlation with lower income and higher marginalized minority groups. It remains critically important to address this condition as sustainable transportation is essential for social mobility, human health, and the long-term viability of our planet. A related question (and candidate area for further investigation) is whether pedestrian infrastructure exhibits similar inequality when comparing cities. Data on sidewalks and pedestrian paths is more difficult to access but despite this challenge, it would be interesting to evaluate whether similar trends exist. By solving transportation challenges such as bike and pedestrian infrastructure inequality, we reduce our dependence on cars which helps everyone. Building more active transportation access will mean less cars, and this will drive down emissions overall.
We must bring equity to transportation planning through equitable representation, infrastructure funding, and community programs. Accessibility to multi-use paths and a clustering effect influence active travel behavior in different ways40. A cyclist is likely to cycle more when seeing other bicyclists doing it. In addition to infrastructure, promoting a biking and walking culture is important to increase sustainable transportation in communities. Increasing awareness and education about the urgency of active transportation like biking is needed for all citizens. As with many social problems, community-building will aid solutions. We must first decide if transportation will connect or impede our lives and our future.
Acknowledgements
I would like to acknowledge the GIS mentorship provided by Reid Passmore, formerly a PhD candidate at the Georgia Institute of Technology and visiting scholar at the University of California Davis.
Appendix
Appendix A – Representative Interview Questions for City Planners
- What are your main roles and responsibilities in your city?
- What are your perceptions of walking and biking infrastructure in your city and what are the city’s goals?
- What projects are in the works to increase walking and biking?
- What challenges does your city face in terms of increasing walking and biking?
- Does your city have any projects associated with California’s Active Transportation Program?
- Do you think infrastructure is equitable among socioeconomic and racial groups? Why or why not?
- How do you think your city compares to neighboring cities in terms of walkability and bikeability?
Appendix B – Bicycle Infrastructure Classification by Tier Methodology
The methodology for classification of bike facilities was informed by PeopleForBikes and principally based on the “highway” and “cycleway” fields within the OpenStreetMaps data model, as outlined below:
- Tier 1 – Off-street bike paths or protected, on-street bike lanes
- Highway = cycleway; or
- Cycleway = track
- Tier 2 – Dedicated, painted bike lanes
- Cycleway = lane; or
- Cycleway = opposite_lane
- Tier 3 – Shared bike lanes or other
- Cycleway = shared_lane; or
- Cycleway = null (and bicycle = yes)
References
- Sources of greenhouse gas emissions. United States Environmental Protection Agency (EPA). Last modified October 22, 2024. Accessed November 15, 2024. https://www.epa.gov/ghgemissions/sources-greenhouse-gas-emissions. [↩]
- Urban development. World Bank. Last modified April 3, 2023. Accessed November 15, 2024. https://www.worldbank.org/en/topic/urbandevelopment/overview. [↩]
- K. Hallisey. How riding a bike benefits the environment. UCLA Transportation (blog). May 11, 2022. Accessed October 7, 2024. https://transportation.ucla.edu/blog/how-bike-riding-benefits-environment. [↩]
- J. Smith-Colin, Z. Li, B. Minsker, X. Wang, and J. Zarazaga. Do infrastructure deserts exist? Measuring and mapping infrastructure equity: a case study in Dallas, Texas, USA. Cities 130 (November 2022). https://doi.org/10.1016/j.cities.2022.103927. [↩] [↩]
- M. Bopp, F. Jasso, L Elliott. Planning for everyone? An examination of state bike plans for equity related content. Cities 149 (June 2024). https://doi.org/10.1016/j.cities.2024.104923. [↩] [↩]
- W. Riggs, S. Seth. Multimodal travel behaviour, walkability indices, and social mobility: How neighbourhood walkability, income and household characteristics guide walking, biking & transit decisions. Local Environment 25 (1) (December 2019): 57–68. https://doi.org/10.1080/13549839.2019.1698529. [↩] [↩]
- Bicycle network analysis. PeopleForBikes. Accessed August 24, 2025. https://bna.peopleforbikes.org/#/places//compare/408e8d0e-de32-4ae8-9d32-32c06f4a0d1a/3898f1c3-34a2-4623-9a99-f0207421b076/. [↩]
- R. Guensler, R. Passmore, K. Watkins. Using shortest path routing to assess cycling networks. Journal of Transport Geography 117 (May 2024). https://doi.org/10.1016/j.jtrangeo.2024.103864. [↩]
- L. Braun, D. Rodriguez, P. Gordon-Larsen “Social (in)equity in access to cycling infrastructure: cross-sectional associations between bike lanes and area-level sociodemographic characteristics in 22 large U.S. cities. Journal of Transport Geography 80 (October 2019). https://doi.org/10.1016/j.jtrangeo.2019.102544. [↩] [↩]
- N. Ahangarfabrik, B. Appleyard, M. Carbajal, M. Honey, M. Swayne, A. Zandiatashbar. Ten years forward: An evaluation of California’s Active Transportation Program. Mineta Transportation Institute 24-21 (August 2024). https://transweb.sjsu.edu/research/2230-Administrative-Transportation-Infrastructure-Pedestrian. [↩] [↩] [↩] [↩]
- H. Creger, J. Espino, A. Sanchez. Mobility equity framework: How to make transportation work for people. Greenlining Institute (March 2018). https://greenlining.org/publications/mobility-equity-framework-how-to-make-transportation-work-for-people/. [↩] [↩] [↩] [↩] [↩] [↩]
- J. Svara, K. Takai, T. Watt. Advancing social equity as an integral dimension of sustainability in local communities. Cityscape 17, no. 2 (2015), 139–66. http://www.jstor.org/stable/26326943. [↩]
- S. McCullough, R. van Stokkum. Answers from the margins: Participatory planning with disadvantaged communities. UC Davis Institute of Transportation Studies (March 2021). https://doi.org/10.7922/G2RX99DZ. [↩]
- J. Stehlin. Business cycles: Race, gentrification, and the production of bicycle space in the San Francisco Bay Area. UC Berkeley Electronic Theses and Dissertations (Spring 2015). https://escholarship.org/uc/item/3mq6f0ct. [↩] [↩]
- J. Agyemana, A. Doran. You want protected bike lanes, I want protected black children. Let’s link: Equity, justice, and the barriers to active transportation in North America. Local Environment 26 (12) (October 2021), 1480–1497. https://doi.org/10.1080/13549839.2021.1978412. [↩]
- J. Barajas. Not all crashes are created equal: Associations between the built environment and disparities in bicycle collisions. Journal of Transport and Land Use 11 (1) (October 2018): 865-82. https://doi.org/10.5198/jtlu.2018.1145. [↩] [↩] [↩] [↩]
- T. Bills. Advancing the practice of regional transportation equity analysis: A San Francisco Bay Area case study. Transportation 51 (2024): 911–936. https://doi.org/10.1007/s11116-022-10355-z. [↩]
- J. Barajas. The roots of racialized travel behavior. Advances in Transport Policy and Planning 8 (2021):1-31. https://doi.org/10.1016/bs.atpp.2021.06.007. [↩]
- R. Bullard, G. Johnson, A. Torres. Highway Robbery: Transportation Racism and New Routes to Equity. Cambridge, MA: South End Press, 2004. [↩]
- J. Svara, K. Takai, T. Watt. Advancing social equity as an integral dimension of sustainability in local communities. Cityscape 17, no. 2 (2015): 139–66. http://www.jstor.org/stable/26326943. [↩]
- B. Singh (Planning Services Manager, Planning & Building Department, County of San Mateo). Interview by Anya Kothari. November 27, 2024. [↩] [↩]
- J. Albrecht, H. Nixon, A. Zandiatashbar. A bike system for all in Silicon Valley: Equity assessment of bike infrastructure in San José, CA. Mineta Transportation Institute, October 2023. Accessed October 7, 2024. https://transweb.sjsu.edu/research/2162-Equity-Assessment-Bike-Infrastructure-San-Jose. [↩]
- East Palo Alto. World Population Review. accessed November 14, 2024. https://worldpopulationreview.com/us-cities/california/east-palo-alto. [↩]
- Housing discrimination: A closed door in Palo Alto. Palo Alto History. Accessed November 14, 2024. https://www.paloaltohistory.org/discrimination-in-palo-alto.php. [↩] [↩] [↩]
- City of East Palo Alto: Vista 2035. City of East Palo Alto. Last modified March 2017. https://www.cityofepa.org/econdev/page/general-plan-2035-east-palo-alto. [↩] [↩] [↩] [↩]
- Bicycle transportation plan adopted 2017. City of East Palo Alto. Last modified October 17, 2017. Accessed October 7, 2024. https://www.cityofepa.org/planning/page/bicycle-master-plan-update. [↩] [↩]
- C. Kao. East Palo Alto raises $15 M for University Avenue pedestrian/bicycle overcrossing. East Palo Alto Sun (blog). December 21, 2023. Accessed December 5, 2024. https://epasun.org/east-palo-alto-raises-15-million-for-university-avenue-pedestrian-bicycle-overcrossing/. [↩]
- C. Kao (Public Works & Transportation Commissioner East Palo Alto). Interview by Anya Kothari. November 27, 2024. [↩] [↩] [↩]
- H. Javed (Public Works Director, City of East Palo Alto). Email message to Anya Kothari. November 28, 2024. [↩]
- S. Prabha. East Palo Alto Council examines priorities. East Palo Alto Today. May 14, 2025. Accessed August 24, 2025. https://www.epatoday.org/post/east-palo-alto-council-examines-priorities. [↩]
- Bikes in Palo Alto: A ride through history. Palo Alto History. Accessed November 14, 2024. [↩]
- City of Palo Alto Bicycle and Pedestrian Transportation Plan. City of Palo Alto, last modified July 2012, https://www.cityofpaloalto.org/Departments/Transportation/Bicycling-Walking/bikepedplan. [↩]
- M. Dinan. Why does Palo Alto own the Bay Trail in East Palo Alto? East Palo Alto Sun (blog). April 3, 2022. Accessed December 5, 2024. https://epasun.org/who-owns-the-bay-trail-in-east-palo-alto/. [↩]
- A. Lopez (Associate Planner, Office of Transportation, Palo Alto). Interview by Anya Kothari. November 25, 2024. [↩] [↩] [↩]
- Safe routes to school. City of Palo Alto. Last modified September 18, 2024. https://www.cityofpaloalto.org/Departments/Transportation/Safe-Routes-to-School. [↩]
- Menlo Park recognized as bicycle friendly community. City of Menlo Park. Last modified February 5, 2024. Accessed December 8, 2024. https://menlopark.gov/News-articles/Transportation-news/20240205Menlo-Park-recognized-as-Bicycle-Friendly-Community. [↩]
- City of Menlo Park transportation plan. City of Menlo Park. Last modified November 2020. https://menlopark.gov/Government/Departments/Public-Works/Transportation-Division/1-City-Transportation-policies-and-plans/Transportation-Master-Plan. [↩]
- C. Machi (Senior Transportation Planner, City of Menlo Park). Interview by Anya Kothari. November 26, 2024. [↩] [↩] [↩] [↩]
- Bicycle network analysis. PeopleForBikes. Accessed December 2, 2024. https://bna.peopleforbikes.org/#/places//compare/f1c2619e-57d0-49fd-9b40-0ad30ee295f8/127a2e20-3b94-4cf7-b7b9-fc85cfaff10c/b886f075-fdcb-42a1-9318-aee7631d2130/. [↩]
- C. Wang, N. Chen. Do multi-use-path accessibility and the clustering effect play a role in residents’ choice of walking and cycling? Mineta Transportation Institute. Last modified 2021. Accessed November 3, 2024. https://doi.org/10.31979/mti.2021.2011. [↩]


