
Authors: Zach Vazhekatt, Karthik Karuppiah, Tom Vazhekatt
Peer Reviewer: Jessica Liang
Professional Reviewer: Dr. Valsamma V.T.
I. ABSTRACT
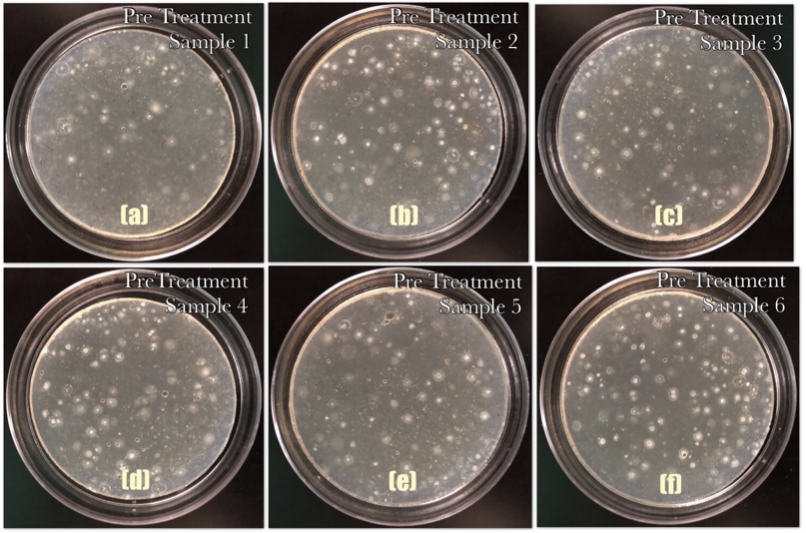
Microbially-unsafe water is a major concern in many developing countries (Unicef). After testing the water purification capabilities of the Moringa Oleifera plant from previous research, the objective this year was to see if the addition of copper would result in a higher water quality index to allow for safe drinkability. Fifteen samples of pond water were collected and were split into three identical groups with five samples each. One group was treated with Moringa powder alone, another was treated with Moringa and Copper, and the third group was not treated, acting as a control group. The levels of phosphates, nitrates, turbidity, dissolved oxygen, and pH were collected prior to the application of the treatments and again after two hours of the application. These levels were used to calculate the overall Water Quality Index, a weighted average of the selected ambient concentrations of pollutants. Prior to the application, the pond water in the control, moringa, and moringa+copper groups obtained scores of 49.93, 50.5, and 48.47 respectively. According to the WQI Score, the pond was “fair water quality” and unsafe for usage due to the water impurities. However, two hours after application, the physiochemical indicator levels substantially improved for both the moringa group and the moringa+copper group, receiving a score of 81.07 and 88.79. This meant the samples were “good water quality,” whereas the control group remained undrinkable with an overall score of 56.71. This accurately demonstrated the water purification capabilities of the Moringa Oleifera plant and Oligodynamic metal as hypothesized.
II. BACKGROUND
According to Unicef, “4000 children die each day from a lack of safe water” (Slavin 1). The Moringa Oleifera could be a simple solution to this problem. The plant’s seeds can purify the unsafe, dirty water into natural, drinkable water.
The Moringa Oleifera, or miracle tree, is known as one of the most multi-purposeful plants ever discovered because of its many capabilities. It is packed with protein, vitamin A, potassium, calcium, vitamin C, and iron (Mercola 1). Not only this, but the Moringa Oleifera tree is very easy to grow because it can grow fast in poor soil. The seeds of the tree are able to purify the water by using its 18 different cationic proteins. These proteins kill the bacteria by fusing their cell membranes, causing the bacteria and dirt to sink and making it easy to “purify” or filter out the clean water. The proteins from the plant can be found in the leaves, powder, seeds, and even oil.
Tree Information
The typical altitude to grow this tree is about 0 – 2000 meters. The typical rainfall to grow the Moringa Oleifera tree is about 250 – 3000 mm (Rod 1). Loamy or sandy soil with a pH from 5-9 is the ideal soil type. It can harvest in about 6-8 months. The plant is not affected by any serious diseases or when it is introduced to a new region. However, there are some damaging agents including aphids, stem borders and fruit flies (Patterson 1).
Nutritional Benefits
There are many nutritional benefits from a raw Moringa leaf. A mere 100 grams of raw Moringa leaf(s) provides 8.28 carbohydrates, 2 grams of dietary fiber, 1.4 grams of fat, 9.4 grams of protein, and high sources of iron, potassium, calcium, phosphorus, and magnesium. This plant also includes vitamin A, B, and C. Because of all these amazing nutritional benefits, the Moringa plant has also been used to fight malnutrition and reduce diabetes symptoms.
Some of the other benefits include antioxidants. High levels of free radicals cause things like stress and heart disease, for which the antioxidants can act against. Some of the antioxidants include quercetin, which lowers blood sugar, and chlorogenic acid, which moderates blood sugar levels after eating a meal (Arnarson 1).
Additionally, Moringa helps reduce inflammation. Inflammation is the body’s natural response after a cut or injury (Arnarson 1). It is an important part of the primary and secondary immune response. However, prolonged inflammation may cause major health issues later on like heart disease, strokes, lupus, and arthritis. The Moringa leaves have anti-inflammatory properties that help in the long run (Arnarson 1).
The Moringa leaf can also lower cholesterol. High amounts of cholesterol are linked to multiple heart diseases. The Moringa lowers the cholesterol level which in turn reduces the risk of heart disease. Arsenic toxicity contamination of food and water has become an issue around the world. The Moringa leaf can help protect against arsenic toxicity.
A study conducted by Richa Gupta from the Division of Pharmacology and Toxicology experimented on the therapeutic effects of Moringa Oleifera on arsenic-induced rats (Gupta 20). The study concluded that the implementation of Moringa Oleifera seeds has seen a depletion of arsenic concentration, which may be also applicable to humans.
History
The Moringa Oleifera has existed for thousands of years. The seeds themselves were used in Ancient Egypt to clear up cloudy water. By crushing the seeds and mixing them in with the water, the Egyptians could clean the water and make it drinkable (Foley 1).
Scientists then later discovered that it is actually the protein of the seeds that kills the bacteria. The protein gathers the bacteria into clusters, making it sink to the bottom.
How Moringa Kills Bacteria
Cell membranes are used to protect a cell. The plant protein works by fusing the membranes of the bacteria together This results in the death of the bacteria, as the integrity of the structure is lost. Proteins found in Moringa seeds are positively charged. Most biological structures in nature, such as pathogens, are negatively charged. The negatively charged particles are not attracted to each other and move to avoid each other in the water, which is why bacteria move around in water. This movement creates “dirty water.” The positively charged Moringa cationic proteins neutralize the charge from the negative particles, causing them to flocculate together. The clumps of particles are then able to sink to the bottom of the container due to gravity.
The part that kills the bacteria takes a different route. The inner and outer membrane of bacteria cells fuse because they are both negatively charged. When they are in the presence of the positively charged Moringa protein, the cell membranes then fuse together, preventing the bacteria from reproducing.
Water Quality
Introduction
The dependent variable, water quality, was calculated by multiple methods of data collection. This ensured a more accurate identification of the water quality. The forms of collection include, pH value, turbidity, dissolved oxygen, amount of phosphates, amount of nitrates, total dissolved solids, and the amount of coliform.
ph
In a water system, the amount of pH is influenced by a number of factors. The bedrock and soil composition affects the pH of the solution because as the water moves in a system, different rock types can neutralize the acid. The plant and organic material growth that occurs in the system releases carbon dioxide both during cellular respiration and composition. An increase in carbon dioxide causes bodies of water to absorb the carbon in the atmosphere. It reacts with the water to produce carbonic acid. Along with that, waste products from industries and other communities often contain chemicals that affect the pH of a solution.
The amount of pH for water quality is tested using pH strips. pH strips are pieces of paper an indicator on them, and they change color corresponding to the pH level, which is known as the acidity or alkalinity of a liquid. This color then corresponds to a specific pH value. pH measurements run on a scale from 0 to 14, where lower values indicate acidity, higher values indicate basicity, and 7 indicates neutrality.
Dissolved Oxygen
The dissolved oxygen of the solution measures the amount of oxygen in the solution. The effects of eutrophication on water quality can be identified by tracing the effect of fertilizers in a water system. The increase in nutrients leads to the excess algae on the water surface, leading to the death of photosynthesizing plants. Their death leads to the rise in population of decomposers and a decrease in dissolved oxygen. By measuring this dissolved oxygen, an individual can identify the possibility of eutrophication, caused by an excess in nutrients (like fertilizer), decreasing its water quality.
The dissolved oxygen will be measured in parts per million (ppm) using dissolved oxygen strips.
Phosphates and Nitrates
Nitrates and phosphates are particularly harmful for humans and the environment because of a process known as eutrophication. The nitrates and phosphates commonly used for agricultural purposes in fertilizers also commonly runoff into bodies of water. These are treated as nutrients for algae in the water, causing massive growth and preventing light from entering the ecological system. Without sunlight, plants die, and as a result, other animals that rely on the producers do as well. With the decrease in life and production of oxygen, the CO2 rates increase, causing an overall, decrease in water quality. Not to mention the severe health risks of drinking water with excess phosphate and nitrate levels.
Total Dissolved Solids/Turbidity
Total solids, TS, is a measure of all the types of solids in water sample. This is important in identifying the effects of Moringa oleifera on water quality because as tested previously, the plant purifies through a method of coagulation, settling all of the pollutants toward the bottom.
If the levels of total solids are too high, the health of organisms will be impacted. This is because many unsafe pollutants may be the cause of high turbidity levels. Along with that, the reduced clarity caused by a higher turbidity rate may not be harmful directly, but it’s less aesthetically pleasing appearance may cause it to be undesirable.
The total amount of dissolved solids is tested using the AP-1 tool. At the press of a button, the amount of dissolved solids will be displayed in parts per million (ppm). As the TDS level gets lower, the water becomes more pure, with 0 ppm being pure water. The turbidity of the water will be tested using a turbidity meter.
Water Quality Index

The water quality index is a universal tool used by the Water Resource Management to define the quality of water and if the water is safe for drinking. This tool uses the amount of phosphates, nitrates, dissolved oxygen levels, coliform bacteria, pH levels, and turbidity levels to create a digit that corresponds to a specific water quality. Chart 1 shows the application of this water quality index value. The tests of temperature change and biological oxygen demand are not being applied into this investigation, for it is not required for our specific investigation. The calculations will be altered accordingly.
The water quality index has been historically used by water quality officials of cities to compute water purity. It was developed by the Canadian Council of the Ministers of the Environment (CCME) as a way to standardize water quality for the purpose of drinking. Prior to this, the water quality of different regions couldn’t effectively be compared as each region used different methods of testing their water.
Coliform Bacteria
Coliform bacteria are organisms that exist in the environment as well as the feces of humans and animals. There are three groups of coliform bacteria—total coliform, fecal coliform, and E. coli—that are all unacceptable in drinking water.
Fecal Coliform is part of a subset of bacteria called total coliform. Most of the fecal coliform subset have a fecal origin. This bacteria is primarily linked with human and animal wastes. The presence of fecal coliform in water shows a very strong indication of fairly recent sewage or animal waste contamination. Some illness symptoms that are linked with fecal coliforms include upset stomach, diarrhea, ear infections, and rashes. Fecal Coliform in the water can also deplete oxygen needed by wildlife and humans. It can affect the pH and create odor problems. There should be no fecal coliform detected in every 100 mL of water or it poses a health risk. Fecal coliform is measured in the amount of colony forming units for every 100 mL.
Copper
General Information
Copper is the 29th element on the periodic table and is a metal with very high thermal and electrical conductivity. Its melting point is 1984 degrees Fahrenheit and is also soft and ductile. Copper is a mix of two stable isotopes: copper-63 and copper-65. Long exposure to copper can cause the oxidation of the metal, producing a film material called patina. Copper has a charge of 2+ and oxidizes when it is combined with oxygen (2- charge)because the oxygen receives the two electrons. This oxidation essentially means that the electrons are lost. Many bodies of water are stagnant, meaning copper particles that may exist in the water oxidize over time rather than being displaced. This leads to the deterioration of the quality of the water.
How it Purifies Water
Ancient practices such as Ayurveda highly recommend storing water in copper pots. There have been various studies that claim that copper substantially reduces the number of impurities present in water samples and prevents the growth of many impurities as well. The copper ions prevent bacterial regrowth because the ions cause membrane damage to the impurities. The molecular biology is still unknown.
III. RESEARCH PLAN
Question: Can moringa oleifera, in combination with various Oligodynamic Metal, be effective in purifying water for an extended period of time?
Hypothesis: The purification properties of Moringa Oleifera plant combined with oligodynamic metal will result in a higher level of purity than the Moringa alone in indicators such as pH, dissolved oxygen, phosphate, nitrate, and turbidity.
Independent Variable: The application of Moringa lam. plant seeds
Dependent Variable: Water quality (in regards to lead removal)
Control Group: Pond water with no application of Moringa
Experimental Groups: Pond water with application of Moringa
Factors help constant:
- Temperature of the laboratory environment
- Humidity of the laboratory environment
- The amount of time the Moringa powder was in each water solution
- Amount of water in each container
- Location of pond water
- Size of petri dish for bacteria testing
- Amount of agar in each petri dish
- Time in incubator
- Testing and measuring equipment used
IV. MATERIALS
Experiementation
- 100 grams of copper wire
- 1000 mL of pond water
- 10 sheets of abrasive paper
- 15 beakers (250mL)
Moringa Extraction and Application
- 1 mortar and 1 pestle
- 100 grams of flour
- 300 grams of hexane
- 1 refrigerator
- 1 stirring rod
Phosphate Test
- 6 pipettes (used for other tests as well)
- 1 long test tube
- 1 phosphate tablet
- 1 timer (used for other tests as well)
- 1 phosphate test color reference card
Dissolved Oxygen Test
- 1 Dissolved Oxygen Probe
- 1 small glass vial
- 1 iPad with probe application installed
pH Test
- 1 pH strip
- 1 pH test color reference card
Nitrate Test
- 1 nitrate tablet
- 1 long test tube
- 1 nitrate test color reference card
Turbidity Test
- 1 glass vial
- 1 paper towel
- 1 iPad
- 1 turbidity meter
V. PROCEDURES
Moringa Preparation
- The seeds of one Moringa pod were removed
- The seeds were laid out on a table and crushed using mortar and pestle.
- The pods were placed in a flour and hexane mixture with a ratio of 1:3.
- The mixture was continuously mixed for 70 minutes using a stirring rod.
- Moringa powder was stored in a refrigerator at 1.6° C.
Experimentation
- A one-gallon bottle was brought to a pond with polluted water and submerged to fill to the top.
- After 2 hours, after the temperature of the water was stabilized, and 200mL of the pond water was poured in 15 different beakers.
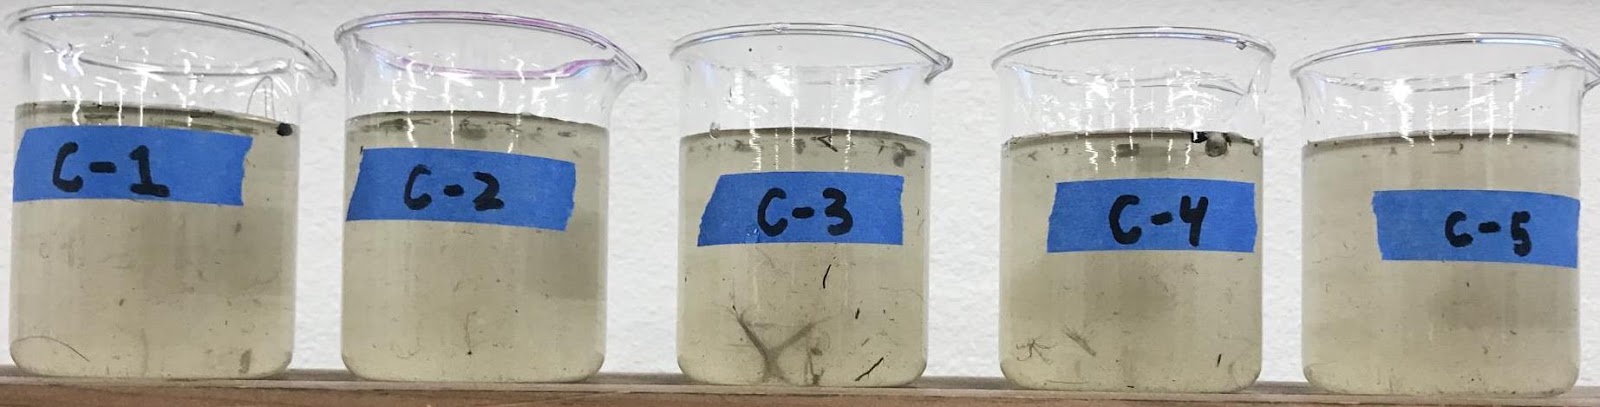
- The 15 beakers were separated into 3 groups of 5 beakers:
- 1st group labeled c (control)
- 2nd group labeled m (moringa)
- 3rd group labeled mm (moringa+metal)
- 0.1 grams of crushed Moringa was measured using a weighing boat and scale.
- The 0.1 grams of Moringa powder was poured into the 5 beakers labeled m (moringa) and the 5 beakers labeled mm (moringa + metal).
- Copper wire in steps of 2.0 g, was immersed in each of the 5 beakers labeled mm (moringa + metal).
- All 15 beakers were tested for the 6 different indicators (procedures listed below) after 2, 4, and 6 hours to determine the ideal time for full purification.
Phosphate Test
- A pipet was used to collect 10 mL of the pond water from the bottle.
- The 10 mL of the solution was poured into the long test tube.
- One phosphate tablet was added to the solution.
- After capping the test tube, it was then inverted every one second continuously until only small particles of the tablet were still visible.
- The test tube was placed on the table and a timer was set for 5 minutes.
- The color of the solution that was most reflected in the reference card was recorded. If the solution appears colorless, it was recorded as 0 ppm.
- The number obtained was used to find the Q-value using Figure 12-8.
- The Q-Value was then multiplied by the given weighing factor for Phosphate (0.10) to attain the number used to find the overall Water Quality Index.
- Steps 1-6 repeated for day 2-4 samples.
Weighting Factor: 0.10

Dissolved Oxygen Test
- A dissolved oxygen probe was placed into the sample of water.
- The DO button on the iPad was chosen.
- Once the number stabilized on the screen, the dissolved oxygen level was recorded.
- The temperature button on the iPad was chosen.
- Once the number stabilized on the screen, the temperature was recorded in degrees Celsius.
- A nomograph containing temperature, dissolved oxygen and percent saturation was printed on a piece of paper.
- A line was drawn from the temperature to the dissolved oxygen level for each sample in order to determine the percent saturation.
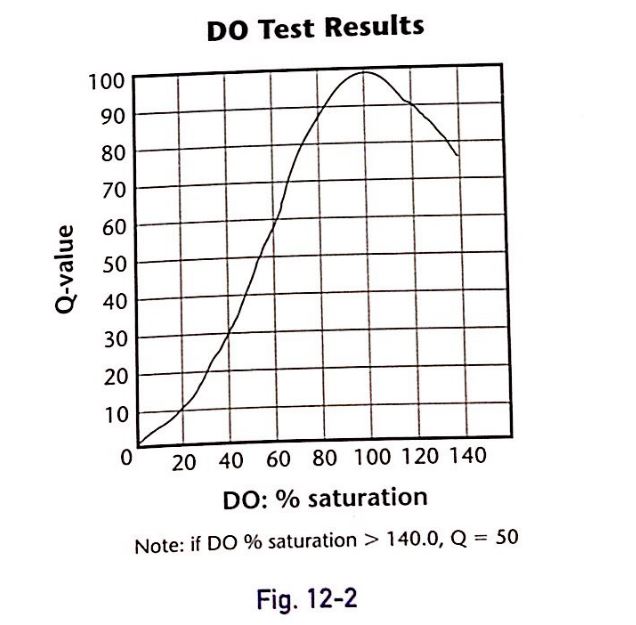
- The number obtained (percent saturation) from the nomograph was used to find the Q-value using Figure 12-2.
- The Q-Value was then multiplied by the given weighing factor for Dissolved Oxygen (0.17) to attain the number used to find the overall Water Quality Index.
- Steps 1-5 repeated 2 hours after the application of purification.
Weighting Factor: 0.17
pH Test
- A pH strip was removed from the container.
- A pipette was used to transfer 2 drops of the solution onto the pH strip.
- A 30-second timer was set for the possible color change to occur.
- The color of the solution that was most reflected in the reference card was recorded. (The lower the pH, the greater the acidity. The higher the pH, the more basic the mixture.)
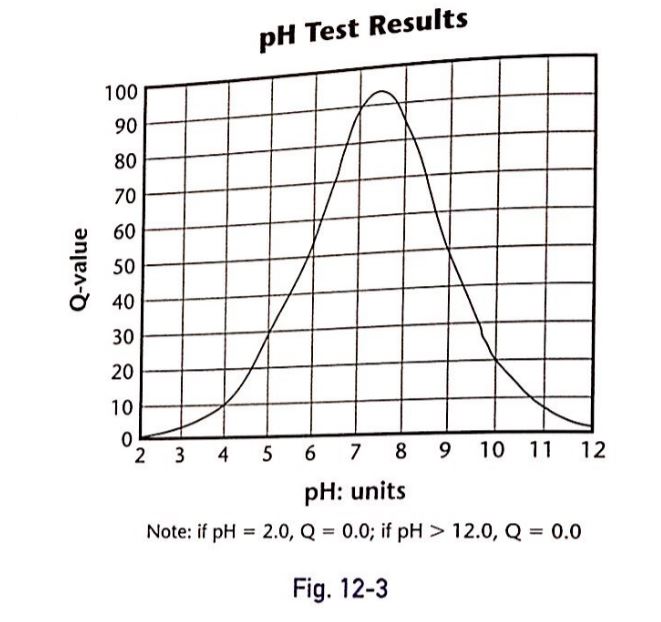
- The number obtained was used to find the Q-value using Figure 12-3.
- The Q-Value was then multiplied by the given weighing factor for pH (0.11) to attain the number used to find the overall Water Quality Index.
- Steps 1-4 repeated 2 hours after the application of purification.
Weighting Factor: 0.11
Nitrate Test
- A pipet was used to collect 5 mL of the pond water from the bottle.
- The 5 mL of the solution was poured into the long test tube.
- One nitrate tablet was added to the solution.
- After capping the test tube, it was then inverted every one second continuously until only small particles of the tablet were still visible.
- The test tube was placed on the table and a timer was set for 5 minutes
- Recorded the color of the solution that is most reflected in the reference card. If the solution appears colorless, 0 ppm was recorded.
- The number obtained was used to find the Q-value using Figure 12-7.
- The Q-Value was then multiplied by the given weighing factor for Nitrate (0.10) to attain the number used to find the overall Water Quality Index.
- Steps 1-6 repeated 2 hours after the application of purification.
Weighting Factor: 0.10

Turbidity Test
- A pipette was used to move 2 mL of the pond water into the small glass vial. The black cap was placed on the vial.
- The glass vial was wiped gently using a t-shirt or paper towel to remove any residual fingerprints.
- The turbidity apparatus was previously set-up by the instructor. However, at times it malfunctioned. In those times, the following was done on the iPad:
- The home button was hit to save the data recorded
- The “build” button was hit, and the one box was chosen.
- The basic numbers (1.23) were chosen on the pop-up screen.
- The turbidity measurement was chosen under the select measurement tab.
- The apparatus was now ready to measure the turbidity.
- The glass vial was placed into the turbidity apparatus and the cap was tightly closed.
- The green arrow at the bottom left corner of the iPad was chosen.
- Once the number stabilized on the screen, the turbidity was recorded.
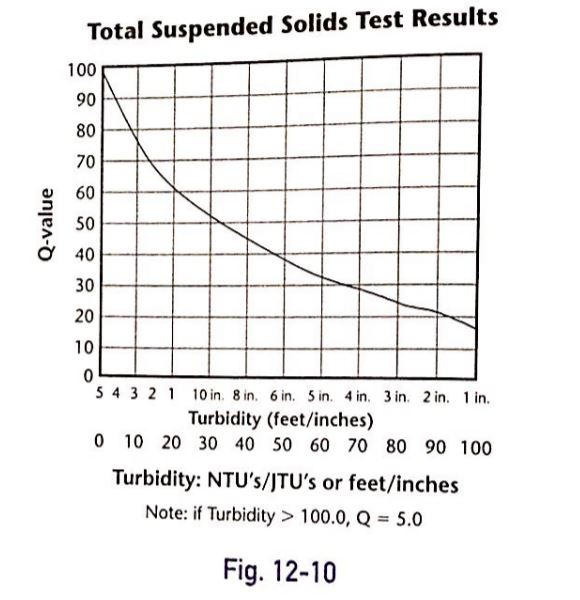
- The number obtained was used to find the Q-value using Figure 12-10.
- The Q-Value was then multiplied by the given weighing factor for Turbidity (0.17) to attain the number used to find the overall Water Quality Index.
- Steps 1-6 repeated 2 hours after the application of purification.
Weighting Factor: 0.08
Safety and Risks
The experiment poses no significant safety hazards other than the possible infection due to the pollutants in the water samples. As a precaution, gloves, aprons, and goggles were worn during the experimentation. Chemical contact to the skin and eye was avoided. Equipment was used for its designed purpose. All equipment was regularly inspected for wear or deterioration. An adult supervisor was present throughout the entirety of the investigation.
VI. RESULTS


VII. DATA TABLES/GRAPHS
Table 1. Water Quality Index Raw Data
| Hour 0 (before purification) | |||||||
| Phosphate | Dissolved Oxygen | pH | Nitrate | Turbidity | Temperature | ||
| Control | Trial 1 | 4 | 8.18 | 6 | 0 | 312.2 | 15 |
| Trial 2 | 4 | 8.31 | 6 | 0 | 278.8 | 14.6 | |
| Trial 3 | 4 | 8.19 | 5 | 0 | 234.4 | 15 | |
| Trial 4 | 4 | 8.23 | 5 | 0 | 258.8 | 14.9 | |
| Trial 5 | 2 | 8.39 | 5 | 0 | 316.5 | 14.8 | |
| MEAN | 3.6 | 8.26 | 5.4 | 0 | 280.14 | 14.86 | |
| Q Value | 17 | 70 | 37 | 100 | 5 | ||
| Moringa | Trial 1 | 4 | 8.22 | 6 | 0 | 316.5 | 14.5 |
| Trial 2 | 4 | 8.29 | 6 | 0 | 210.6 | 14.6 | |
| Trial 3 | 4 | 8.25 | 5 | 0 | 289.5 | 14.8 | |
| Trial 4 | 2 | 8.25 | 6 | 0 | 252.3 | 14.7 | |
| Trial 5 | 2 | 8.35 | 6 | 0 | 270.4 | 14.8 | |
| MEAN | 3.2 | 8.272 | 5.8 | 0 | 267.86 | 14.68 | |
| Q Value | 19 | 67 | 44 | 100 | 6 | ||
| Moringa+Metal | Trial 1 | 4 | 8.19 | 6 | 0 | 267.8 | 14.8 |
| Trial 2 | 4 | 8.31 | 5 | 0 | 311.4 | 14.7 | |
| Trial 3 | 2 | 8.28 | 6 | 0 | 259.8 | 14.9 | |
| Trial 4 | 4 | 8.17 | 6 | 0 | 268.8 | 14.9 | |
| Trial 5 | 4 | 8.29 | 5 | 0 | 312.4 | 14.2 | |
| MEAN | 3.6 | 8.248 | 5.6 | 0 | 284.04 | 14.7 | |
| Q Value | 17 | 62 | 41 | 100 | 5 | ||
| Hour 2 (after purification) | |||||||
| Phosphate | Dissolved Oxygen | pH | Nitrate | Turbidity | Temperature | ||
| Control | Trial 1 | 4 | 7.3 | 6 | 0 | 97.7 | 18.5 |
| Trial 2 | 2 | 7.41 | 6 | 0 | 70.9 | 18.3 | |
| Trial 3 | 4 | 7.33 | 6.5 | 0 | 73 | 18 | |
| Trial 4 | 2 | 7.35 | 6 | 0 | 127.2 | 18 | |
| Trial 5 | 2 | 7.23 | 6.5 | 0 | 89.8 | 17.8 | |
| MEAN | 2.8 | 7.324 | 6.2 | 0 | 91.72 | 18.12 | |
| Q Value | 20 | 68 | 60 | 100 | 20 | ||
| Moringa | Trial 1 | 1 | 7.91 | 7 | 0 | 13.6 | 18.2 |
| Trial 2 | 0 | 7.91 | 7 | 0 | 16.1 | 17.9 | |
| Trial 3 | 1 | 7.98 | 7 | 0 | 21.2 | 17.9 | |
| Trial 4 | 1 | 7.94 | 6 | 0 | 16.6 | 18 | |
| Trial 5 | 0 | 7.77 | 7 | 0 | 17 | 18.2 | |
| MEAN | 0.6 | 7.902 | 6.8 | 0 | 16.9 | 18.04 | |
| Q Value | 70 | 83 | 79 | 100 | 70 | ||
| Moringa+Metal | Trial 1 | 1 | 7.73 | 7 | 0 | 16.4 | 18.1 |
| Trial 2 | 0 | 7.72 | 7.5 | 0 | 12.2 | 18.1 | |
| Trial 3 | 0 | 7.89 | 7 | 0 | 11.2 | 17.9 | |
| Trial 4 | 0 | 7.74 | 7.5 | 0 | 12.7 | 18 | |
| Trial 5 | 0 | 7.75 | 7.5 | 0 | 10.8 | 18 | |
| MEAN | 0.2 | 7.766 | 7.3 | 0 | 12.66 | 18.02 | |
| Q Value | 91 | 82 | 92 | 100 | 82 |
Table 2. Phosphate (ppm) levels before and after application of Moringa for trials 1-6.
| Control | Moringa | Moringa+Metal | |
| Before Application | 3.6 | 3.2 | 3.6 |
| After Application | 2.8 | 0.6 | 0.2 |
Graph 1. Phosphate (ppm) levels before and after application of Moringa for trials 1-6.

Table 3. Nitrate (ppm) levels before and after application of Moringa for trials 1-6.
| Control | Moringa | Moringa+Metal | |
| Before Application | 0 | 0 | 0 |
| After Application | 0 | 0 | 0 |
Graph 2. Nitrate (ppm) levels before and after application of Moringa for trials 1-6.

Table 4. Dissolved Oxygen (ppm) levels before and after application of Moringa for trials 1-6.
| Control | Moringa | Moringa+Metal | |
| Before Application | 8.26 | 8.27 | 8.25 |
| After Application | 7.83 | 7.90 | 7.77 |
Graph 3. Dissolved Oxygen (ppm) levels before and after application of Moringa for trials 1-6.

Table 5. pH levels before and after application of Moringa for trials 1-6.
| Control | Moringa | Moringa+Metal | |
| Before Application | 5.4 | 6.8 | 5.6 |
| After Application | 6.2 | 5.8 | 7.3 |
Graph 4. pH levels before and after application of Moringa for trials 1-6.

Table 6. Turbidity (NTU) levels before and after application of Moringa for trials 1-6.
| Control | Moringa | Moringa+Metal | |
| Before Application | 280.14 | 267.86 | 284.04 |
| After Application | 91.72 | 16.90 | 12.66 |
Graph 5. Turbidity (NTU) levels before and after application of Moringa for trials 1-6

VIII. ANALYSIS
Statistical Analysis
Table 7. Mean and Standard Deviation
| Hour 0 (before purification) | |||
| Type of Data Collection | Mean | Standard Deviation | |
| Control | Phosphate | 3.6 | 0.894427191 |
| Dissolved Oxygen | 8.26 | 0.08888194417 | |
| pH Levels | 5.4 | 0.5477225575 | |
| Nitrate | 0 | 0 | |
| Turbidity | 280.14 | 34.99725704 | |
| Temperature | 14.86 | 0.1673320053 | |
| Moringa | Phosphate | 3.2 | 1.095445115 |
| Dissolved Oxygen | 8.27 | 0.05019960159 | |
| pH Levels | 5.8 | 0.4472135955 | |
| Nitrate | 0 | 0 | |
| Turbidity | 267.86 | 39.87923018 | |
| Temperature | 14.68 | 0.1303840481 | |
| Moringa+Metal | Phosphate | 3.6 | 0.894427191 |
| Dissolved Oxygen | 8.25 | 41.24 | |
| pH Levels | 5.6 | 0.5477225575 | |
| Nitrate | 0 | 0 | |
| Turbidity | 284.04 | 25.67309876 | |
| Temperature | 14.7 | 0.2915475947 | |
| Hour 2 (after purification) | |||
| Type of Data Collection | Mean | Standard Deviation | |
| Control | Phosphate | 2.8 | 1.095445115 |
| Dissolved Oxygen | 7.32 | 0.06618156843 | |
| pH Levels | 6.2 | 0.2738612788 | |
| Nitrate | 0 | 0 | |
| Turbidity | 91.72 | 22.81549912 | |
| Temperature | 18.12 | 0.2774887385 | |
| Moringa | Phosphate | 0.6 | 0.5477225575 |
| Dissolved Oxygen | 7.9 | 0.07918333158 | |
| pH Levels | 6.8 | 0.4472135955 | |
| Nitrate | 0 | 0 | |
| Turbidity | 16.9 | 2.744084547 | |
| Temperature | 18.04 | 0.1516575089 | |
| Moringa+Metal | Phosphate | 0.2 | 0.4472135955 |
| Dissolved Oxygen | 7.77 | 0.07021395873 | |
| pH Levels | 7.3 | 0.2738612788 | |
| Nitrate | 0 | 0 | |
| Turbidity | 12.66 | 2.224410034 | |
| Temperature | 18.02 | 0.08366600265 |
The mean computes the average value of the trials in each data collection while the standard deviation measures how much the data varies from this mean. The formulas used are below:


Table 8. Standard Error of Mean
| Hour 0 (before purification) | ||
| Type of Data Collection | SEM Value | |
| Control | Phosphate | 0.4 |
| Dissolved Oxygen | 0.0397492138287 | |
| pH Levels | 0.244948974278 | |
| Nitrate | 0.0 | |
| Turbidity | 15.6512491514 | |
| Temperature | 0.0748331477355 | |
| Moringa | Phosphate | 0.489897948557 |
| Dissolved Oxygen | 0.0224499443206 | |
| pH Levels | 0.2 | |
| Nitrate | 0.0 | |
| Turbidity | 17.834533916 | |
| Temperature | 0.0583095189485 | |
| Moringa+Metal | Phosphate | 0.4 |
| Dissolved Oxygen | 0.0283548937575 | |
| pH Levels | 0.244948974278 | |
| Nitrate | 0.0 | |
| Turbidity | 11.4813588046 | |
| Temperature | 0.130384048104 | |
| Hour 2 (after purification) | ||
| Type of Data Collection | SEM Value | |
| Control | Phosphate | 0.489897948557 |
| Dissolved Oxygen | 0.0295972971739 | |
| pH Levels | 0.122474487139 | |
| Nitrate | 0.0 | |
| Turbidity | 10.2034013937 | |
| Temperature | 0.12409673646 | |
| Moringa | Phosphate | 0.244948974278 |
| Dissolved Oxygen | 0.0354118624193 | |
| pH Levels | 0.2 | |
| Nitrate | 0.0 | |
| Turbidity | 1.22719191653 | |
| Temperature | 0.0678232998313 | |
| Moringa+Metal | Phosphate | 0.2 |
| Dissolved Oxygen | 0.0314006369362 | |
| pH Levels | 0.122474487139 | |
| Nitrate | 0.0 | |
| Turbidity | 0.994786409236 | |
| Temperature | 0.0374165738677 |
The data collection using the various methods were calculated with both the SEM and the standard deviation to identify possible inaccuracies with the mean. The low SEM indicates a relatively accurate mean for further application. This essentially means the different trials produced very similar results. The other results are further identified. The estimated formula is below:

Table 9. T-test
| Hour 0 (before purification) | |||
| Type of Data Collection | Probability Value (p-value) | Meaning of p-value | |
| Moringa | Phosphate | 0.186950483 | Not Significant |
| Dissolved Oxygen | 0.276444717 | Not Significant | |
| pH Levels | 0.088903904 | Not Significant | |
| Nitrate | No Change | No Change | |
| Turbidity | 0.298015899 | Not Significant | |
| Moringa+Metal | Phosphate | 0.5 | Not Significant |
| Dissolved Oxygen | 0.365199492 | Not Significant | |
| pH Levels | 0.310654148 | Not Significant | |
| Nitrate | No Change | No Change | |
| Turbidity | 0.394553369 | Not Significant | |
| Hour 2 (after purification) | |||
| Type of Data Collection | Probability Value (p-value) | Meaning of p-value | |
| Moringa | Phosphate | 0.002090536 | Significant |
| Dissolved Oxygen | 0.0000127685 | Significant | |
| pH Levels | 0.016338962 | Significant | |
| Nitrate | No Change | No Change | |
| Turbidity | 0.001110683 | Significant | |
| Moringa+Metal | Phosphate | 0.001445004 | Significant |
| Dissolved Oxygen | 0.000298042 | Significant | |
| pH Levels | 0.002090536 | Significant | |
| Nitrate | No Change | Significant | |
| Turbidity | 0.000675008 | Significant |
A T-Test was conducted to confirm that the probability of a significant change caused by the variable, the Moringa water treatment, was lower than the alpha level, 0.05. The t-test met the condition of the simple random sample was met, as the data was randomly selected from a small portion of the population. A normal distribution is assumed with an alpha value of 0.05 as the level of significance. The samples were taken from a reasonably large sample size.The null hypothesis stated that the WQI levels would be in similar ranges for all three tests. The alternative hypothesis stated that there would be a statistically significant increase in WQI levels for the moringa-filtered water and the moringa+metal filtered water. By inputting the sample values into the formula, T-TEST values above were obtained. Since these values were less than 0.05, the alpha value, the null hypothesis was rejected. The probability that these results happened by chance are well below the alpha level of 0.05. This ultimately shows that in a period of 2 hours, the phosphate, dissolved oxygen, pH, turbidity, and coliform bacteria levels all experienced a significant change from the application of Moringa. The excel function used to calculate for the t-test is: =TTEST(*cell range of 5*).
Water Quality Index Score Calculations
Table 10. Rating water quality using the water quality index value
| WQI Value | Water Quality Rating |
| 91-100 | Excellent Water Quality |
| 71-90 | Good Water Quality |
| 51-70 | Average Water Quality |
| 26-50 | Fair Water Quality |
| 0-25 | Poor Water Quality |
Table 11. Control Water Quality Index Calculation Before Application
| Data Collection Method | Mean Values | Q-Value | Weighing factor | Total |
| Dissolved Oxygen | 8.26 ppm | 70 | 0.17 | 11.9 |
| pH | 5.4 | 36 | 0.11 | 3.96 |
| Nitrate | 0 ppm | 100 | 0.10 | 10 |
| Phosphate | 3.6 ppm | 17 | 0.10 | 1.7 |
| Turbidity | 280.14 NTU | 5 | 0.08 | 0.4 |
27.96/.56 =
Water Quality Index – 49.93
Description: Fair Water Quality
Table 12. Moringa Water Quality Index Calculation Before Application
| Data Collection Method | Mean Values | Q-Value | Weighing factor | Total |
| Dissolved Oxygen | 8.27 ppm | 67 | 0.17 | 11.39 |
| pH | 5.8 | 41 | 0.11 | 4.51 |
| Nitrate | 0 ppm | 100 | 0.10 | 10 |
| Phosphate | 3.2 ppm | 19 | 0.10 | 1.9 |
| Turbidity | 267.86 NTU | 6 | 0.08 | 0.48 |
28.28/.56 =
Water Quality Index – 50.5
Description: Fair Water Quality
Table 13. Moringa and Metal Water Quality Index Calculation Before Application
| Data Collection Method | Mean Values | Q-Value | Weighing factor | Total |
| Dissolved Oxygen | 8.25 ppm | 62 | 0.17 | 10.54 |
| pH | 5.6 | 41 | 0.11 | 4.51 |
| Nitrate | 0 ppm | 100 | 0.10 | 10 |
| Phosphate | 3.6 ppm | 17 | 0.10 | 1.7 |
| Turbidity | 284.04 NTU | 5 | 0.08 | 0.4 |
27.15/.56 =
Water Quality Index – 48.47
Description: Fair Water Quality
Table 14. Control Water Quality Index Calculation After Application (Post 2 hours)
| Data Collection Method | Mean Values | Q-Value | Weighing factor | Total |
| Dissolved Oxygen | 7.32 ppm | 68 | 0.17 | 11.56 |
| pH | 6.2 | 60 | 0.11 | 6.6 |
| Nitrate | 0 ppm | 100 | 0.10 | 10 |
| Phosphate | 2.8 ppm | 20 | 0.10 | 2.0 |
| Turbidity | 91.72 NTU | 20 | 0.08 | 1.6 |
31.76/.56 =
Water Quality Index – 56.71
Description: Average Water Quality
Table 15. Moringa Water Quality Index Calculation After Application (Post 2 hours)
| Data Collection Method | Mean Values | Q-Value | Weighing factor | Total |
| Dissolved Oxygen | 7.9 ppm | 83 | 0.17 | 14.11 |
| pH | 6.8 | 79 | 0.11tt | 8.69 |
| Nitrate | 0 ppm | 100 | 0.10 | 10 |
| Phosphate | 0.6 ppm | 70 | 0.10 | 7.0 |
| Turbidity | 16.9 NTU | 70 | 0.08 | 5.6 |
45.4/.56 =
Water Quality Index – 81.07
Description: Good Water Quality
Table 16. Moringa and Metal Water Quality Index Calculation After Application(Post 2 hours)
| Data Collection Method | Mean Values | Q-Value | Weighing factor | Total |
| Dissolved Oxygen | 7.77 ppm | 82 | 0.17 | 13.94 |
| pH | 7.3 | 92 | 0.11 | 10.12 |
| Nitrate | 0 ppm | 100 | 0.10 | 10 |
| Phosphate | 0.2 ppm | 91 | 0.10 | 9.1 |
| Turbidity | 12.66 NTU | 82 | 0.08 | 6.56 |
49.72/.56 =
Water Quality Index – 88.79
Description: Good Water Quality
Interpretation of Analysis
Dissolved Oxygen
There were three separate solutions that were taken from the samples of water. The solution that was selected as the control averaged 8.26 ppm at a temperature of 14.86°C before. In two hours, the control’s dissolved oxygen ppm deteriorated to 7.324 ppm at a temperature of 18.12°C. The solution that consisted of moringa had initial levels of 8.272 ppm at a temperature of 14.68°C. The dissolved oxygen levels then reduced to 7.902 ppm at 18.04°C. These reductions in dissolved oxygen may be due to the excess plant growth in the solution, which may have caused the reproduction of decomposers. The solution that consisted of moringa and copper initially started off with levels with 8.248 ppm at 14.7°C. Once the solution was applied and two hours had passed, the levels then went to 7.766 ppm at a temperature of 18.02°C. This is a positive indicator of good water, as does not show evidence of eutrophication or additional plant growth. Once the results were acquired, a T-Test was conducted in order to verify that the initial water samples were not significantly different, and to see if the application of the solutions had a significant difference. The test was conducted at an alpha level of 0.05. The first t-test compared the initial samples with the control group to identify if there was any difference in he samples acquired. The sample with only moringa had a p value of 0.276444717 when compared to the control group. The control and the moringa+copper solution had a p value of 0.310654148. These two values show that the moringa solution and the moringa+copper solution both weren’t significantly different to the control’s level of dissolved oxygen, allowing us to proceed with the investigation. The t-test results for the control and the moringa for after application results were at a p value of 0.0000127685. The t-test results for the control and the moringa+copper were at a p value of 0.000298042. Both results were significant at an alpha level of 0.05, which shows that the chances these results happened without the application of the solutions were very low. Now on a surface level, these results may look detrimental to the water quality. However, Dissolved Oxygen Levels naturally decrease as the temperature rises. This is because the solubility of oxygen decreases as the temperature increases because warmer surface water requires less dissolved oxygen to reach 100% air saturation. The water was initially extracted from the pond 30 minutes before the trials. The reason the water wasn’t situated to reach room temperature was because the Water Quality Index Score naturally makes up for the disparities in temperature by normalizing all the scores since Dissolved Oxygen levels naturally go down as the water temperature increases. In the previous trials, the control’s WQI score went down from 70 to 68. However the WQI scores for moringa went up from 67 to 83, and went up from 62 to 82. All Dissolved oxygen levels decreased but the control deteriorated much more quickly. This can be attributed to the moringa oleifera plant’s purifying capabilities and antibacterial capabilities. The moringa effectively reduced phosphate levels while also killing the bacteria with the Moringa Oleifera Cationic Protein. This prevented the Eutrophication — this was based on the clarity of the water, which would typically take place when there are high amounts of phosphate). The moringa alone increased the WQI score by 16. There wasn’t a significant difference between the moringa solution and the moringa+copper solution as the moringa solution increased by 16 and the moringa+copper solution increased by 20. This shows that the copper didn’t have much of an effect on the Dissolved Oxygen Levels. However, there was a slight improvement so the copper can’t be determined as having no change. Overall, the moringa solution had the highest WQI score, but the moringa+copper solution showed the greatest difference in the score.
Phosphate
Initially, phosphate levels were recorded before the application of the solution. The control initially had phosphate levels of 3.6 ppm with a WQI score of 17, the moringa solution had 3.2 ppm with a WQI score of 19, and the moringa+copper solution had 3.6 ppm with a WQI score of 17 as well. T-Tests were conducted between the water samples to ensure that they weren’t significantly different in order to effectively compare the results post application. The p value for the comparison between the control and the moringa was p = 0.186950483 and the p value for the comparison between the control and the moringa was p = 0.5. Both of these results show that comparisons can effectively be made. Once solutions were applied, the phosphate levels in the the control sample reduced to 2.8 ppm, the moringa solution reduced to 0.6 ppm and the moringa+copper solution reduced to 0.2 ppm. T-Tests were then performed for the after application results. For the moringa solution, the p value = 0.002090536 while for the moringa+copper solution, the p value = 0.001445004. These values show that the results were statistically significant. When comparing WQI scores, Moringa+Metal had the highest score with 91 as well as the most significant increase with a 74 point margin between the pre trials and post trials. These results can primarily be attributed to the moringa’s ability to remove pollutants. The Moringa Oleifera Cationic Protein fuses the negative phosphate particles in order to increase the density of the clumps over 1. Once it increases the density, the phosphate clumps sink to the ground which then reduces the phosphate levels. The copper also played a major role in the removal of phosphate from the water as the copper rod attracted phosphate particles. Once the purification process was over, the copper rod could simply be removed with a majority of the metal particles, and the water would be effectively purified.
Nitrate
Every measurement in every sample of nitrate was 0 ppm. Once the solution was applied, the nitrate still stayed at a level of 0 ppm. This doesn’t necessarily show that the moringa was effective in purifying the water. However, it does show that the Moringa did not exacerbate the nitrate by increasing the levels. The resulting WQI score was 100 for every sample before and after. The Nitrate was the same weighing factor so it didn’t make a difference for any distinctions between the water samples. Therefore, results are left inclusive.
Turbidity
Initially, the pre trial measurements for turbidity in the control sample was 280.14 NTU (Nephelometric Turbidity Measurement) with a WQI score of 5. The turbidity for the moringa sample pre trial was 267.86 NTU with a WQI score of 6, and turbidity for the moringa+copper sample pre trial was 284.04 NTU with a WQI score of 5. T-Tests were conducted for these samples to ensure that the samples could effectively be compared. The p-value for the control sample and the moringa sample comparison was 0.298015899 while the p-value for the control sample and the moringa+copper sample was 0.394553369. At an alpha level of 0.05, both of these results are considered not significant. This confirmed that the results for post-trial could be compared. Once the solutions were applied to the water, it was left in the solution to effectively purify the water. Then the turbidity of the control was 91.72 NTU with a WQI score of 20. The turbidity of the moringa solution was 16.9 NTU with a WQI score of 70. The turbidity of the moringa+copper solution was 12.66 NTU with a WQI score of 82. When conducting the T-Tests, the comparison between the moringa sample and the control had a p-value of 0.001110683 and the comparison between the moringa+copper sample and the control sample had a p value of 0.000675008. At an alpha level of 0.05, the p value would be considered significant, and with the extremely low p-value, the chances of the results happening by chance are 0.00111. When looking at all WQI scores, initially, all the scores were very low. The moringa managed to improve the WQI score by 64 points, while the moringa+copper application made the WQI score increase by 77 points. Overall, the moringa+copper resulted in the highest difference in WQI scores and also had the highest score. When specifically looking at the Moringa Oleifera Plants abilities to purify water, it uses the Moringa Oleifera Cationic Protein, a positively charged protein, to attract negatively charged particles that include dirt, clay, and bacteria. By doing this, it clumps particles together until the mass has reached over 1 to overcome the density of the water. Once this process occurs, the clumps sink to the bottom of the container. This drastically increases the turbidity. The copper also attracts additional negatively charged particles with its positive chargeThat’s why when both copper and MOCP are paired together, it results in the best turbidity. Overall, the turbidity showed the most substantial improvement out of all the methods in the WQI.
pH
Initial Levels of the control for pH were 5.4 with a WQI score of 37. The pre-trial levels for the moringa solution is 5.8 with a WQI score of 44. The pre-trial levels for the moringa+metal is 5.6 with a WQI score of 41. T-Tests were conducted in order to verify that the samples could be compared. The comparison between the control and moringa had a p-value of 0.088903904, and the comparison between the control sample and the moringa+metal sample had a p-value of 0.310654148. At an alpha level of 0.05, both these results can be deemed as not significant at an alpha level of 0.05 which shows that the two samples can effectively be compared to the control sample. Now, once the solutions were applied and left to sit for two hours, the pH was measured as 6.2 at a WQI score of 60 for the control sample, and the pH was measured at 6.8 at a WQI score of 79 for the moringa solution, while the pH was 7.3 at a WQI score of 92 for the moringa+copper solution. T-Tests were then conducted again to compare the results. The comparison between the control and the moringa sample resulted in a p-value of 0.016338962, while the comparison between the control and the moringa+copper resulted in a p-value 0.002090536. The alpha level of 0.05 is the probability of rejecting the null hypothesis when the null hypothesis is true, meaning we are reasonably confident to reject the idea that the before and after solutions were equal, in favor of the conclusion that the moringa and moringa+copper improved the water quality of the solution. The moringa’s purification capabilities can be attributed to the MOCP. The MOCP clumps various pollutants including dirt, bacteria, and various detrimental minerals. By using its positively charged protein, MOCP attracts these negative particles, and increases the density above 1 in order to bring the bacteria to the bottom of the container. Copper also contains a positively charged cationic protein. This is another method that also attracts many negatively charged particles. This is why when copper and moringa are combined, it results in a pH that is closer to 7.5. With moringa alone, the pH is 6.8. Overall, the moringa+copper resulted in the highest increase of WQI with an increase of 51 point increase, while the moringa also had substantial improvement with an increase of 35 points.
Water Quality Index
The water quality index is a universal water quality score used to compare water quality in the United States of America. Each element of the index (with the exception of fecal coliform, BOD, and temperature) is important to define a water sample’s quality and was used to test the flocculating capabilities of the Moringa. Through the q value calculations and weighing factors of the mean values, the water quality index for before application are 49.93, 50.5, and 48.47 for control, moringa, and moringa+metal combination respectively. The water quality index for after application are 56.71, 81.07, and 88.79 for control, moringa, and moringa+metal combination respectively. Over the 2 hour span, the control sample of water moved from fair to average water quality, undrinkable in both cases. The water samples treated with just moringa moved from fair water quality to good water quality, allowing for safe drinkability. Additionally, the water samples treated with both the moringa and metal moved from fair water quality to good water quality, a couple points away from excellent water quality, allowing for safe drinkability.
T-test
The results from the various t-test conducted indicate that the purification of the Moringa and the Moringa with the metal were both effective in the purification of the water. The comparison before the application all resulted in insignificant results, as the p values for all the tests (with the exception of nitrate, which did not change) were greater than the alpha level of 0.05. This suggests that there was minimal difference between the various groups, which is expected as all of the water samples came from the same container, further confirming that the results were not skewed due to varying degrees of purity from the beginning.
IX. CONCLUSION
The levels of pH, dissolved oxygen, phosphate, nitrate, and turbidity of water from a natural source substantially improved in the water samples treated with Moringa and the water samples treated with both Moringa and Copper, deeming the water as “good water quality” according to the official water quality index. This accurately demonstrated the flocculating capabilities of the Moringa oleifera plant and the antibacterial capabilities of both the Moringa oleifera plant and Oligodynamic metal as hypothesized.
Prior to the application of the Moringa and the Oligodynamic metals, the samples from the Martel Pond exhibited “fair water quality” for the two experimental groups and the control, all averaging a water quality index score of about 49.63. This deemed the water unsafe for prolonged usage, as the bacteria and other impurities in the water may be harmful for the average individual. Every tested category of quantitative water quality (with the exception of nitrate as it began with 0 ppm) was consistently at dangerous levels, with turbidity ranging from 267.86 NTU to 284.04 NTU, pH averaging a very acidic level of 5.6, and the dissolved oxygen averaging a high 8.26 ppm. Once the solution was applied, results were measured after two hours. The phosphate levels, which is harmful in large amounts, decreased to about 2.8 ppm for the control while the moringa solution had a level of 0.6 ppm. The phosphate levels for the moringa+metal solution had a level of 0.2 ppm. The dissolved oxygen levels for the control reduced to 7.36 ppm. The dissolved oxygen levels didn’t decrease as much for the moringa and the moringa+copper solutions with levels of 7.9 ppm and 7.8 ppm respectively. Furthermore, the control group’s pH levels increased to 6.2, an insignificant increase. The moringa solution, on the other hand, had a significant increase to a level of 6.8. The most substantial improvement, however, came in the moringa+copper solution with a pH of 7.3. The combination of both the cationic proteins resulted in the most bacteria being killed. When just moringa was alone, it wasn’t as large an increase. The nitrate levels stayed at a constant level of 0 the entire trial. The turbidity decreased to 91.72 NTU for the control group while the turbidity decreased to 16.9 NTU for the moringa solution. The moringa+copper solution was reduced to nearly 12.66 NTU. Again, the proteins clumping the silt to the bottom of the container decreased the turbidity for the moringa and moringa+copper solutions.
This significant improvement in water quality after application in the moringa and moringa with copper best exemplifies the purification properties of the Moringa oleifera plant and the copper. Prior to the application of Moringa and the Copper, the high amounts of impurities, bacteria, and other pollutants caused low amounts of light to pass through, unsafe oxygen levels, excessive nutrient levels, and acidic pH. Specifically, the application of the Moringa alone caused the pollutants to coagulate and eventually settle, leaving the rest of the water safe to drink. For the cells of living things, both prokaryotes and eukaryotes, a plasma membrane is required in order to perform even the most basic functions such as cell security, mitosis, meiosis (if applicable), and other processes. The leading principle behind the purification capabilities of the Moringa powder is the presence of eighteen different proteins, especially a positively-charged protein called the Moringa Oleifera Cationic Protein (MOCP). The Moringa then undergoes a process of fusion of the cell membranes of the bacteria and other microbial organisms because the positively charged Moringa protein attracts the negatively charged substances in nature. The organism is then killed due to a lack of adequate protection for survival. Furthermore, this attraction, along with the aggregation properties of the protein, causes the “clumping” of various impurities. Eventually, the increase in density of these “clumps” causes the pollutants to sink with gravity. The chemical compound of acetone, which is in the moringa, has antibacterial properties which explains the possible absence of coliform bacteria once the moringa was applied. The acetone inhibits the growth of bacteria. On the other hand, the copper contains a positive cation that attracts negatively charged impurities. Other studies have shown that copper as a wire is lethal to E. Coli, especially in the presence of organic and inorganic pollutants in the water. Furthermore, laboratory experiments have also confirmed that copper is able to kill organisms like S. enterica and Staphylococcus aureus, suggesting that copper can damage many types of bacteria under different water conditions. This combination of both the cations of the copper and the MOCP from the moringa results in the most significant improvement of the water purity levels.
The removal of the impurities manifested significant improvements in every data collection category (with the exception of nitrate, which contained 0 prior to testing), contributing to the shift from “fair” to “good” or “excellent” water quality for the moringa+copper solution and shifted from “fair” to “good” for the moringa solution. The presence of the NTU even after application may be from the small particles of Moringa still present. Although this does make the water more turbid, this is a natural purifier, meaning it is safe (actually beneficial for health) to consume. In addition, the lack of nitrate presence even prior to application demonstrates that there is no conclusive evidence of purification capabilities of Moringa for nitrate. However, this confirmed that the Moringa also did not exacerbate the nitrate by increasing the levels as well. The decrease in dissolved oxygen was still proportionally greater when looking at it from a Q-value perspective, it still improved the quality of the water. The remaining phosphate and pH improvements were a direct effect of the “clumping” of the pollutants in the water. The copper rod can easily be removed with all the impurities it attracts, so it did make a large impact on the overall NTU. The copper significantly improved every single statistical category except the Dissolved Oxygen, where there wasn’t as substantial improvement.
X. SOURCES OF ERROR
There were multiple sources of error. First, the charts used to calculate nitrate and phosphate levels were limited in its range. The charts had a maximum that could have been easily surpassed by the actual level found in the water. This affected the tests for the water quality index, because the levels could have been higher, and could have potentially shown a more substantial increase than it already was right now. Another error is the perception of water clarity. The levels were determined by the human eye by comparing the shade of the color in the vial, to a chart that showed the respective levels to each shade of color. There is a good likelihood that the color could have been perceived as lighter or darker than it actually is, thus also adjusting the water quality index score. Although it was unintentional, the amount of water from each trial that came through the filter was slightly different. This could slightly change results because there was a set specific amount of water that should have been used for each test. It was attempted to keep a constant water temperature, but since it was a classroom, outside heat and air conditioning affected the overall temperature.
XI. APPLICATION
Accessibility
The Moringa Plant is native to Africa and is found virtually everywhere in Africa and Asia. This is extremely important because likewise, Asia and Africa have the most water-related problems. The Moringa Oleifera is found in countries such as West, East, and South Africa, tropical Asia, Latin America, the Caribbean, Florida, and the Pacific Islands. The Moringa can fight through droughts and arid conditions. It is also conditioned to grow in humid tropical weather. India is by far the largest consumer of the product producing around 1.2 million tons of plant a year. The cultivation in the plant, however, is gaining popularity in Africa, Central America, and the Caribbean. Furthermore, the physical acquisition of the Moringa is also very accessible. It lies low to the ground and contains many seeds for a single plant. The Moringa is a horseradish tree and is widely grown for its seed pods and leaves that are used for traditional herbal medicines.
For about 5,000 years, copper was the only known metal of mankind. Today, copper is still one of the most used metals across the globe. In fact, the known worldwide copper levels are now more than 5.8 trillion pounds, and only 12% has been mined. Furthermore, it is also the most reusable resource in the world, as it’s recycling rate is the highest out of any other metal. Africa, where many of the water issues arise, is very rich in copper as well.
Water Problem
About 783 million people don’t have access to clean water worldwide. This is nearly 10% of the population. Around 443 million school days are lost due to water related diseases, heavily impacting kids’ educations—not only because of unsafe water, but also because of extreme amounts of time spent collecting water By having to go to these drastic measures, they become increasingly susceptible to diseases such as malaria, and typhoid fever. About 200 million hours are spent every single day by women and girls to get water. Not only is this water still dirty, but it is the only water that they have. Every two minutes a child dies due to a water-related disease.
Environmentally Friendly
The natural quality of the Moringa plant is important as the plant can be used for other nutritional benefits. Many people in Asia consume the vegetable because it provides many nutrients such as protein, vitamin b6, vitamin C, iron, riboflavin, vitamin A, and magnesium. In many developing countries, not only can this plant’s seeds be ground to purify the water, the seeds and plant itself can be consumed for many essential nutrients that might not be affordable. It is also rich in antioxidants such as Quercetin and Chlorogenic Acid that can help fight against disease. It also helps lower blood sugar levels and reduces inflammation. The list still continues with the possibility of this plant reducing cholesterol.The roots of the Moringa have an extremely high nutrient quantity and can be used for so many things and provides a plethora of health benefits. Overall, it is a super-plant and can provide many benefits for those in poverty, as well as people that need the vitamins. Copper is also one of the most important metals in the human body because it helps maintain healthy bones, and helps maintain an immune system.
Efficiency
The Moringa oleifera is extremely effective in purifying water. It helps nearly every single category tested. From bringing the Phosphate Levels and Turbidity levels down, to making the pH at a perfect category, to increasing the Dissolved Oxygen levels, the Moringa is effective all around. Moringa is also very accessible and can be found on street sides in India for a few mere rupees. The cost and the effectiveness of this plant is a life changer in that it can actually purify the water and significantly reduce the chance of getting a water disease.
XII. IDEAS FOR FUTURE RESEARCH
The Moringa is known as a super plant because of its various medicinal properties. Virtually every part of the Moringa has a benefit for the body. Future research could encompass other fields by studying the medicinal properties of the Moringa and apply it to diseases like diabetes and blood pressure. This project is simply a pathway into exploring all the properties of this incredible plant. Furthermore, the plant has properties to support brain health. This characteristic may lead to further research in and application of Moringa to solve mental disorders like Alzheimer’s disease. The use of Moringa is very prevalent in the Indian diet. This can spawn further research studies on how this can affect an individual’s long term health.


