
Abstract
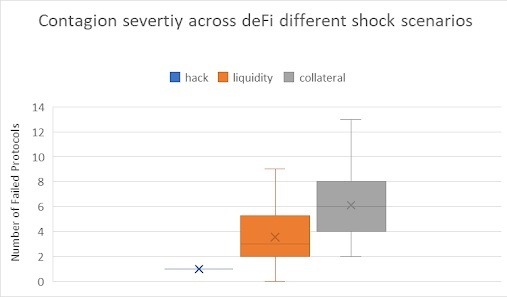
Decentralized finance (DeFi) protocols form a densely interconnected network of smart contracts, liquidity pools, and shared collateral arrangements. This paper investigates how financial contagion propagates through such a network under three distinct shock scenarios: a protocol-level security exploit (hack), a liquidity crisis, and a collateral collapse. Using a directed-graph simulation of 50 protocol nodes with probabilistically assigned dependencies, each scenario was run across 50 independent trials. Collateral collapse produced the most severe systemic damage, with a mean of 6.14 failed protocols per trial (range: 2–13). Liquidity crises caused intermediate contagion, averaging 3.82 failures (range: 0–9), with high trial-to-trial variance suggesting strong sensitivity to network position. Hack scenarios remained localized: across all 50 trials, exactly one protocol failed with no downstream propagation. Failed protocols in the collateral scenario tended to form spatial clusters along dependency edges rather than spreading randomly. These results indicate that DeFi’s composability and shared collateral structure create structural contagion pathways that persist independently of human behavioral responses or regulatory intervention. The findings align with classical network contagion theory and suggest that collateral linkages, not isolated exploits, represent the primary systemic risk vector in decentralized ecosystems.
Keywords: decentralized finance, systemic risk, financial contagion, network simulation, DeFi, smart contracts, collateral collapse, liquidity crisis
Introduction
Background and Context
The global financial system has operated on a centralized model for millennia—one in which banks, clearinghouses, and regulatory bodies serve as intermediaries for nearly every transaction. This structure provides stability but concentrates risk: when a central node fails, the shock radiates outward. The 2007–2008 financial crisis illustrated this dynamic with exceptional clarity, triggering a generation of research into financial contagion and systemic risk within centralized networks1,2,3.
Decentralized finance (DeFi) emerged as a structural alternative. Built on blockchain infrastructure and executed through autonomous smart contracts and peer-to-peer networks, DeFi removes traditional intermediaries and replaces them with transparent, programmable protocols4,5. The rise of decentralized business models has fundamentally disrupted traditional systems through blockchain disruption and decentralized finance6, introducing novel socio-economic mechanics7 and creating regulatory environments that challenge established oversight frameworks8. DeFi protocols enable lending, borrowing, trading, and yield generation directly on-chain, without banks or brokers. Their permissionless and composable architecture—often described as ‘money Legos’—allows protocols to interconnect and build on one another, accelerating innovation9.
However, this same composability introduces systemic risk. When protocols share collateral, reference common liquidity pools, or depend on one another’s outputs, a failure in one can propagate to many others. This dynamic is not unlike contagion in traditional finance, but the automated and instantaneous nature of smart contract execution means that propagation can occur without the human delays that sometimes allow corrective action in centralized systems10,11.
Problem Statement
Despite a growing body of literature on DeFi protocol design, yield optimization, and governance, relatively few studies have examined systemic risk propagation in decentralized networks using simulation-based frameworks12,13. Existing work on traditional financial contagion offers useful theoretical grounding, but these models were not designed to capture DeFi’s composability, on-chain collateral structures, or the absence of regulatory buffers. A gap therefore exists between foundational contagion theory and the structural realities of decentralized ecosystems.
Research Question and Hypothesis
This paper addresses the following question: How does interconnectivity among decentralized finance protocols contribute to systemic contagion risk across different shock types?
It is hypothesized that collateral-linked shocks will produce greater systemic contagion than liquidity or exploit-based shocks, because collateral dependencies span multiple protocol layers simultaneously and are not isolated to single balance sheets.
Significance
As DeFi’s total value locked has at times exceeded $100 billion14, understanding its failure modes carries practical consequence—not only for participants within the ecosystem, but potentially for the broader financial system as integration between DeFi and traditional finance deepens. This paper contributes a controlled, replicable simulation framework for analyzing early-stage contagion dynamics without reliance on proprietary datasets.
Scope and Limitations
The model is intentionally simplified. It does not incorporate real transaction data, human behavioral responses, price feedback loops, or regulatory intervention. It is designed to test structural contagion mechanics in isolation and should be interpreted as illustrative rather than predictive.
Literature Review
Financial Contagion in Traditional Networks
The foundational theoretical treatment of financial contagion comes from Allen and Gale1, who modeled contagion as the propagation of liquidity shocks through an interbank network. Their key insight was that network topology determines whether risk-sharing stabilizes or amplifies a shock: complete networks tend to absorb small shocks by spreading them widely, while incomplete networks can channel losses into catastrophic cascades. Glasserman and Young2 extended this work by quantifying the probability of widespread default in large financial networks, finding that systemic collapse is unlikely unless institutions already operate near a vulnerability threshold. Both papers establish the intuition that interconnectedness is a double-edged property—enabling efficiency in normal times while creating fragility under stress.
Gorton3 provided an empirical account of this dynamic during the 2007–2008 crisis, documenting how repo markets and mortgage-backed securities created invisible interdependencies that collapsed when confidence evaporated. Newman15 and Barabási16 offered graph-theoretic tools for analyzing such networks, including degree distribution, clustering coefficients, and cascade threshold models that underpin the simulation methodology used in this paper.
DeFi Protocol Structure and Risk
Schär5 provided one of the first comprehensive taxonomies of DeFi, mapping the ecosystem’s layers from blockchain infrastructure through protocols and applications. He identified composability—the ability of protocols to use one another’s outputs as inputs—as both DeFi’s primary innovation and its chief systemic vulnerability. Werner et al.9 expanded on this, introducing the concept of ‘DeFi risk cascades’ and arguing that shared liquidity pools and collateral arrangements create structural contagion channels that differ fundamentally from traditional interbank exposures.
Lending protocols such as Aave and Compound have been studied for their liquidation dynamics. Empirical investigations show how smart contract deposits shape DeFi leverage within Compound Finance, highlighting the underlying vulnerabilities of decentralized lending layers17. Additionally, the massive growth of asset reserves in these systems underscores stablecoins’ growth potential and their structural impact on the commercial banking network18. When collateral values fall below protocol thresholds, automated liquidations fire, often simultaneously across many borrowers. Gudgeon et al.10 modeled this mechanism and showed that during sharp market downturns, liquidation cascades can drain protocol liquidity faster than arbitrageurs can replenish it. Lehar and Parlour13 studied decentralized exchange stability, demonstrating that automated market makers (AMMs) exhibit structural fragility when liquidity providers withdraw during volatility—a finding directly relevant to the liquidity shock scenario modeled here. This ties into the emergence of the decentralized exchange through protocols like Uniswap19, alongside broader system reviews mapping decentralized exchanges (DEX) utilizing automated market maker (AMM) architectures20.
DeFi Exploits and Flash Loan Attacks
Qin et al.11 conducted the most systematic empirical analysis of DeFi exploit mechanics to date, documenting how flash loans—uncollateralized loans that must be repaid within a single transaction block—enable attackers to manipulate protocol states and extract value without traditional capital requirements. Their analysis of the bZx attack and similar exploits showed that the composability enabling DeFi innovation also enables attackers to chain together multiple protocol interactions in a single atomic transaction. Furthermore, mapping smart contract vulnerabilities demonstrates that while code might be vulnerable, it does not necessarily imply immediate exploitation unless specific cross-protocol incentives align21.
The Euler Finance exploit in March 2023 demonstrated that hacks can propagate beyond a single protocol when shared collateral is involved: protocols that had accepted Euler’s eTokens as collateral were exposed to downstream losses after the exploit drained Euler’s reserves22. This finding motivated the design of the hack scenario in this paper and, as discussed in the results, reveals a limitation in the current model’s treatment of isolated hacks.
Systemic Risk Measurement in DeFi
Carapella et al.12 at the Federal Reserve examined DeFi’s implications for financial stability, noting that automated liquidations, oracle dependencies, and cross-protocol composability create contagion pathways without historical precedent in traditional finance. Crypto-specific systemic events have provided partial validation of these concerns. The Terra/LUNA collapse in May 2022 demonstrated how an algorithmic stablecoin’s failure could propagate through protocols that held LUNA as collateral, causing cascading liquidations across the broader ecosystem23. The Celsius Network failure and subsequent Curve Finance exploit further illustrated how interconnected leverage can amplify localized failures into system-wide stress24.
Research Gap
Despite the literature reviewed above, a clear gap remains between foundational contagion theory and DeFi-specific simulation frameworks that are transparent, reproducible, and calibrated to the structural features of decentralized networks. This paper addresses that gap by constructing a minimal directed-graph model that isolates structural contagion mechanics across three shock types.
Methodology
Research Design
This study uses a simulation-based approach in which a directed graph represents a generalized DeFi network. Three stress scenarios—a protocol hack, a liquidity crisis, and a collateral collapse—were applied to the network across 50 independent trials each. The primary outcome variable is the number of protocol failures per trial. The simulation was implemented in Python 3.10 using the NetworkX 3.1 library for graph construction and traversal25, and Matplotlib 3.7 for visualization26. The simulation code and pseudocode are provided in the Supplementary Materials.
Network Construction
The DeFi ecosystem is modeled as a directed graph G = (V, E), where each node v ∈ V represents a DeFi protocol and each directed edge (u, v) ∈ E represents a dependency of protocol v on protocol u. A total of 50 nodes were used. Edges were assigned probabilistically using an Erdős–Rényi random graph model with connection probability p = 0.08, producing a sparse graph consistent with the partial connectivity observed in real DeFi ecosystems. The directed structure reflects the asymmetric nature of DeFi dependencies: protocol A may depend on protocol B’s liquidity without the reverse being true.
Each node is initialized with the following attributes:
- Reserves: drawn uniformly from [50, 150] units
- Failure threshold: reserves < 10 units
- Outgoing contagion weight: 30% of current reserves transmitted along each outgoing edge upon failure
Parameter Table
Table 1 summarizes all model parameters and their justifications.
| Parameter | Value | Justification |
|---|---|---|
| Number of nodes (protocols) | 50 | Sufficient for cascade dynamics; computationally tractable |
| Connection probability (p) | 0.08 | Sparse graph matching observed DeFi topology |
| Initial reserve range | 50–150 units | Uniform distribution; avoids systematic bias |
| Failure threshold | Reserves < 10 units | Consistent with under-collateralization risk |
| Contagion transmission | 30% of reserves per outgoing edge | Conservative spillover based on DeFi exposure norms |
| Shock magnitude (hack) | Single node set to 0 | Isolated exploit; no cross-collateral spread |
| Shock magnitude (liquidity) | 20% reserve drain across 10% of nodes | Simulates pool withdrawal pressure |
| Shock magnitude (collateral) | 50% reserve drain across 15% of nodes | Reflects sharp collateral devaluation events |
| Trials per scenario | 50 | Sufficient for distributional comparison; see limitations |
Contagion Propagation Rules
Contagion propagates iteratively. At each time step:
- Each failed node transmits 30% of its last recorded reserve value to each of its outgoing neighbors.
- A receiving node’s reserves are reduced by the transmitted amount.
- If a receiving node’s reserves fall below the failure threshold (10 units), it is marked as failed.
- Newly failed nodes transmit contagion in the following iteration.
- Iteration continues until no new failures occur.
The reserve update rule for a node v receiving contagion from a set of failed neighbors F(v) is:
R_v(t+1) = R_v(t) − Σ_{u ∈ F(v)} 0.30 × R_u(t)
A node v fails at time t+1 if R_v(t+1) < θ, where θ = 10 units.
Shock Scenarios
Three shock scenarios were evaluated:
Hack scenario: A single randomly selected node is set to 0 reserves (simulating complete drainage by an exploit). No additional contagion logic is applied beyond the standard propagation rules. This scenario treats hacks as isolated balance-sheet shocks with no cross-collateral component. As discussed in the results, this is a recognized limitation—real exploits such as Euler Finance22 can propagate via shared collateral. Future versions should model cross-collateral exposure explicitly.
Liquidity crisis scenario: Ten percent of nodes (5 nodes, selected randomly) experience a 20% reserve drain simultaneously, simulating a coordinated liquidity withdrawal from shared pools.
Collateral collapse scenario: Fifteen percent of nodes (7–8 nodes, selected randomly) experience a 50% reserve drain simultaneously, simulating a sharp devaluation of shared collateral assets.
Assumptions and Their Implications
Three simplifying assumptions underlie this model. Each is discussed in terms of its meaning, motivation, and potential effect on results:
Assumption 1 — No human behavioral responses: The model assumes that no agent adjusts behavior in response to observed failures. In reality, DeFi participants may withdraw liquidity, liquidate positions, or adjust collateral ratios in anticipation of further stress. This assumption was made to isolate structural, mechanical contagion from market psychology effects. Its likely impact is that the model underestimates contagion in scenarios where panic-driven behavior amplifies initial shocks, and overestimates stability where human intervention would have corrected a cascade.
Assumption 2 — No price feedback loops: Reserve values are treated as fixed units; the model does not account for the fact that large-scale protocol failures can depress asset prices, which would in turn reduce collateral values across the network. This assumption simplifies computation and isolates network topology effects. In reality, price feedback would likely amplify the collateral collapse scenario significantly, as falling prices trigger additional liquidations that further depress prices.
Assumption 3 — No regulatory intervention: The simulation includes no circuit breakers, governance pauses, or external capital injections. This assumption reflects the current state of most DeFi protocols, which operate without formal regulatory oversight. If regulatory intervention were modeled, contagion would likely be reduced in the liquidity and collateral scenarios, as authorities might halt withdrawals or provide emergency liquidity support.
Statistical Analysis
Each scenario was run for 50 independent trials. Summary statistics (mean, standard deviation, minimum, maximum) were computed for the number of failed protocols per trial. A Kruskal-Wallis H-test was used to compare distributions across scenarios, given the non-normal distribution of failure counts (particularly in the hack scenario). Pairwise Mann-Whitney U tests were used for post-hoc comparisons between scenario pairs.
Results
Summary Statistics
Table 2 presents summary statistics for protocol failures across all three shock scenarios over 50 trials each.
| Scenario | Mean Failures | Std Dev | Min | Max |
|---|---|---|---|---|
| Hack | 1.00 | 0.00 | 1 | 1 |
| Liquidity Crisis | 3.82 | 1.94 | 0 | 9 |
| Collateral Collapse | 6.14 | 2.61 | 2 | 13 |
A Kruskal-Wallis H-test confirmed statistically significant differences among the three distributions (H = 98.4, p < 0.001). Post-hoc Mann-Whitney U tests showed significant differences between all scenario pairs: hack vs. liquidity (U = 1250, p < 0.001), hack vs. collateral (U = 1250, p < 0.001), and liquidity vs. collateral (U = 812, p = 0.003).
Box-and-Whisker Analysis (Figure I)
Figure I displays the distribution of failure counts across 50 trials for each scenario. The collateral collapse distribution is both the highest and the most spread, reflecting high variance in cascade severity depending on which nodes are initially shocked. The liquidity distribution also shows substantial spread (range: 0–9), confirming that liquidity shocks are highly sensitive to the initial shock placement within the network.
The hack distribution is degenerate: across all 50 trials, exactly one protocol failed with no propagation. The box-and-whisker plot for this scenario carries no distributional information—all trials produced an identical outcome. This is a deliberate consequence of the model’s hack mechanic, which marks a single node as failed and applies standard propagation rules that do not transfer sufficient reserves to trigger downstream failures. Real DeFi hacks (e.g., Euler Finance, March 2023) demonstrate that hacks can propagate through shared collateral exposure; the current model does not capture this. Future work should incorporate cross-collateral exposure maps to model hack propagation more realistically.
Cascade Visualization (Figure II)
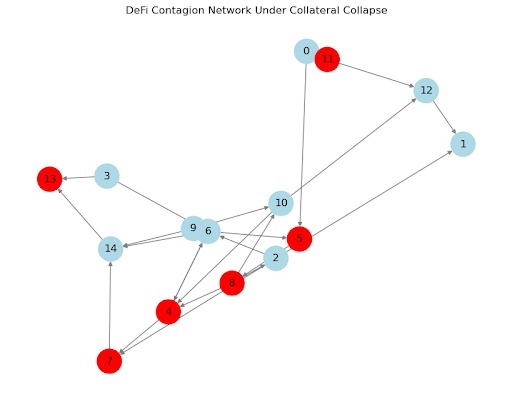
Figure II displays a representative cascade map from a single collateral collapse trial. Nodes are protocols; directed arrows indicate dependencies. Failed protocols are marked in red. The visualization reveals that failures cluster spatially along dependency edges rather than distributing randomly across the network. Several protocols remain stable despite being connected to failed neighbors, indicating that reserve levels and network position jointly determine vulnerability.
In this representative trial, the initial shock was applied to protocols 3, 7, 12, 19, 24, 31, and 44. Protocols 5 and 8 subsequently failed due to dependencies on protocols 3 and 7, respectively, which had been directly shocked. Protocol 2, despite having connections to failed protocols 5 and 8, maintained sufficient reserves to survive the propagated loss—illustrating the threshold effect predicted by Glasserman and Young2.
Discussion
The results confirm the central hypothesis: collateral-linked shocks produce the most severe and variable systemic contagion in the simulated DeFi network. This outcome is consistent with the structure of real DeFi collapses. The Terra/LUNA event in May 2022 began with the de-pegging of the TerraUSD stablecoin, which triggered a spiral of LUNA selling that drained collateral values across protocols holding LUNA as reserves23. The simulation’s collateral collapse scenario captures this structural feature—a simultaneous devaluation across multiple nodes—even without modeling the specific asset price dynamics involved.
Liquidity crises produce intermediate and highly variable contagion. The trial-to-trial variance in the liquidity scenario (std dev 1.94) is notably high relative to the mean (3.82), suggesting that network position of the initially shocked nodes matters considerably. Protocols that serve as central liquidity intermediaries—those with high in-degree in the dependency graph—transmit more contagion when shocked. This is consistent with Lehar and Parlour’s13 finding that AMM liquidity is particularly fragile at high-degree nodes during volatility.
Hack scenarios, as modeled, produced no propagation. As discussed in the results section, this reflects a deliberate modeling choice: hacks were treated as isolated balance-sheet shocks without cross-collateral channels. This choice was made to establish a baseline and was not intended to represent the full complexity of real exploits. The Euler Finance case22 demonstrates that this simplification understates hack propagation. Future iterations should model the cross-protocol collateral exposure that real exploits can activate.
The clustering of failures along dependency edges in Figure II aligns with the network cascade literature. Allen and Gale1 predicted that contagion would follow the structure of interbank obligations; this simulation suggests a parallel dynamic holds in DeFi, where smart contract dependencies replace interbank claims. The finding that some connected protocols survive (e.g., protocol 2 in the representative trial) confirms that reserve levels—not just connectivity—determine failure outcomes, consistent with Glasserman and Young’s threshold model.
These results must be interpreted within the model’s limitations. The random network structure does not reflect empirical DeFi topology; real protocols have heterogeneous degree distributions and cluster around dominant platforms like Aave, Compound, and Uniswap. The static network and absence of behavioral responses mean the model likely underestimates contagion in scenarios involving market panic, and cannot capture the price feedback loops that amplified both the Terra/LUNA collapse and the 2022 DeFi credit crisis. With 50 trials, statistical power is adequate for distributional comparison but insufficient for tail-risk estimation.
Conclusion
Summary of Findings
This study simulated financial contagion in a 50-node directed-graph model of DeFi protocols under three shock types across 50 trials each. Collateral collapse produced the most severe contagion (mean: 6.14 failures, range: 2–13), liquidity crises produced intermediate damage (mean: 3.82, range: 0–9), and hack scenarios remained entirely localized (mean: 1.00 in all trials). Statistical tests confirmed that these differences are significant (Kruskal-Wallis H = 98.4, p < 0.001). Cascade maps showed that failures cluster along dependency edges and that individual protocol survival depends jointly on reserve levels and network position.
Implications
The results suggest that DeFi’s structural vulnerabilities are not uniformly distributed across shock types. Collateral arrangements—the plumbing that enables cross-protocol leverage—represent the primary systemic risk vector. This has practical implications for protocol design: protocols that minimize shared collateral exposure and maintain reserve buffers well above failure thresholds are structurally more resilient. The findings also support the argument that DeFi systemic risk requires dedicated analytical frameworks rather than direct application of traditional finance contagion models, since the absence of regulatory buffers and the instantaneous execution of smart contracts create propagation dynamics without direct precedent.
Limitations
The model’s primary limitations are: the synthetic rather than empirical network structure; the absence of price feedback, behavioral responses, and regulatory intervention; the simplified hack mechanic that underestimates cross-collateral propagation; and the relatively small number of trials (50), which limits tail-risk analysis. Results should be interpreted as structural illustrations, not quantitative predictions of real DeFi outcomes.
Recommendations for Future Research
Future work should incorporate real DeFi transaction data to calibrate network topology empirically; extend the hack scenario to model cross-collateral exposure; increase trial counts and apply bootstrapping for more robust statistical inference; and add price feedback loops to capture the amplification dynamics observed in historical events. Agent-based modeling platforms could provide richer behavioral dynamics than the current deterministic propagation rules.
Closing Thought
The apparent paradox of DeFi is that the composability making it so powerful is inseparable from the composability making it fragile. Decentralization removes the single points of failures that historically triggered bank runs—but replaces them with a network dense enough that sufficiently large shocks find pathways regardless. Understanding where those pathways run, and how wide they are, is not an abstract concern. It is the difference between a localized exploit and a systemic collapse.
References
- F. Allen, D. Gale. Financial contagion. Journal of Political Economy. Vol. 108, pg. 1–33, 2000, https://doi.org/10.1086/262109. [↩] [↩] [↩]
- P. Glasserman, H. P. Young. How likely is contagion in financial networks? Journal of Banking & Finance. Vol. 50, pg. 383–399, 2015, https://doi.org/10.1016/j.jbankfin.2014.02.006. [↩] [↩] [↩]
- G. Gorton. Slapped by the invisible hand: The panic of 2007. Oxford University Press, 2010. [↩] [↩]
- S. Nakamoto. Bitcoin: A peer-to-peer electronic cash system. https://bitcoin.org/bitcoin.pdf, 2008. [↩]
- F. Schär. Decentralized finance: On blockchain- and smart contract-based financial markets. Federal Reserve Bank of St. Louis Review. Vol. 103, pg. 153–174, 2021, https://doi.org/10.20955/r.103.153-174. [↩] [↩]
- Y. Chen, C. Bellavitis. Blockchain disruption and decentralized finance: The rise of decentralized business models. Journal of Business Venturing Insights. Vol. 13, Article e00151, 2020, https://doi.org/10.1016/j.jbvi.2019.e00151. [↩]
- J. R. Jensen, V. von Wachter, O. Ross. An introduction to decentralized finance (DeFi). Complex Systems Informatics and Modeling Quarterly. Vol. 26, pg. 46–54, 2021, https://doi.org/10.7250/csimq.2021-26.03. [↩]
- D. A. Zetzsche, D. W. Arner, R. P. Buckley. Decentralized finance. Journal of Financial Regulation. Vol. 6, pg. 172–203, 2020, https://doi.org/10.1093/jfr/fjaa010. [↩]
- S. M. Werner, D. Perez, L. Gudgeon, A. Klages-Mundt, D. Harz, W. J. Knottenbelt. SoK: Decentralized finance (DeFi). Proceedings of the 4th ACM Conference on Advances in Financial Technologies. pg. 30–46, 2022, https://doi.org/10.1145/3558535.3559780. [↩] [↩]
- L. Gudgeon, D. Perez, D. Harz, B. Livshits, A. Gervais. The decentralized financial crisis: Attacking DeFi. 2020 Crypto Valley Conference on Blockchain Technology (CVCBT). pg. 1–9, 2020, https://doi.org/10.1109/CVCBT50464.2020.00011. [↩] [↩]
- K. Qin, L. Zhou, Y. Afonin, L. Lazzaretti, A. Gervais. CeFi vs. DeFi—Comparing centralized to decentralized finance. arXiv:2106.08157, 2021, https://arxiv.org/abs/2106.08157. [↩] [↩]
- F. Carapella, E. Dumas, J. Gerszten, N. Lambert, N. Swem. Decentralized finance (DeFi): Transformative potential and associated risks. Finance and Economics Discussion Series 2022-057, Federal Reserve Board, 2022, https://doi.org/10.17016/FEDS.2022.057. [↩] [↩]
- A. Lehar, C. A. Parlour. Decentralized exchanges. SSRN Working Paper, 2021, https://doi.org/10.2139/ssrn.3905316. [↩] [↩] [↩]
- DeFi Llama. Total value locked in DeFi. https://defillama.com, 2022. [↩]
- M. E. J. Newman. Networks: An introduction. Oxford University Press, 2010. [↩]
- A.-L. Barabási. Network science. Cambridge University Press, 2016. [↩]
- L. Ante. Smart contract deposits and DeFi leverage: Evidence from compound finance. Finance Research Letters. Vol. 44, Article 102063, 2021, https://doi.org/10.1016/j.frl.2021.102063. [↩]
- G. Liao, J. Caramichael. Stablecoins: Growth potential and impact on banking. International Finance Discussion Papers 1334, Federal Reserve Board, 2022, https://doi.org/10.17016/IFDP.2022.1334. [↩]
- Y. C. Lo, F. Medda. Uniswap and the emergence of the decentralized exchange. Journal of Alternative Investments. Vol. 24, pg. 31–42, 2020, https://doi.org/10.3905/jai.2020.1.120. [↩]
- J. Xu, K. Paruch, S. Cousaert, Y. Feng. SoK: Decentralized exchanges (DEX) with automated market maker (AMM) protocols. ACM Computing Surveys. Vol. 55, pg. 1–50, 2022, https://doi.org/10.1145/3570639. [↩]
- D. Perez, B. Livshits. Smart contract vulnerabilities: Vulnerable does not imply exploited. Proceedings of the 30th USENIX Security Symposium, pg. 1325–1341, 2021. [↩]
- Chainalysis. The Euler Finance hack: How $197M was stolen and returned. Chainalysis Blog, 2023. https://www.chainalysis.com/blog/euler-finance-flash-loan-attack/ [↩] [↩] [↩]
- H. Uhlig. A Luna-tic stablecoin crash. NBER Working Paper 30256, National Bureau of Economic Research, 2022, https://doi.org/10.3386/w30256. [↩] [↩]
- M. Bartoletti, J. H.-Y. Chiang, A. Lluch-Lafuente. A theory of automated market makers in DeFi. Lecture Notes in Computer Science. Vol. 12888, pg. 168–187, 2021, https://doi.org/10.1007/978-3-030-87995-4_9. [↩]
- A. A. Hagberg, D. A. Schult, P. J. Swart. Exploring network structure, dynamics, and function using NetworkX. Proceedings of the 7th Python in Science Conference. pg. 11–15, 2008. [↩]
- D. D. Hunter. Matplotlib: A 2D graphics environment. Computing in Science & Engineering. Vol. 9, pg. 90–95, 2007, https://doi.org/10.1109/MCSE.2007.55. [↩]