Abstract
This study aims to investigate differences in linguistic form across instructional resources, which current literature — especially that focused on language-arts texts — lacks. Former work has not produced side-by-side comparisons of how similar concepts are explained across AI models, video transcripts, and textbooks. This study bridges that gap by measuring linguistic differences across Khan Academy video transcripts, ChatGPT outputs, and textbooks for four high school math topics. This study does not measure instructional quality, accuracy, or learning outcomes — it only measures the linguistic aspects of the learning methods. Written explanations for four math concepts (angles, area, fractions, and the Pythagorean Theorem) were collected from six sources: a Khan Academy video transcript, three ChatGPT responses (standard, easy, and hard prompts), and two textbooks (one standard and one Indian). Each text was analyzed using Flesch–Kincaid Grade Level and T.E.R.A. (Text Ease and Readability Assessor) to quantify measurements based on narrativity, syntactic simplicity, word concreteness, referential cohesion, and deep cohesion. Pearson correlations were conducted with 95% confidence intervals using the Fisher z-transformation, and hierarchical clustering of source-mean profiles was added as a small-N statistical complement. Khan Academy showed the highest narrativity (mean = 87.5) and high syntactic simplicity (mean = 78.0); textbooks showed the highest word concreteness (mean = 81.5 standard, 55.0 Indian); ChatGPT variants showed the lowest syntactic simplicity (8.75–19.25). Length correlated strongly with narrativity (r = 0.77, 95% CI [0.54, 0.90]) and inversely with word concreteness (r = −0.66, 95% CI [−0.84, −0.35]), indicating that length is a substantial confound. Hierarchical clustering was used to group the standard and Indian textbooks together, the standard and easy ChatGPT prompts together, and placed Khan Academy as a single-source outlier. Findings are limited by the small corpus (N = 24), the absence of human comprehension or expert correctness checks, and known limitations of automated text metrics on prose containing mathematical symbols. Results should be read as an exploratory description of textual form, not as a ranking of instructional quality.
Keywords: readability, text cohesion, Flesch–Kincaid, Coh-Metrix, T.E.R.A., Khan Academy, ChatGPT, mathematics education
Introduction
In the 21st century, there are more tools than ever before to assist in learning. Whether it be platforms like Khan Academy, artificial intelligence models like ChatGPT, or a more traditional approach using a textbook, each one offers a different angle on a new concept. Each method has the same goal — to enhance comprehension and accessibility — but they go about that end with different means; some are more complex and niche, while others might be simpler. Understanding the similarities and differences between these resource types can help us characterize what kind of language support each one offers, which is a precondition for deciding when each is most useful.1,2,3
This study focuses on the more technical aspects of these resources. Taking videos from Khan Academy4, giving different difficulty-level prompts to ChatGPT5, and textbook excerpts from different regions of the world, we apply tests like the Flesch–Kincaid readability test to gather insights about each text.6,7. These help characterize the complexity of the prose, the sentence structure, and the vocabulary burden, and they let us measure how close content from different platforms is to one another at the textual surface.
We additionally incorporate discourse-based measures using Coh-Metrix and the T.E.R.A. (Text Ease and Readability Assessor)8,9,10, which analyze deeper features of text — including cohesion — and provide a five-factor profile: Narrativity, Syntactic Simplicity, Word Concreteness, Referential Cohesion, and Deep Cohesion. This study aims to fill a measurement gap: prior comparative work has not produced quantitative side-by-side profiles of linguistic difficulty and conceptual coherence across textbooks, AI chat, and video tutors holding the underlying math concept constant. The framing throughout is descriptive: we only work to measure and analyze differences and discrepancies; we do not measure learning outcomes, instructional quality, or mathematical correctness, and we make no claim about which resource is best for any learner. Our framing draws on cohesion theory11,12 and the construction-integration model of reading comprehension13, which together motivate the T.E.R.A. components as observable measures of surface and deeper text features. Three research questions guide the analysis: how does the linguistic profile vary across the six sources within each concept (RQ1); do source-level patterns persist across all four concepts (RQ2); and how much does text length confound those patterns (RQ3)?
Methods
To compare how different learning resources explain the same math ideas, we collected written explanations for 4 math concepts (Angles, Area, Fractions, and the Pythagorean Theorem). For each concept, we gathered 6 text sources: a Khan Academy explanation (from a video transcript), three ChatGPT responses (a standard prompt, an “easy” prompt, and a “hard” prompt), and two textbooks (one standard textbook and one textbook from India). This resulted in 24 total texts (4 concepts × 6 sources). For each text, we recorded the word count (Length) and then ran readability and discourse analyses. The design is best read as a case-study comparison between concepts rather than a representative sample of the math curriculum: the four concepts were chosen to cover a wide variety of arithmetic content (Fractions, Area) and geometric content (Angles, the Pythagorean Theorem) that is typical of middle to early-high-school mathematics curriculum, and the six sources were chosen to have variety over print (textbooks), spoken video (Khan Academy), and AI chat (ChatGPT). N = 24 limits statistical inference to within-corpus association, and we report 95% confidence intervals on every reported coefficient using the Fisher z-transformation.
All text was saved as plain text. For transcripts, we used the spoken explanation content (and removed timestamps if present). The goal was not to judge whether an explanation is “correct,” but to measure how the language differs across sources in ways that relate to reading difficulty and coherence.
Reproducibility supplement. The following items are provided so that another researcher could regenerate the 24 texts and test whether the reported profiles are stable.
| Concept | Khan Academy (video transcript) | Illustrative Mathematics (Access IM) | NCERT Class 7 textbook |
| Angles | https://www.khanacademy.org/math/cc-seventh-grade-math/cc-7th-geometry/cc-7th-angles/v/angle-basics (retrieved December 12, 2025) | https://accessim.org/6-8/grade-7/unit-7?a=teacher — Grade 7, Unit 7 “Angles, Triangles, and Prisms,” Section A “Angle Relationships” (retrieved December 12, 2025) | Chapter 5 “Lines and Angles,” pp. 93–112 |
| Area | https://www.khanacademy.org/math/cc-sixth-grade-math/x0267d782:cc-6th-plane-figures/cc-6th-area/v/area-breaking-up-shape (retrieved December 12, 2025) | https://accessim.org/k-5/grade-3/unit-2?a=teacher — Grade 3, Unit 2 “Area and Multiplication” (retrieved December 12, 2025) | Chapter 11 “Perimeter and Area,” pp. 205–228 |
| Fractions | https://www.khanacademy.org/math/cc-third-grade-math/imp-fractions/imp-fractions-intro/v/fraction-basics (retrieved December 11, 2025) | https://accessim.org/k-5/grade-3/unit-5?a=teacher — Grade 3, Unit 5 “Fractions as Numbers” (retrieved December 11, 2025) | Chapter 2 “Fractions and Decimals,” sections 2.1–2.4, pp. 29–46 |
| Pythagorean Theorem | https://www.khanacademy.org/math/cc-eighth-grade-math/cc-8th-geometry/cc-8th-pythagorean-theorem/v/the-pythagorean-theorem (retrieved October 17, 2025) | https://accessim.org/6-8-accelerated/accelerated-7/unit-8/section-b/lesson-6/preparation?a=teacher — Accelerated Grade 7, Unit 8, Section B, Lesson 6 “Finding Side Lengths of Triangles” (retrieved October 17, 2025) | Chapter 6 “The Triangle and Its Properties,” section 6.8 “Right-Angled Triangles and Pythagoras Property,” pp. 127–131 |
For ChatGPT, we used GPT-5 (free tier), accessed in November and December 2025. We used three prompts for each concept, based on these templates: a standard prompt (“Explain [concept]”), an easy prompt (“Explain [concept] in a simple manner”), and a hard prompt (“Explain [concept] in an in-depth manner to an advanced student”). Concept-specific phrasing varied slightly within these templates; exact wordings are available on request.
To prepare each text for analysis, we processed all of them the same way. First we removed timestamps from the video transcripts. Then we replaced equations and equation-only lines with a single space, and removed mathematical symbols and operators along with any leftover numeric tokens that got stranded. We also removed bullet markers and list markers but kept the underlying sentence text. Finally we collapsed extra whitespace into a single space and kept sentence punctuation. Length was measured as word count after all of this was done. The raw and cleaned text for all 24 passages and the source metadata listed above are included in the supplementary corpus, available on request.
To measure basic readability, we used the Flesch-Kincaid Grade Level score, which estimates the U.S. school grade level needed to read a text. In general, higher FK grade levels mean the text is harder to read (longer sentences and/or more complex words), while lower FK grade levels mean the text is easier.
The Flesch–Kincaid Grade Level is based mainly on average sentence length (words per sentence) and average word complexity, often approximated by syllables per word.6,7
Flesch–Kincaid is not perfect, especially for math text — formulas and symbols do not behave like normal words — but it is still useful as a baseline because it is widely used and easy to compare across sources. Three known limitations are particularly relevant to mathematical prose. First, the formula was derived on language-arts texts and has been criticized for producing inconsistent estimates on technical and STEM material14,15. Second, after our preprocessing pipeline strips equations and symbolic notation, the resulting Flesch–Kincaid score reflects only the surrounding prose, not the full multimodal artifact a learner would actually read. Third, the formula does not capture cohesion or discourse-level features at all, which is why we complement it with the discourse-sensitive indices below.
Readability formulas like FK mainly focus on sentence length and word difficulty. However, texts can also be hard to understand because of deeper features like how well ideas are connected across sentences. To capture these “deeper” features, we used Coh-Metrix, a tool designed to analyze discourse and cohesion in text8.
Coh-Metrix provides many indices related to text structure, cohesion, and meaning, and it has been used in educational research to study how difficult or “easy” a text is to follow8. Since the full Coh-Metrix desktop tool requires special access, we used T.E.R.A. (Text Ease and Readability Assessor), which is a web tool built on Coh-Metrix that produces a simple profile of a text10.
T.E.R.A. returns five components, each reported on a 0–100 scale (higher = more of that property): Narrativity (how story-like or conversational a text is — higher narrativity usually makes a text feel easier to read because it flows more like natural language); Syntactic Simplicity (the inverse of clausal complexity — lower syntactic simplicity means the sentences are harder to parse); Word Concreteness (how concrete versus abstract the vocabulary is — concrete words tend to be easier to visualize and process); Referential Cohesion (how much overlap there is between words and stems across sentences, which helps readers connect what they just read to what comes next); and Deep Cohesion (how clearly the text signals relationships between ideas — cause/effect, logical connections, sequencing — where higher deep cohesion can help readers follow the reasoning).16
T.E.R.A. inherits known limitations of automated discourse analysis on technical prose: the Coh-Metrix indices are calibrated against language-arts text that are more traditionally written, and may behave inconsistently when prose is heavily punctuated by equations, symbols, or worked-example notation, even after preprocessing16,14, which is the case with our math-heavy texts. T.E.R.A. also does not measure mathematical correctness, the appropriateness of an explanation for a given learner, or the visual cues and help that accompanies the prose in its form. We still used T.E.R.A. as the main tool for analyzing text cohesion and readability because it is the most accessible form of Coh-Metrix in publicly available form, and we treat all interpretations as descriptive of the textual surface only.
For each of the 24 texts, we submitted the text to T.E.R.A. and recorded the five component scores along with the FK grade level.
After extracting the FK and T.E.R.A. metrics, we wanted to check whether certain patterns were related—for example, whether longer texts tend to score higher on narrativity or deep cohesion. To do this, we computed the Pearson correlation coefficient (r) across the dataset17.
Pearson’s r measures how strong and in what direction two variables are related in a linear manner; r = 1 indicates a perfect positive linear relationship, r = −1 indicates a perfect negative linear relationship, and r = 0 indicates no linear relationship.
We computed Pearson correlations between Length, Flesch–Kincaid grade, and each of the five T.E.R.A. factors. Because the dataset is relatively small (N = 24 texts), these correlations are best interpreted as descriptive patterns rather than definitive conclusions, and we report the 95% confidence interval on every coefficient using the Fisher z-transformation17,18: the coefficient r is converted to z = arctanh(r) with standard error SE_z = 1 / √(N − 3) ≈ 0.218 for N = 24, the interval z ± 1.96·SE_z is computed, and the bounds are converted back via tanh. Two-sided p-values are reported alongside each coefficient (effect-size interpretation follows the conventions in Cohen 198819.
Finally, we used Principal Component Analysis (PCA) as a way to visualize overall similarity between texts using the five T.E.R.A. components together. Each text can be represented as a 5-dimensional vector: (Narrativity, Syntactic Simplicity, Word Concreteness, Referential Cohesion, Deep Cohesion)
PCA reduces these five dimensions into two new axes (called PC1 and PC2) that capture as much variation in the data as possible20. The percentages shown on the PCA axes represent the proportion of variance explained by that principal component (for example, PC1 might explain about half of the overall variation in the five-factor profiles). We used PCA mainly as an exploratory visualization to see whether texts cluster by source type (Khan vs. GPT vs. textbooks) or by concept.
Before running PCA, we z-scored the five factors so that each factor contributed comparably (since all are 0–100 but can still have different spreads). PCA does not prove that one method is better for learning; instead, it helps show whether different sources have similar or distinct linguistic “profiles” based on the Coh-Metrix/T.E.R.A. measures. With N = 24, principal-component loadings can be unstable to single-text removal20,21, so we treat the PCA strictly as a visualization aid and complement it with hierarchical clustering on the source-mean profiles (described below).
To test whether sources separate into distinct profile clusters — the formal version of the source-signature claim — we performed agglomerative hierarchical clustering (UPGMA / average linkage, Euclidean distance) on the 6×5 matrix of z-scored source-mean profiles, reporting the linkage matrix and a dendrogram. Clustering on the source-mean profiles (n = 6 means) rather than on all 24 individual texts (with only four texts per source category) was chosen because cluster-stability indices are known to behave poorly when individual cluster cardinalities fall below recommended thresholds22.
Results
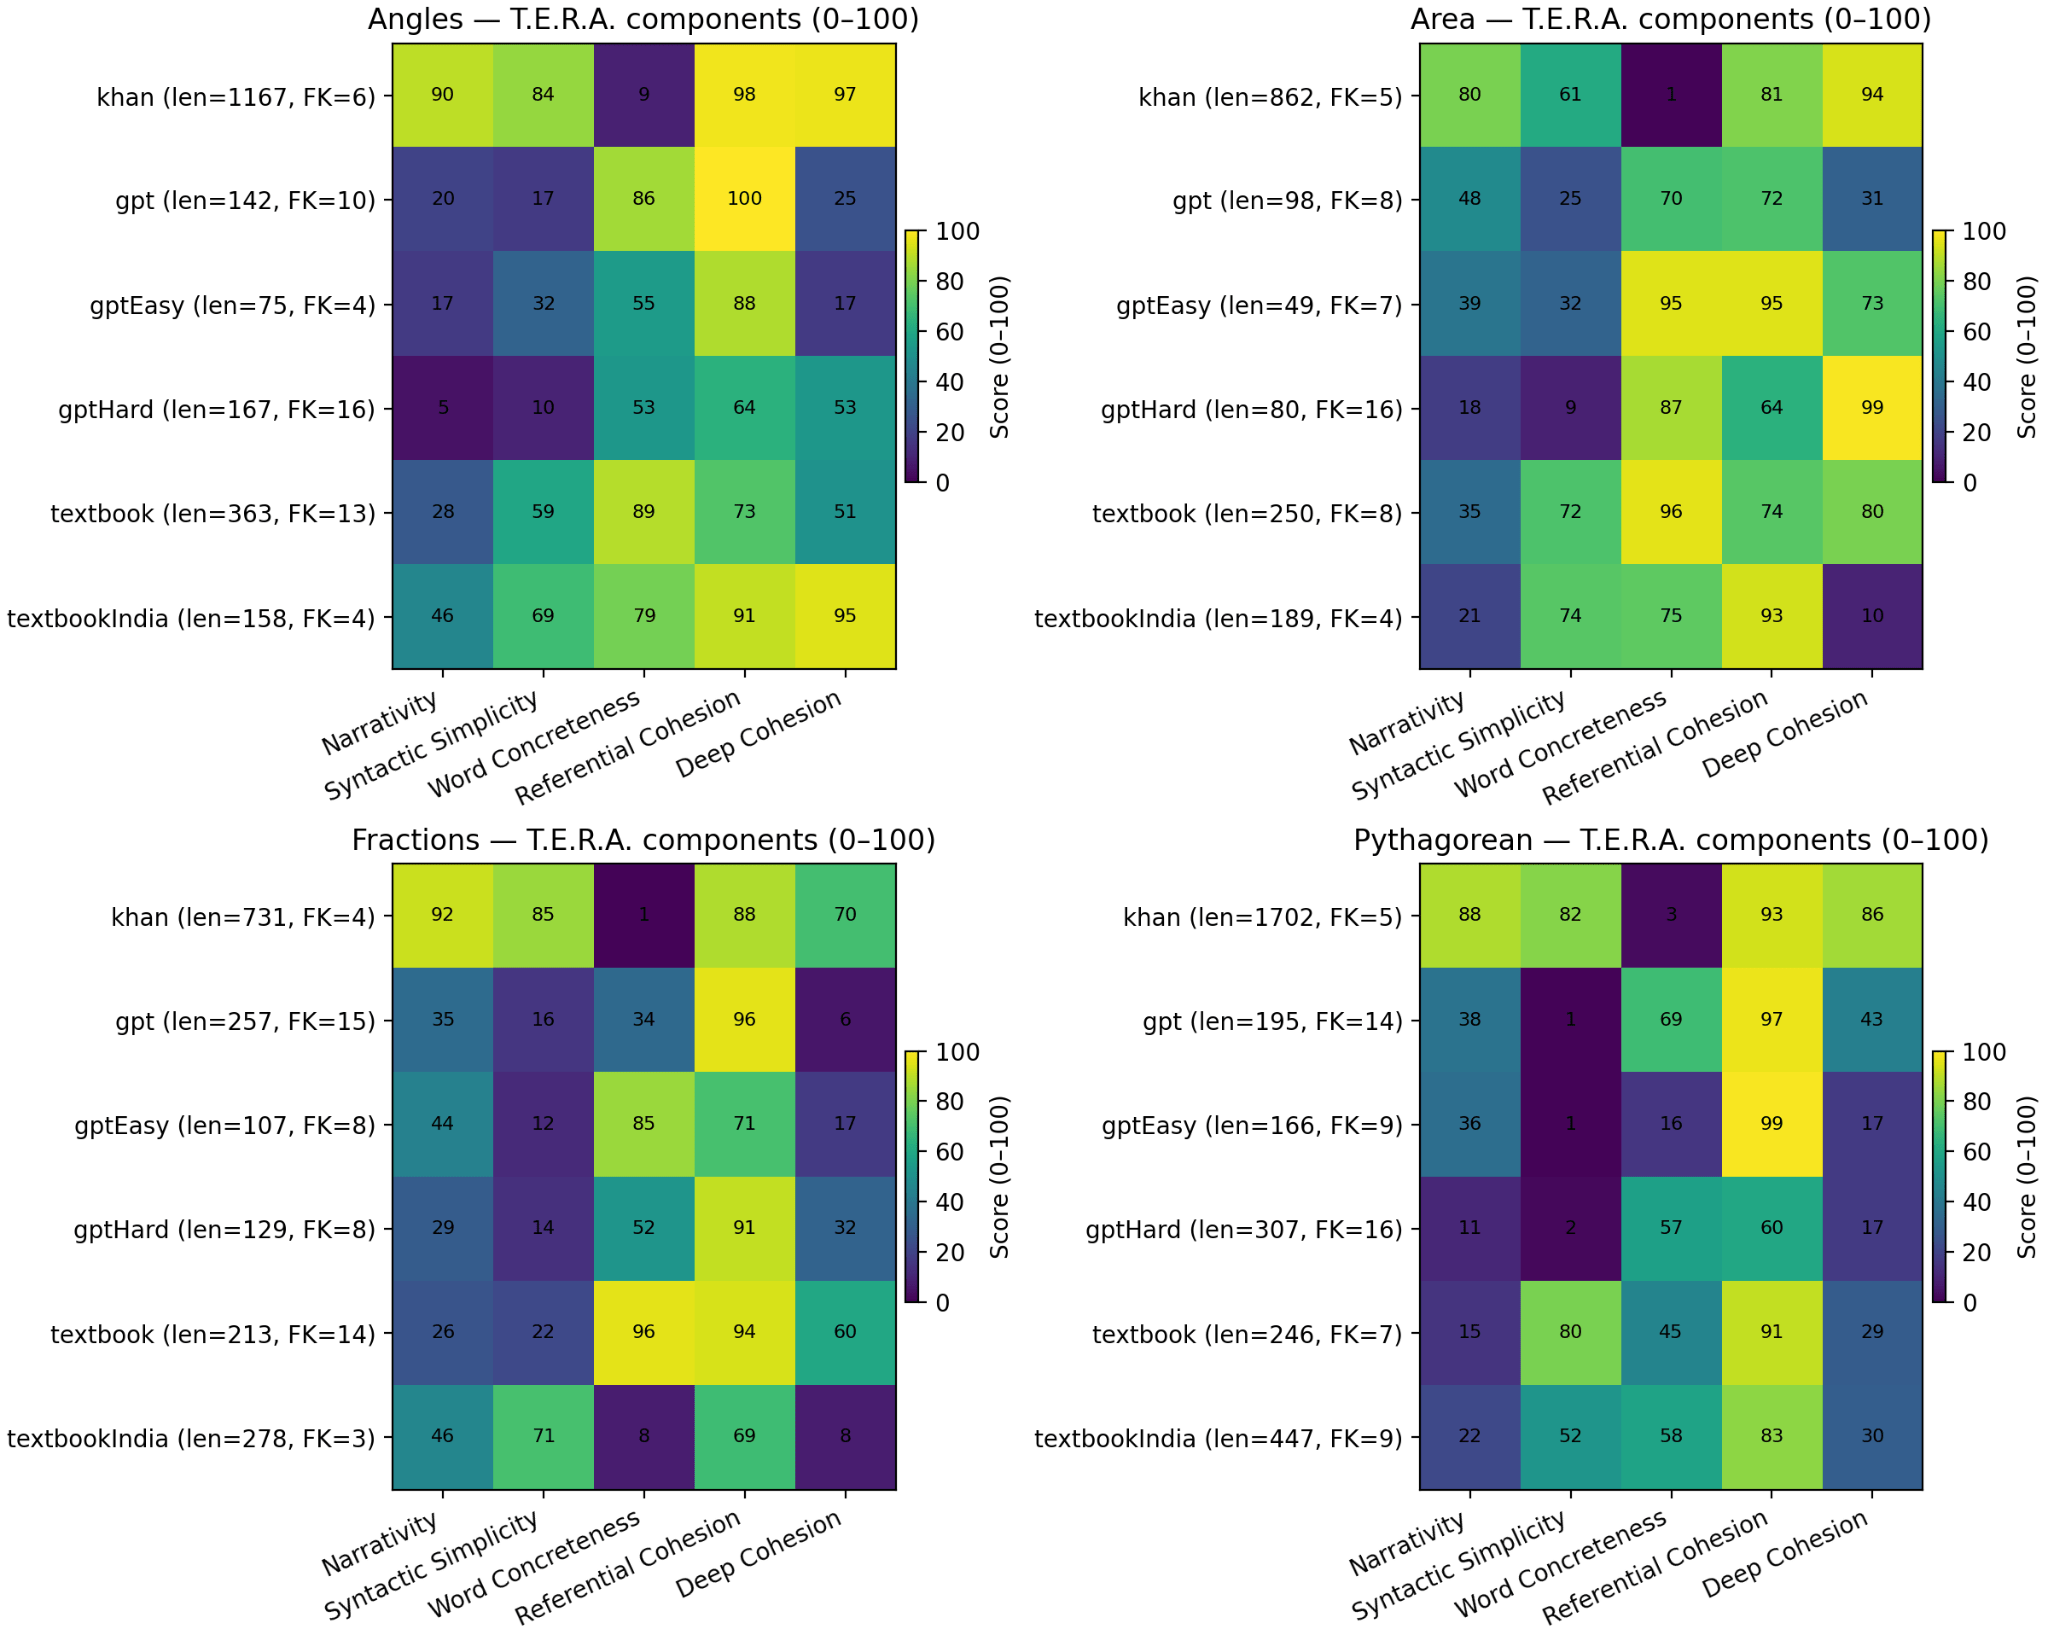
Across the four concepts (Angles, Area, Fractions, and the Pythagorean Theorem), each source produces a distinct T.E.R.A. profile across the five components: Narrativity, Syntactic Simplicity, Word Concreteness, Referential Cohesion, and Deep Cohesion. To show these differences clearly, Figure 1 presents one heatmap per concept. Each heatmap compares the six sources side-by-side and includes both length (word count) and FK grade in the row labels to provide context for differences in readability and structure.
Detailed concept discussion: Pythagorean Theorem
For the Pythagorean Theorem, as seen in Figure 1, length and Flesch–Kincaid grade do not align consistently within this single concept. The most notable discrepancy comes from Khan Academy: while it has the lowest grade level (FK = 5), its length is substantially higher than the other inputs (1,702 words). For Flesch–Kincaid grade, the standard ChatGPT and “hard” ChatGPT prompts are the highest grade-level responses (FK = 14 and FK = 16), while the standard textbook and Khan Academy are the lowest (FK = 7 and FK = 5), with the easy ChatGPT prompt and the Indian textbook in the middle (FK = 9 each).
For deep cohesion, longer texts are associated with higher deep cohesion in some cases. For example, Khan Academy is both the longest and has high Deep Cohesion (86), while shorter ChatGPT variants are much lower (e.g., GPT-Easy 17). This is reported as an association within the corpus rather than a causal claim.
For referential cohesion within the Pythagorean Theorem cell, longer texts tend to show lower referential cohesion, with Khan Academy and the “hard” ChatGPT prompt as outliers. The “hard” ChatGPT prompt has comparatively low referential cohesion (60), while Khan Academy’s referential cohesion is high (93) but its length sets it far apart from the others. We report these patterns as observations within this single concept and do not infer a mechanism.
For word concreteness, the within-concept pattern is varied. The standard ChatGPT prompt has high concreteness (69), the easy ChatGPT prompt is much lower (16), and Khan Academy is the lowest (3). We report these as observations and offer no within-concept causal claim.
For text length versus syntactic simplicity, the results within the Pythagorean Theorem cell do not show a clear single trend, but a few groupings appear. All ChatGPT prompts have very low syntactic simplicity (1–2). Within the ChatGPT cells, longer prompts have slightly higher syntactic simplicity (e.g., GPT-Hard at length 307 has 2 vs. GPT at length 195 has 1). The textbooks and especially Khan Academy have the highest syntactic simplicity (Textbook 80, Khan 82). We make no causal claim about why; the cross-corpus correlation between length and syntactic simplicity is reported in the Length and FK as confounds subsection.
For narrativity, longer texts are associated with higher narrativity within this concept, with Khan Academy as the most narrative source (88). The cross-corpus correlations reported in the Length and FK as confounds subsection support similar associations between narrativity and length, deep cohesion and length, and narrativity and deep cohesion at the level of the full 24-text corpus, with full 95% confidence intervals. We do not interpret these as causal.
Detailed concept discussion: Fractions
When looking at the correlation between length and factors with fractions, the first thing we look to is the grade level. Again, there seems to be no significant correlation, because the length is just one of the many factors that determine grade level.
For deep cohesion, the trend in Fractions is generally upward: increases in length are associated with higher deep cohesion, consistent with the within-concept pattern observed for the Pythagorean Theorem.
With referential cohesion, there seems to be no significant correlation overall – there is a trend that encompasses a few of the methods, where higher length equates to higher referential cohesion. This is the opposite of the pythagorean theorem, where a higher word count results in a lower referential cohesion. This could however, just be due to chance because when looking at the bigger picture, there seems to be no overall trend because of multiple outliers such as the easy GPT prompt, the foreign textbook, and even the Khan academy video.
With regards to word concreteness, the relationship is very similar to the pythagorean theorem’s results in this category – no relationship between the two, with varying levels of word concreteness. Just like the pythagorean theorem, khan academy has the lowest word concreteness. However, unlike the pythagorean theorem results, the easy GPT prompt is the highest out of all of the GPT prompts in word concreteness, followed by the hard GPT prompt, finally followed by the normal one. With the pythagorean theorem, the results were in the order of GPT regular, GPT hard, and GPT easy, a stark reversal. We note this as a within-source variation across concepts and do not interpret it further.
For syntactic simplicity, Fractions shows a clearer correlation than the Pythagorean Theorem cell: an increase in text length generally corresponds to an increase in syntactic simplicity, with the only outlier being the standard ChatGPT prompt. As in the Pythagorean Theorem cell, most values cluster in the lower-left of the length-vs-syntactic-simplicity scatter.
When discussing narrativity, the graph is almost identical to that of the pythagorean theorem, with the same conclusions of a higher word correlating with a higher narrativity
Detailed concept discussion: Area
When looking at the correlation between length and factors with area, the first thing we look at is grade level, where there again seems to be no significant correlation, with all the values spread out.
When discussing deep cohesion, the trend seems a little different. Similar results showing higher lengths relating to higher deep cohesion, with the exception of a few outliers, including the standard GPT prompt and the foreign textbook. We note this overlap with the Fractions cell as an observation without further interpretation.
When looking at referential cohesion, there seems to really be no significant trend occurring with area, unlike the Pythagorean Theorem and fractions results that seem to encompass opposing results. Here, all the values are spread out, with relatively higher lengths having higher and lower referential cohesion both, depending on the method of studying.
For word concreteness, the Area cell does not show a significant pattern — a divergence from the Pythagorean Theorem and Fractions cells. We report this difference and do not speculate on its cause.
With syntactic simplicity, other than the graph seeming to be a bit steeper, the general trend does follow along consistently with the Pythagorean Theorem and fractions results, indicating higher text length correlating with higher syntactic simplicity.
The exact same logic can be applied to narrativity, where a trend of a higher word count equating to higher narrativity on average can be seen, similar to the results of the previous contents studied.
Detailed concept discussion: Angles
With regards to angles, the first trend regarding text length vs grade level seems to be similar, yet has a few differences when compared to the same results for the pythagorean theorem, fractions, and area. Here, while the general trend does appear, there seem to be a few outliers of the hard GPT prompt along with Khan academy, in addition to a cluster regarding low text length and a low projected grade level.
For deep cohesion, Angles shows a relatively clear within-concept association of higher text length with higher deep cohesion, consistent with the within-concept patterns observed in the Pythagorean Theorem and Fractions cells. The small departures observed in the Area cell are noted but do not change the overall direction observed across the four concepts.
For referential cohesion, Angles shows no clear within-concept pattern — values are spread across the range. This is consistent with the within-concept patterns for both Area and Fractions, and we therefore do not interpret the apparent within-concept association seen in the Pythagorean Theorem cell as a corpus-level finding.
When discussing word concreteness, there seems to be a small pattern of higher length relating to higher word concreteness, with a huge outlier that is Khan academy, yet it is not a very strong pattern, and combined with the lack of pattern from the results of area, and the opposing patterns that came with the Pythagorean Theorem and fractions, we make no corpus-level claim about length and word concreteness from these within-concept patterns.
When discussing syntactic simplicity, there seems to be a general relationship of higher text length correlating with higher syntactic simplicity, consistent with all the previous findings.
With regards to narrativity, there again seems to be a relationship of higher text length relating to higher narrativity, similar to all previous findings.
Aggregated patterns across all concepts
While Figure 1 shows how each platform behaves within each individual concept, Figure 2 summarizes the overall patterns by averaging each source’s T.E.R.A. scores across all four concepts and reports the mean ± standard deviation. This makes it easier to see which features are relatively stable across topics and which ones fluctuate.
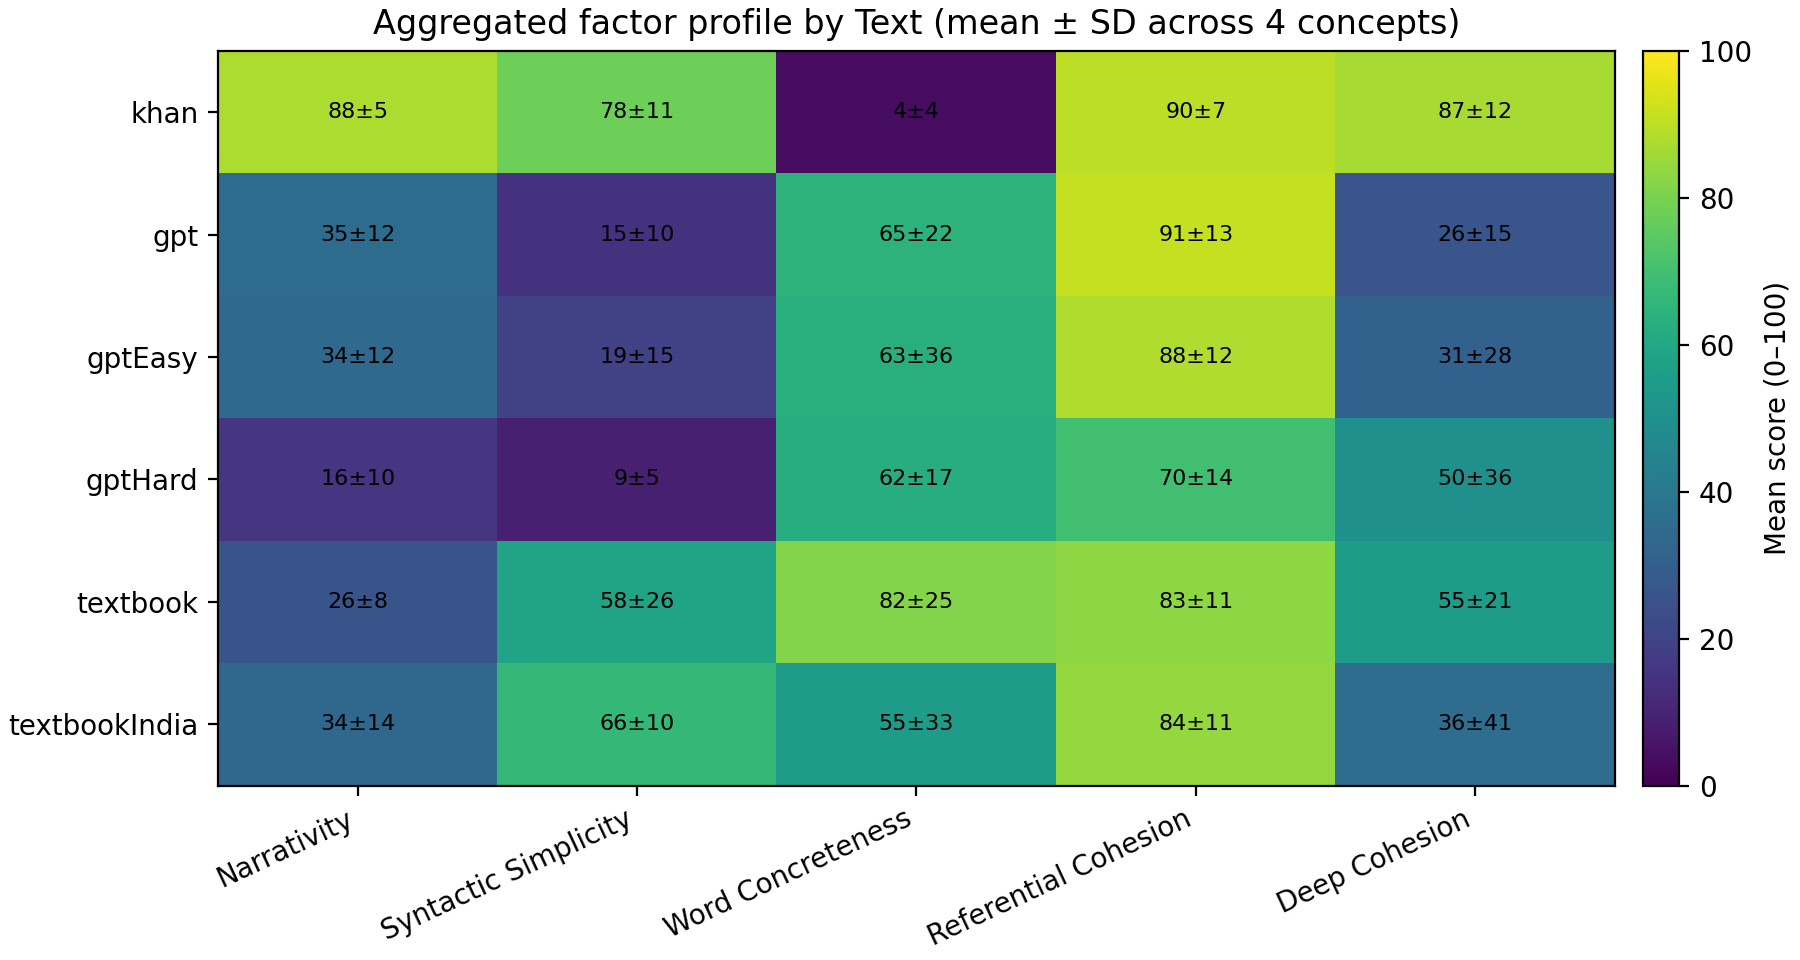
In the aggregated view, Khan Academy shows a consistently high Narrativity and Syntactic Simplicity profile (mean Narrativity = 87.5 ± 5.3; mean Syntactic Simplicity = 78.0 ± 11.4), while textbooks tend to show higher Word Concreteness (standard textbook mean = 81.5 ± 24.6; Indian textbook mean = 55.0 ± 32.6). The ChatGPT variants tend to maintain relatively high Referential Cohesion (mean = 91.3 ± 12.9 for the standard prompt) but have low Syntactic Simplicity (means in the range 8.75–19.25 across the three prompts). Deep Cohesion shows higher variability across concepts for some sources (e.g., Indian textbook SD = 40.7), which is consistent with topic-level variability beyond the source-mean signature. We caution that means computed across only four concept instances are sensitive to a single concept’s profile.
Length and FK as confounds
Because the sources vary widely in length (for example, transcripts can be much longer than textbook paragraphs), we computed Pearson correlations across the full dataset (N=24) to check whether length is associated with the T.E.R.A. components and FK grade. These correlations help interpret whether patterns seen in Figure 1 and Figure 2 may partly reflect text length rather than platform alone.
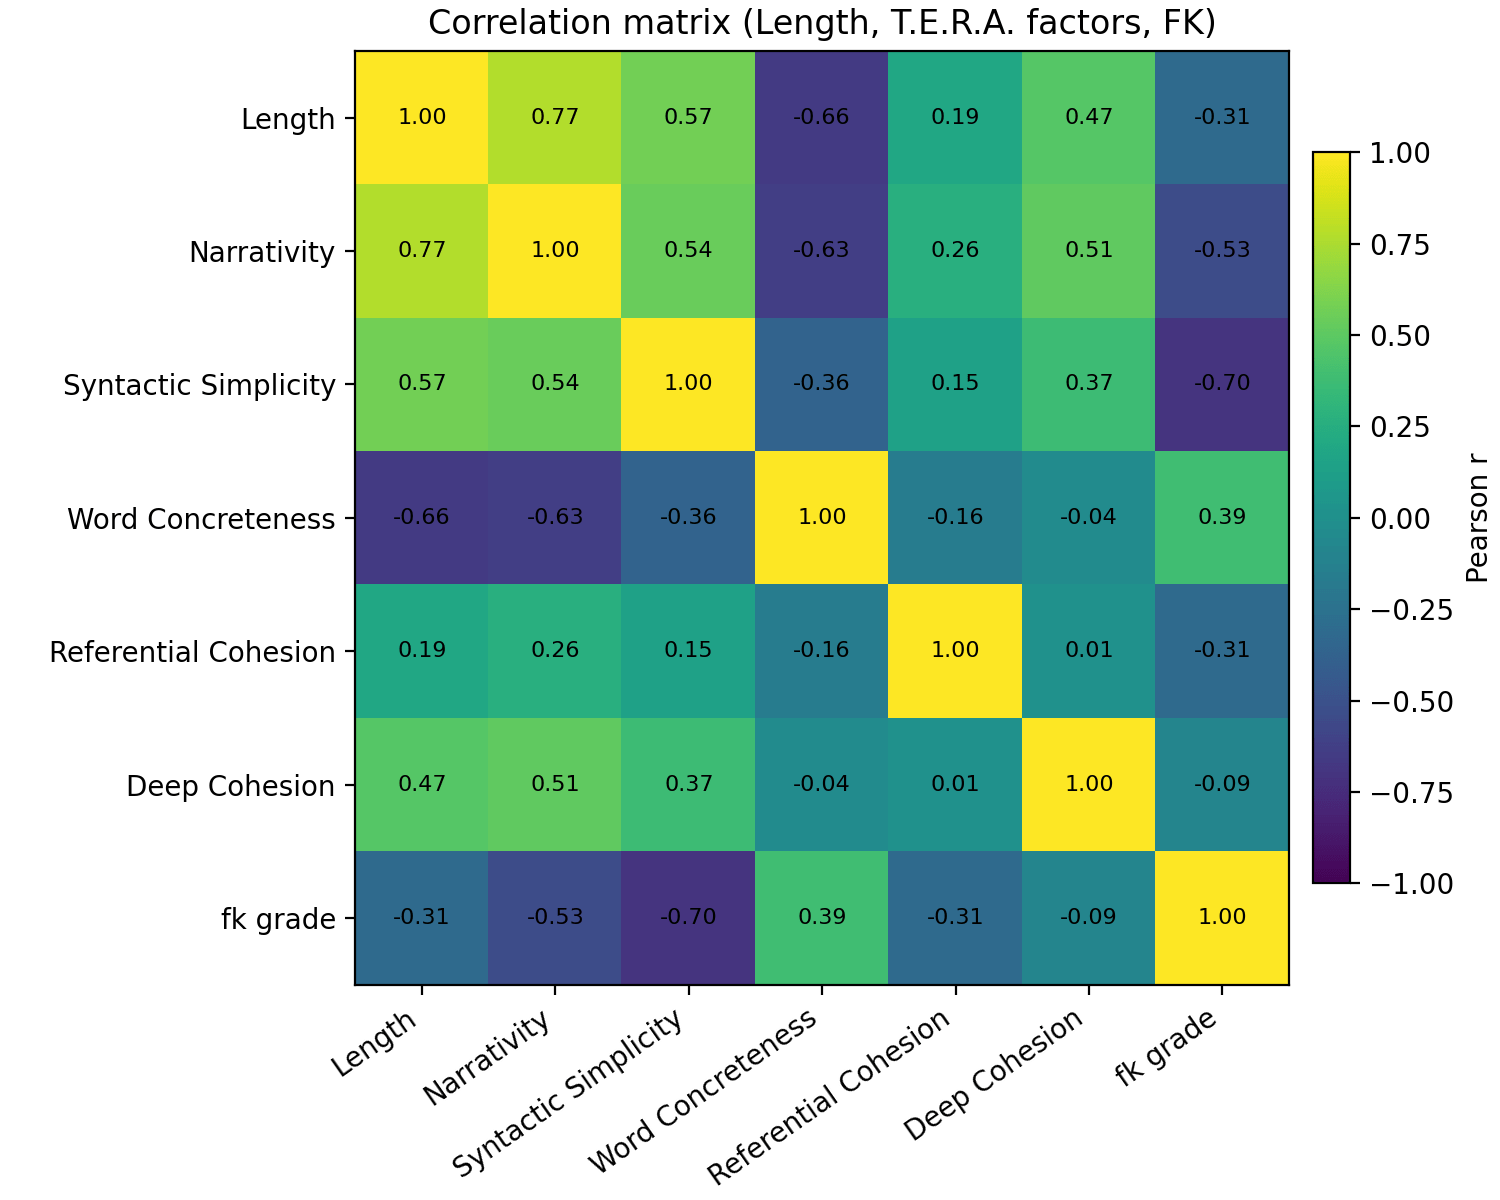
Several variables show moderate-to-strong cross-corpus associations. Length and Narrativity are strongly positively associated (r = 0.77, 95% CI [0.54, 0.90], p < .0001). Length and Word Concreteness are strongly negatively associated (r = −0.66, 95% CI [−0.84, −0.35], p = .0004). Length and Syntactic Simplicity are positively associated (r = 0.58, 95% CI [0.22, 0.79], p = .003), and Length and Deep Cohesion are positively associated (r = 0.47, 95% CI [0.09, 0.74], p = .020). Flesch–Kincaid and Syntactic Simplicity are strongly negatively associated (r = −0.70, 95% CI [−0.86, −0.41], p = .0001), as are Flesch–Kincaid and Narrativity (r = −0.53, 95% CI [−0.77, −0.17], p = .007). Among the T.E.R.A. components themselves, Narrativity and Word Concreteness are negatively associated (r = −0.63, 95% CI [−0.83, −0.31], p = .0009), and Narrativity is positively associated with both Syntactic Simplicity (r = 0.54, 95% CI [0.18, 0.78], p = .006) and Deep Cohesion (r = 0.51, 95% CI [0.14, 0.76], p = .011). All remaining pairwise correlations cross zero within their 95% confidence intervals and are not interpreted further. These patterns are reported as associations within this corpus and do not support causal inference. Because length is associated with multiple T.E.R.A. components in this corpus, source-level differences observed in Figure 2 should be interpreted with text length in mind, and we do not separate length from source effects in this small-N design. Full pairwise statistics are reported in Table 1.
| Variable 1 | Variable 2 | r | 95% CI | p |
| Length | Flesch–Kincaid | −0.310 | [−0.634, 0.107] | .141 |
| Length | Narrativity | 0.772 | [0.535, 0.896] | < .0001 |
| Length | Syntactic Simplicity | 0.575 | [0.223, 0.794] | .003 |
| Length | Word Concreteness | −0.660 | [−0.840, −0.350] | .0004 |
| Length | Referential Cohesion | 0.188 | [−0.233, 0.550] | .378 |
| Length | Deep Cohesion | 0.472 | [0.085, 0.735] | .020 |
| Flesch–Kincaid | Narrativity | −0.533 | [−0.771, −0.165] | .007 |
| Flesch–Kincaid | Syntactic Simplicity | −0.699 | [−0.860, −0.412] | .0001 |
| Flesch–Kincaid | Word Concreteness | 0.387 | [−0.019, 0.684] | .062 |
| Flesch–Kincaid | Referential Cohesion | −0.308 | [−0.633, 0.109] | .143 |
| Flesch–Kincaid | Deep Cohesion | −0.086 | [−0.473, 0.328] | .688 |
| Narrativity | Syntactic Simplicity | 0.543 | [0.179, 0.777] | .006 |
| Narrativity | Word Concreteness | −0.631 | [−0.825, −0.306] | .0009 |
| Narrativity | Referential Cohesion | 0.265 | [−0.155, 0.604] | .211 |
| Narrativity | Deep Cohesion | 0.511 | [0.136, 0.758] | .011 |
| Syntactic Simplicity | Word Concreteness | −0.363 | [−0.669, 0.047] | .081 |
| Syntactic Simplicity | Referential Cohesion | 0.148 | [−0.271, 0.521] | .489 |
| Syntactic Simplicity | Deep Cohesion | 0.371 | [−0.038, 0.674] | .074 |
| Word Concreteness | Referential Cohesion | −0.157 | [−0.527, 0.263] | .464 |
| Word Concreteness | Deep Cohesion | −0.036 | [−0.433, 0.373] | .867 |
| Referential Cohesion | Deep Cohesion | 0.010 | [−0.395, 0.411] | .965 |
Exploratory PCA visualization
As an exploratory visualization, we applied PCA to the five T.E.R.A. components (z-scored) to reduce each text’s 5-number profile to two axes (PC1 and PC2). The PCA biplot is mainly included as a visual summary showing which sources have similar overall profiles and which ones differ.
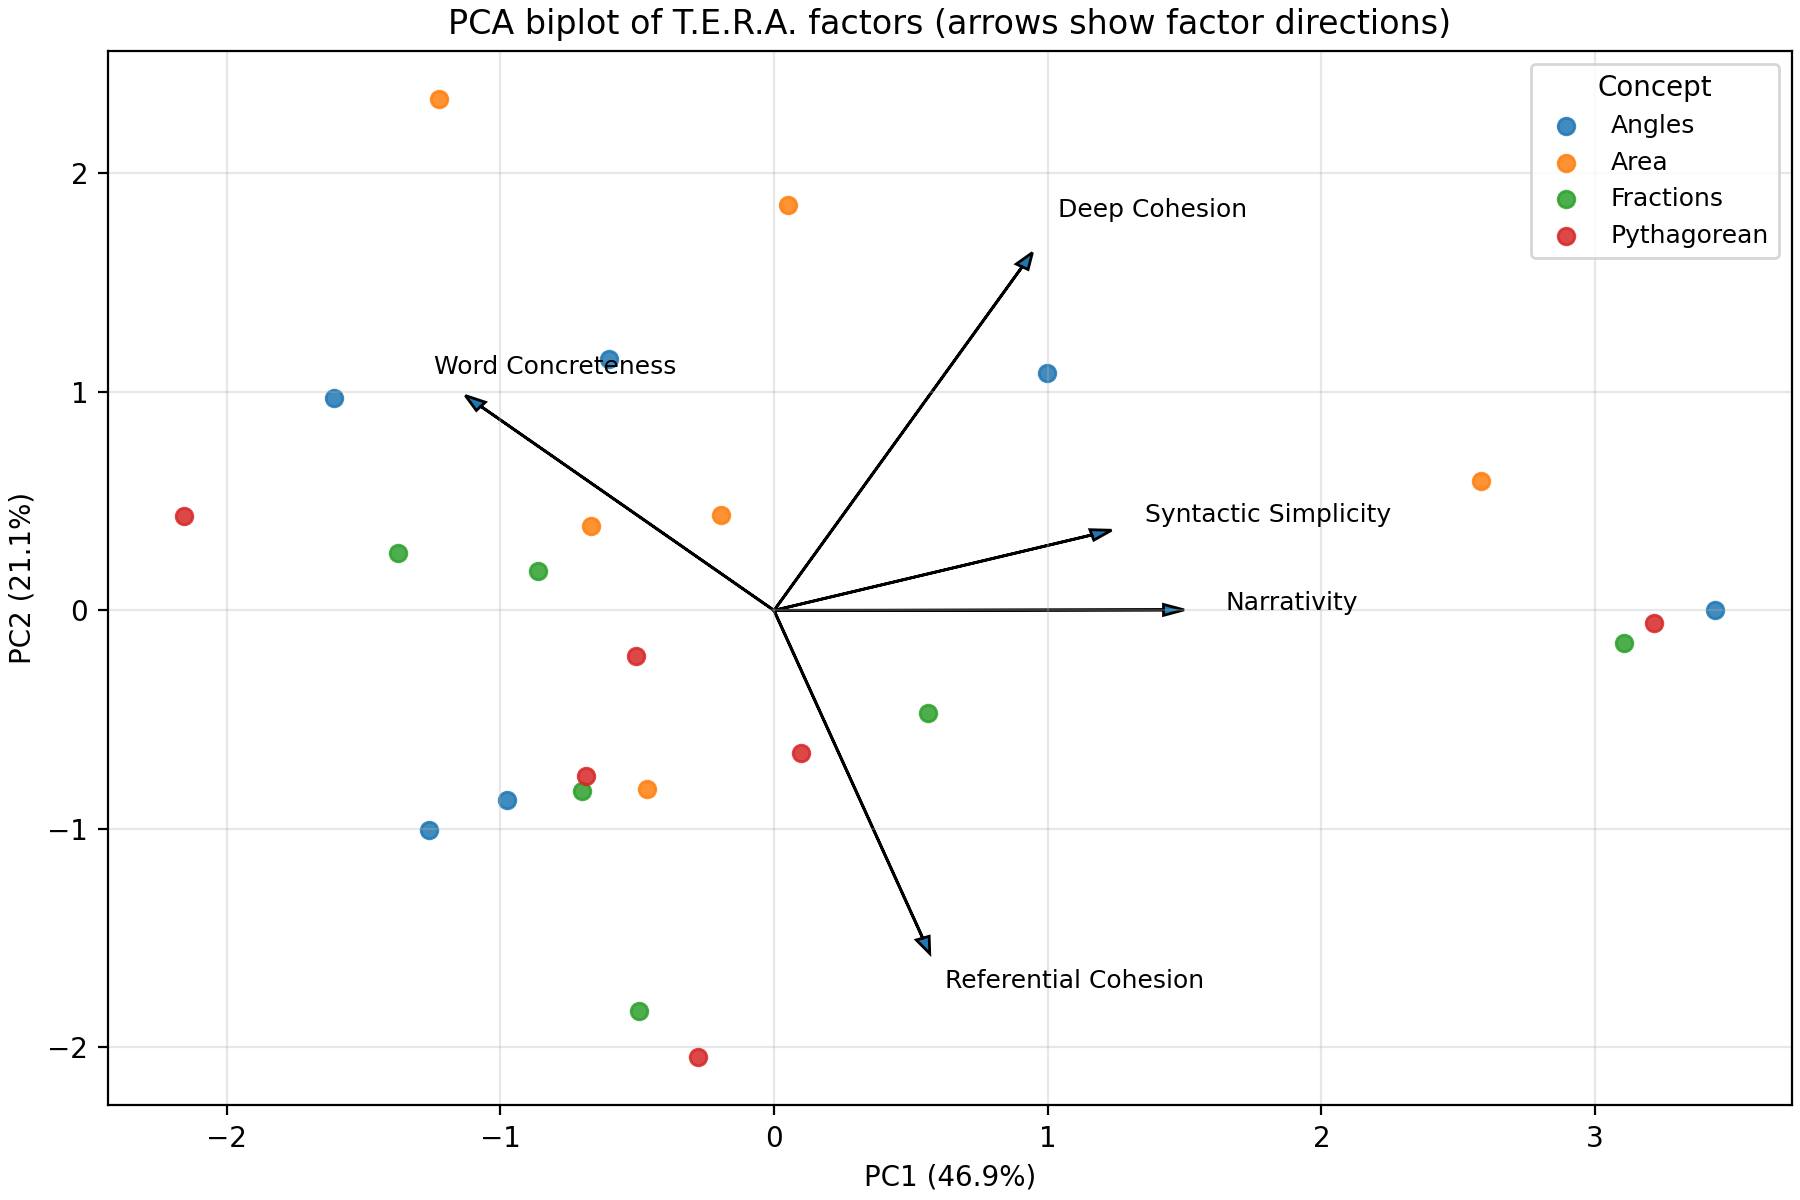
The arrows in the biplot indicate the direction of each T.E.R.A. component in the reduced space. The axis percentages indicate how much of the total variation across the five components is captured by PC1 and PC2. Points closer together have more similar five-factor profiles. With N = 24, the loadings can be unstable to single-text removal, so the biplot is presented as a visualization of overall similarity rather than as inferential evidence.
Hierarchical clustering of source profiles
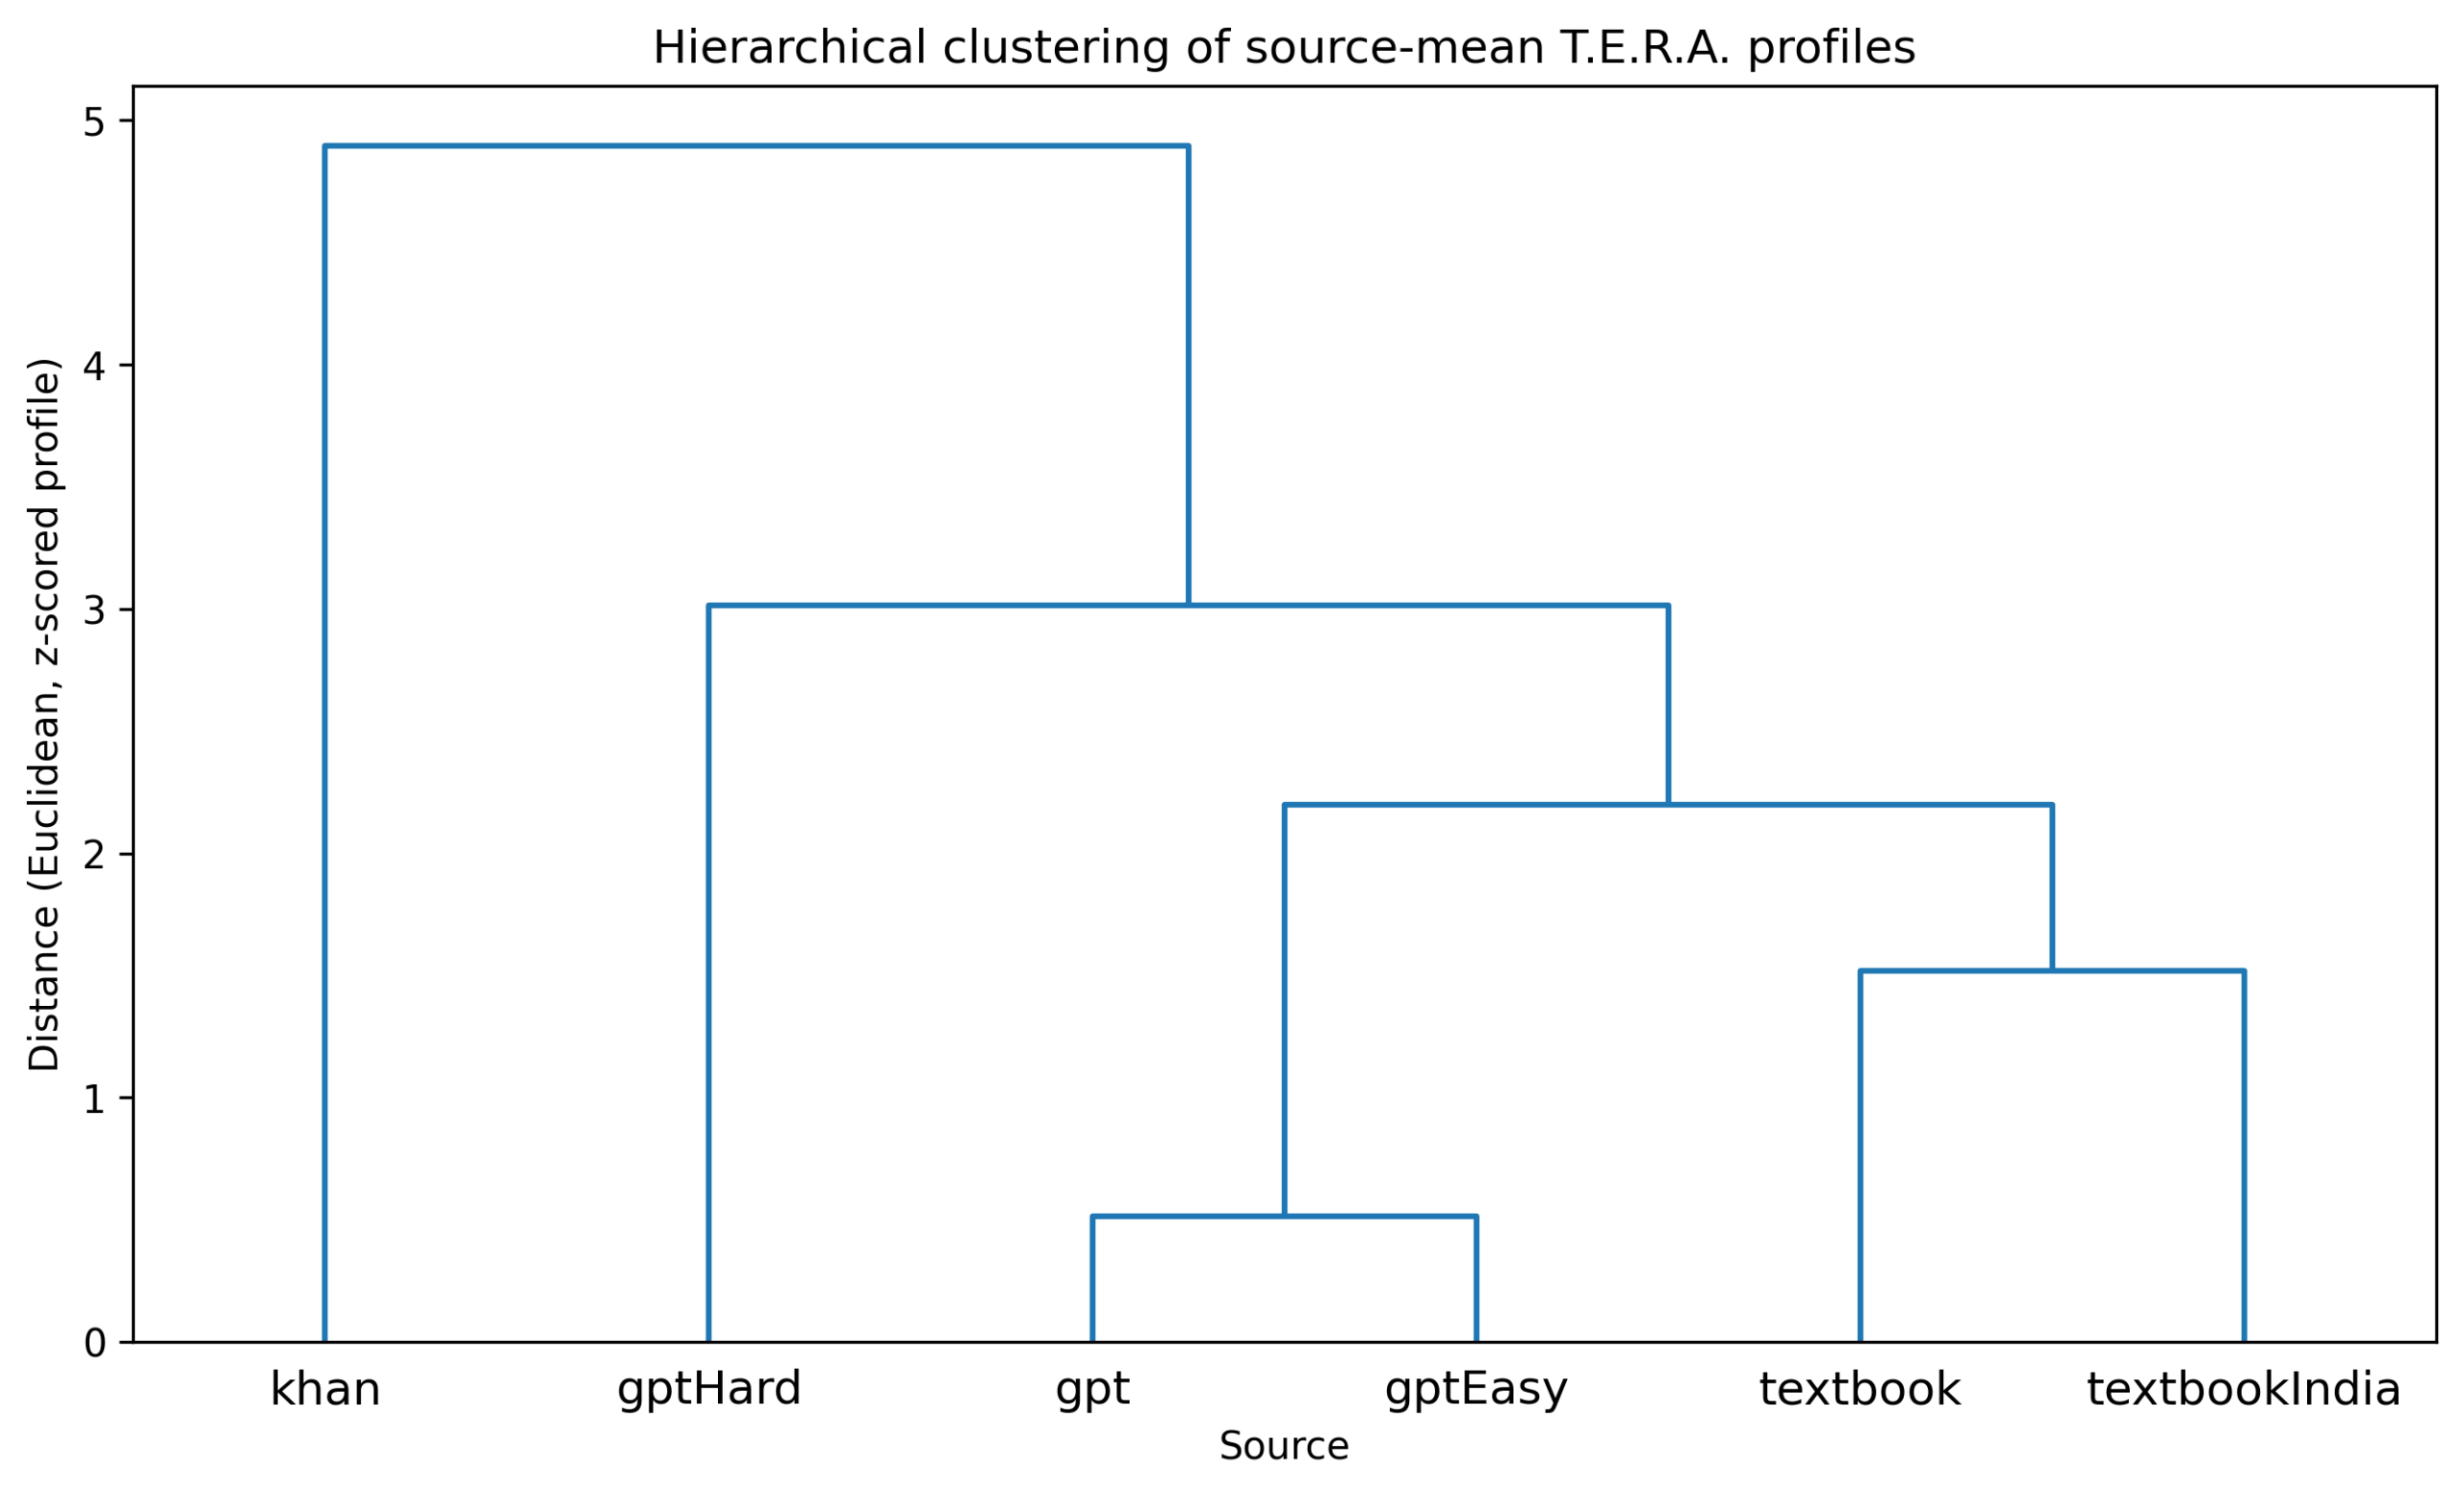
To test more directly whether sources separate by linguistic profile, we performed agglomerative hierarchical clustering on the 6×5 matrix of z-scored source-mean profiles. The dendrogram (Figure 5) shows three structural features. First, the standard and easy ChatGPT prompts merge at the smallest distance in the linkage (d = 0.52), consistent with the two prompts producing very similar mean linguistic profiles. Second, the standard and Indian textbooks merge at the second-smallest distance (d = 1.52), consistent with both print-source profiles sharing a similar concrete-vocabulary signature. Third, the two ChatGPT-variant cluster and the textbook cluster merge at d = 2.20, the hard ChatGPT prompt joins that combined cluster at d = 3.02, and Khan Academy merges last at d = 4.90 — sitting as a single-source outlier at roughly twice the cluster-merge distance of any other source. With only six source means in five-dimensional space the clustering is descriptive rather than inferential; we report the merge order to show that the source-signature claim has structural support beyond visual inspection of the PCA.
Discussion
This study examined whether different math learning resources — Khan Academy, ChatGPT, and textbooks — produce explanations with measurably different linguistic characteristics, and to what extent text length acts as a confound on those characteristics. Across 24 texts covering four mathematical concepts, three findings emerged, addressing each of our three research questions in turn. First (RQ1), each source occupies a distinguishable region of the five-dimensional T.E.R.A. space, with the dendrogram in Figure 5 showing Khan Academy as a single-source outlier and the textbook pair and the ChatGPT-easy/standard pair forming compact within-modality groupings (Fig. 1–2, 5). Second (RQ2), source-level patterns persist across topics in aggregated form (Fig. 2), but per-concept variability (Fig. 1) is non-trivial — particularly for Word Concreteness and Deep Cohesion — and the source-mean profiles should not be over-read as topic-invariant. Third (RQ3), length is associated with multiple T.E.R.A. components in this corpus, and source-level differences are not separable from length-level differences in this design. We report all associations as descriptive within this dataset and make no causal or learning-outcome claim.
One consistent pattern was that Khan Academy scored higher on Narrativity and Syntactic Simplicity compared to the other sources (Fig. 2). This likely reflects the format each resource was designed for: Khan Academy transcripts are spoken explanations, textbooks are written to be formal and precise, and ChatGPT responses are optimized for completeness. These design differences naturally shape whether a text uses conversational phrasing, simpler sentence structures, or more technical language. For instance, Khan Academy had higher Narrativity scores than GPT and textbooks across all four concepts (mean Narrativity ≈ 88 for Khan vs ≈ 35 for GPT and ≈ 26 for the standard textbook).
A second notable pattern involved Word Concreteness (Fig. 1–2). The standard textbook consistently showed higher concreteness, while Khan Academy tended toward more abstract language. This may reflect that some resources anchor explanations in real-world objects and visual references, while others favor abstract instructional phrasing. Importantly, lower concreteness does not necessarily mean an explanation is harder to follow — a highly abstract explanation can still be clear if it is well-structured and logically organized. For example, the standard textbook had much higher Word Concreteness on average (≈ 82) compared to Khan Academy (≈ 4) across the four concepts.
A third pattern appeared in the cohesion measures, particularly Referential Cohesion and Deep Cohesion (Fig. 1–2). Referential Cohesion reflects how often the same words or concepts repeat across nearby sentences, which can help readers track ideas across a text. Deep Cohesion reflects how explicitly the text signals logical relationships, such as cause and effect. In our dataset, Referential Cohesion was relatively high across most sources, suggesting that all three resource types tend to repeat anchor terms (like “hypotenuse” or “area”) to keep readers oriented. Deep Cohesion varied more, likely depending on whether an explanation was structured as a step-by-step derivation or a brief conceptual summary.
An important caveat is that text length acts as a confound in these comparisons (Fig. 3). Our correlation analysis shows that length is associated with several measures, including Narrativity (r = 0.77) and Word Concreteness (r = −0.66). This means some observed differences between sources may partly reflect how long the texts are, rather than the source type alone. A longer transcript has more room for narrative framing and transitions, while a short response may compress ideas more tightly. For this reason, our results should be treated as descriptive patterns rather than a definitive ranking of which resource is best. The PCA biplot (Fig. 4) and the source-mean dendrogram (Fig. 5) offer additional ways to visualize how similar or different the texts and sources are based on the five-factor T.E.R.A. profiles. These analyses are exploratory and do not establish causal relationships.
Several limitations apply to this study. First, the dataset is small (24 texts, 4 concepts), so the observed patterns may not generalize to other topics or formats and per-cell variance cannot be estimated. Second, no human comprehension or expert correctness study was performed: a passage could score high on Narrativity and Syntactic Simplicity while being mathematically incomplete or incorrect, and our results inherit that limitation. Third, our preprocessing step removes all equations, symbols, and standalone numbers before running the analysis, done so because the metrics were designed for normal language arts text. Unfortunately, this means that our scores only describe the surrounding prose, into the full multimodal material a student actually sees. Fourth, the easy and hard ChatGPT prompt variants are author-imposed manipulations and partially measure prompting choices rather than ChatGPT-as-a-platform behaviors; the GPT-easy and GPT-standard cells in particular cluster very tightly (d = 0.52 in Figure 5), indicating those phrasings did not differentiate the profile much in this corpus, while the GPT-hard prompt produced a noticeably different profile. Fifth, although we report 95% confidence intervals throughout, with N = 24 those intervals are wide and the corpus does not support strong inferential claims; we treat all reported associations as descriptive within this dataset.
Future work could meaningfully extend this study in three specific directions. First, an expanded corpus (for example, 6–12 concepts × 6–10 sources, with multiple passages per source-concept cell) would allow per-cell variance to be estimated and would support a mixed-effects model that separates source from topic from length effects. Second, a small human rating study — for example, having 10–20 high-school readers score clarity on a 1–5 scale, blinded to source — would allow human ratings to be correlated with the T.E.R.A. and Flesch–Kincaid scores; this would directly test the operational validity of the discourse-feature instruments on math prose, which has not been done in published form. Third, an equation-preserved versus equation-stripped paired comparison would test how sensitive the T.E.R.A. and Flesch–Kincaid scores are to the preprocessing decision and would quantify how much of the current results reflect the prose surrounding equations versus the multimodal artifact as a whole. Each of these designs is feasible without requiring student-learning-outcome data, and each would directly strengthen the inferential basis of the descriptive baseline reported here. Overall, this study describes that Khan Academy, ChatGPT, and textbooks produce math explanation prose with measurably different linguistic profiles in this corpus, and that text length is an important confound when interpreting those differences (Fig. 1–5). The study does not identify a “best” resource — the data do not support such a claim — and we leave the question of instructional quality to follow-on work that includes mathematical correctness checks and human comprehension ratings.
References
- D. Pimm. Speaking mathematically: communication in mathematics classrooms. Routledge, 1987. [↩]
- M. J. Schleppegrell. The linguistic challenges of mathematics teaching and learning: a research review. Reading & Writing Quarterly. Vol. 23, pg. 139–159, 2007. https://doi.org/10.1080/10573560601158461. [↩]
- T. L. Adams. Reading mathematics: more than words can say. The Reading Teacher. Vol. 56(8), pg. 786–795, 2003. [↩]
- P. J. Guo, J. Kim, R. Rubin. How video production affects student engagement: an empirical study of MOOC videos. Proceedings of L@S 2014, pg. 41–50, 2014. https://doi.org/10.1145/2556325.2566239. [↩]
- E. Kasneci, K. Sessler, S. Küchemann, et al. ChatGPT for good? On opportunities and challenges of large language models for education. Learning and Individual Differences. Vol. 103, 102274, 2023. https://doi.org/10.1016/j.lindif.2023.102274. [↩]
- J. P. Kincaid, R. P. Fishburne Jr., R. L. Rogers, B. S. Chissom. Derivation of new readability formulas (automated readability index, fog count and Flesch reading ease formula) for navy enlisted personnel. Institute for Simulation and Training, 1975. https://stars.library.ucf.edu/istlibrary/56/. [↩] [↩]
- R. Flesch. A new readability yardstick. Journal of Applied Psychology. Vol. 32(3), pg. 221–233, 1948. https://doi.org/10.1037/h0057532. [↩] [↩]
- A. C. Graesser, D. S. McNamara, M. M. Louwerse, Z. Cai. Coh-metrix: analysis of text on cohesion and language. Behavior Research Methods, Instruments, & Computers. Vol. 36, pg. 193–202, 2004. https://doi.org/10.3758/BF03195564. [↩] [↩] [↩]
- A. C. Graesser, D. S. McNamara, J. M. Kulikowich. Coh-Metrix: providing multilevel analyses of text characteristics. Educational Researcher. Vol. 40(5), pg. 223–234, 2011. https://doi.org/10.3102/0013189X11413260. [↩]
- Science of Learning and Educational Technology (SoLET). T.E.R.A.: Coh-metrix common core text ease and readability assessor. https://soletlab.asu.edu/t-e-r-a/, n.d. [↩] [↩]
- M. A. K. Halliday, R. Hasan. Cohesion in English. Longman, 1976. [↩]
- M. A. K. Halliday. Language as social semiotic. Edward Arnold, 1978. [↩]
- W. Kintsch. Comprehension: a paradigm for cognition. Cambridge University Press, 1998. [↩]
- S. A. Crossley, J. Greenfield, D. S. McNamara. Assessing text readability using cognitively based indices. TESOL Quarterly. Vol. 42(3), pg. 475–493, 2008. https://doi.org/10.1002/j.1545-7249.2008.tb00142.x. [↩] [↩]
- W. H. DuBay. The principles of readability. Impact Information, 2004. https://files.eric.ed.gov/fulltext/ED490073.pdf. [↩]
- D. S. McNamara, A. C. Graesser, P. M. McCarthy, Z. Cai. Automated evaluation of text and discourse with Coh-Metrix. Cambridge University Press, 2014. [↩] [↩]
- K. Pearson. Notes on regression and inheritance in the case of two parents. Proceedings of the Royal Society of London. Vol. 58, pg. 240–242, 1895. https://doi.org/10.1098/rspl.1895.0041. [↩] [↩]
- R. A. Fisher. On the “probable error” of a coefficient of correlation deduced from a small sample. Metron. Vol. 1, pg. 3–32, 1921. [↩]
- J. Cohen. Statistical power analysis for the behavioral sciences (2nd ed.). Routledge, 1988. [↩]
- I. T. Jolliffe. Principal Component Analysis (2nd ed.). Springer, 2002. https://link.springer.com/book/10.1007/b98835. [↩] [↩]
- J. F. Hair, W. C. Black, B. J. Babin, R. E. Anderson. Multivariate data analysis (8th ed.). Cengage, 2019. [↩]
- C. Hennig. Cluster-wise assessment of cluster stability. Computational Statistics & Data Analysis. Vol. 52(1), pg. 258–271, 2007. https://doi.org/10.1016/j.csda.2006.11.025. [↩]