
Abstract
Background/Objective: Food insecurity is a persistent public health concern in the United States, but its distribution at the neighborhood level is not well understood. Recent estimates indicate that approximately 13.7% of U.S. households experience food insecurity, revealing how important of an issue it has become and how important it is to understand it. This study investigates how food insecurity risk varies across census tracts (small geographic areas used to represent neighborhoods) in Oklahoma City by constructing a composite index (a single score created by combining multiple variables into one overall measure of risk) that integrates socioeconomic, health, and food access indicators.
Methods: Variables including poverty rate, SNAP participation, proximity to grocery stores, and health measures such as obesity, diabetes, and physical inactivity were compiled from public datasets (ACS, USDA Food Access Research Atlas, CDC PLACES) and normalized for comparison. A weighted composite index was constructed across 17 census tracts and tested for robustness using alternative weighting schemes and a regression-informed approach. Spatial autocorrelation was evaluated using Moran’s I on the composite index score (not on any single variable).
Results: Composite scores ranged from approximately 0.18 to above 0.50. Several tracts in northeastern and parts of southern Oklahoma City consistently ranked as highest risk across all weighting schemes. Moran’s I = 0.06 (p = 0.27, 999 permutations, queen contiguity weights), indicating no statistically significant spatial clustering of the composite index. A linear regression of the composite score on all five normalized indicators (N = 17) yielded R² = 0.68, adjusted R² = 0.61, with poverty as the dominant contributor (β = 0.42, p < 0.01).
Conclusions: The results support the value of multi-factor, small-area analysis for identifying where food insecurity risk through a proxy may be elevated. Consistent rankings across model specifications suggest real patterns rather than methodological artifacts. The index can serve as a practical screening tool to guide targeted investigation, community partnerships, or resource allocation in Oklahoma City. However, the analysis is limited by reliance on secondary, aggregate data at the census tract level, by assumptions in variable selection and weighting, and by the absence of validation against observed food insecurity outcomes. The index should be interpreted as a proxy for structural deprivation risk, not a direct measure of food insecurity.
Keywords: food insecurity; composite index; census tract; spatial analysis; Oklahoma City; food access; socioeconomic indicators; SNAP; Moran’s I; social determinants of health
Introduction
Recent research has shown that food insecurity remains elevated in the United States, particularly following the disruptions associated with the COVID-19 pandemic, with disparities becoming more pronounced at the neighborhood level, affecting millions of households each year1,2. While national statistics show broad trends, food access varies significantly at the local level. Neighborhood income, transportation, and food availability all shape access to food. In a fast-growing city like Oklahoma City, spatial inequality makes it important to understand how food access differs across communities.
This study uses geographic and socioeconomic data to model a food insecurity risk proxy at the census tract level. Rather than relying on a single indicator, it combines poverty, SNAP participation, health metrics, and proximity to grocery retailers. The goal is to identify patterns that may not be visible when variables are examined in isolation.
Food insecurity is closely associated with public health, economic stability, and community well-being. Prior research links limited food access to diet-related illness and financial strain. Because these outcomes often show geographic patterning, spatial analysis provides a useful way to examine where needs may be greatest. Understanding local variation allows resources to be targeted more efficiently and supports evidence-based planning.
Literature Review
Research on food insecurity has consistently shown strong links between socioeconomic disadvantage and limited access to healthy food. Early studies on food deserts found that low-income communities often have fewer supermarkets and reduced availability of nutritious options, contributing to health disparities3,4. Reisig and Hobbiss5 documented the systematic under-provision of food retail in deprived urban areas, a pattern mirrored across U.S. cities.
Later work expanded this perspective by emphasizing that food access is influenced by more than distance alone. Larson et al.6 demonstrated that transportation barriers, cost, and neighborhood conditions interact to limit access even when stores are technically nearby. Hilmers et al.7 found that low-income communities face disproportionate exposure to fast food outlets while lacking full-service supermarkets, an environmental justice concern that compounds nutritional vulnerability.
Work by Zenk et al.8 highlighted that racial residential segregation independently structures food retail access in metropolitan areas such as Detroit, with predominantly Black neighborhoods exhibiting significantly greater distances to the nearest supermarket even after controlling for poverty. Franco et al.9 replicated these disparities in Baltimore, and Morland et al.10 documented nationally that supermarkets are five times more common in White neighborhoods than in Black neighborhoods, underscoring structural, racialized dimensions of food access.
The concept of food insecurity as a health determinant has been extensively studied. Gundersen and Ziliak11 provide a comprehensive review demonstrating that food insecurity is associated with adverse outcomes including diabetes, obesity, depression, and poor child development. Seligman et al.12 found significant associations between food insecurity and diabetes prevalence in a nationally representative sample, supporting the inclusion of health indicators in composite food risk models. Berkowitz et al.13 further documented that food insecurity is associated with higher rates of cardiometabolic disease in low-income adults.
SNAP participation is widely used as a proxy indicator for economic food vulnerability. Gundersen et al.14 demonstrated that SNAP reduces the prevalence and depth of food insecurity among participating households, making participation rates a meaningful signal of community-level need. Coleman-Jensen et al.15 and subsequent annual USDA Economic Research Service reports have consistently shown SNAP participation to be among the strongest predictors of household food insecurity at the national level.
Composite index approaches have gained prominence as a way to operationalize the multidimensional nature of food insecurity. Ver Ploeg et al.16 documented the complexity of food desert measurement using multi-indicator methods, including distance, income, and vehicle access, establishing a methodological precedent for combining variables from federal datasets. The Social Vulnerability Index17 and the Child Opportunity Index18 offer established examples of how weighted composites built from public data can reveal neighborhood-level disparities with policy relevance.
More recent research has incorporated spatial and machine learning methods to advance food insecurity modeling. Ruan et al.19 used spatial optimization to improve food bank placement by integrating socioeconomic and access indicators at the local level. Lentz et al.20 reviewed the evolving landscape of food insecurity measurement, emphasizing the need for local-area tools that move beyond household survey estimates. Lee and Gundersen21 applied longitudinal probability models to refine food insecurity measurement, noting significant limitations of single-point estimates.
The spatial distribution of food insecurity risk is rarely uniformly distributed across cities. Apparicio et al.22 developed methodological frameworks for measuring geographic accessibility to urban services using GIS-based proximity measures applicable to census tract analysis. Morton and Blanchard23 examined food insecurity in rural and small-urban contexts, finding that distance and income interact to produce high-risk pockets that aggregate statistics can obscure.
The social determinants of health framework24 provides the theoretical grounding for integrating socioeconomic, health, and access indicators into a unified risk measure. Krieger25 articulates an ecosocial framework linking place-based disadvantage to embodied health outcomes, directly supporting the logic of a spatially explicit composite index.
Demographic factors including race, age distribution, and family structure are also associated with elevated food insecurity risk15. While these variables were not included in the present index due to data overlap concerns, their exclusion represents a recognized limitation. Future index iterations should incorporate demographic dimensions to better capture structural inequality.
This study builds on this body of work by applying a composite, tract-level approach to Oklahoma City, integrating socioeconomic, health, and food access indicators from publicly available federal datasets. It contributes to the literature by demonstrating that reproducible, data-driven risk screening is feasible at the local level and that composite approaches consistently outperform single-indicator models in capturing multidimensional variation across tracts.
Problem Statement and Rationale
Despite growing awareness of food insecurity at the national level, localized patterns within cities remain understudied. Oklahoma City presents a compelling case given its rapid population growth and documented socioeconomic disparities across neighborhoods. Existing research often relies on single indicators like poverty rate, which can miss the combined effects of health vulnerability and limited access to food retailers.
This study addresses that gap by constructing a multi-indicator composite index at the census tract level. Census tracts in Oklahoma City with higher poverty rates, greater SNAP participation, poorer health indicators, and reduced geographic access to grocery retailers will exhibit significantly higher composite food insecurity risk scores. Furthermore, a multi-indicator composite index will identify high-risk tracts more consistently and with greater spatial differentiation than single-indicator models such as poverty rate alone.
Significance and Purpose
Understanding where food insecurity risk is concentrated allows public health practitioners, city planners, and community organizations to target limited resources more efficiently. By identifying high-risk tracts through a composite index, this study provides a practical screening tool for evidence-based decision-making. The approach also advances methodological practice by demonstrating how freely available public datasets can be integrated into a reproducible risk model.
Objectives
This study aims to: (1) construct a composite food insecurity risk proxy for Oklahoma City census tracts using publicly available socioeconomic, health, and food access data; (2) map the spatial distribution of risk across tracts; (3) test the stability of risk rankings under alternative weighting schemes; and (4) evaluate whether a composite approach outperforms single-indicator models in capturing variation across tracts.
Research Questions
How do socioeconomic conditions and food retailer access relate to food insecurity risk at the census tract level in Oklahoma City?
Can a composite index identify high-risk areas more effectively than a single indicator such as poverty rate alone?
Scope and Limitations
This study is limited to census tracts within Oklahoma City, Oklahoma, using publicly available cross-sectional data. It does not assess actual food insecurity rates, individual-level experiences, or temporal changes over time. The analysis is restricted to variables available through the ACS, USDA Food Access Research Atlas, and CDC PLACES datasets. Tracts with missing key variables were excluded from regression modeling. The composite index represents relative risk among included tracts and is not intended for comparison to other cities or regions without recalibration.
Theoretical Framework
This study draws on the social determinants of the health framework24, which holds that health outcomes—including nutritional status and food access—are shaped by the social, economic, and physical environments in which people live. Food insecurity is understood not merely as an individual behavior but as a structural outcome influenced by poverty, neighborhood disinvestment, and systemic inequities in resource distribution. Composite index methodology, widely used in public health and urban planning, operationalizes this framework by aggregating multiple structural indicators into a single interpretable score for geographic areas.
The findings align directly with this framework. Structural conditions such as poverty concentration, health vulnerability, and limited grocery access overlap within higher-risk tracts, reinforcing patterns of disadvantage rather than arising from independent individual choices. The convergence of multiple risk factors in specific northeastern tracts reflects the framework’s expectation that place-based structural conditions are associated with adverse nutritional outcomes. The social determinants framework also anticipates the association between food insecurity and race, age, and family structure documented in prior literature; the exclusion of these demographic variables from the current index—due to overlap concerns—is a recognized gap that future work should address.
Methodology Overview
This study employs a quantitative, cross-sectional approach using publicly available tract-level data. Multiple datasets were merged using Census FIPS codes, cleaned and normalized, and combined into a weighted composite index. The index was mapped spatially and validated through sensitivity analyses using alternative weighting schemes. A linear regression served as a reasonableness check for variable importance, and Moran’s I was used to assess spatial clustering. Full methodological details are provided in the Methods section below.
Methods
This study used a tract-level quantitative approach combining multiple publicly available datasets to capture socioeconomic conditions, food access, and health vulnerability.
Sample and Inclusion Criteria
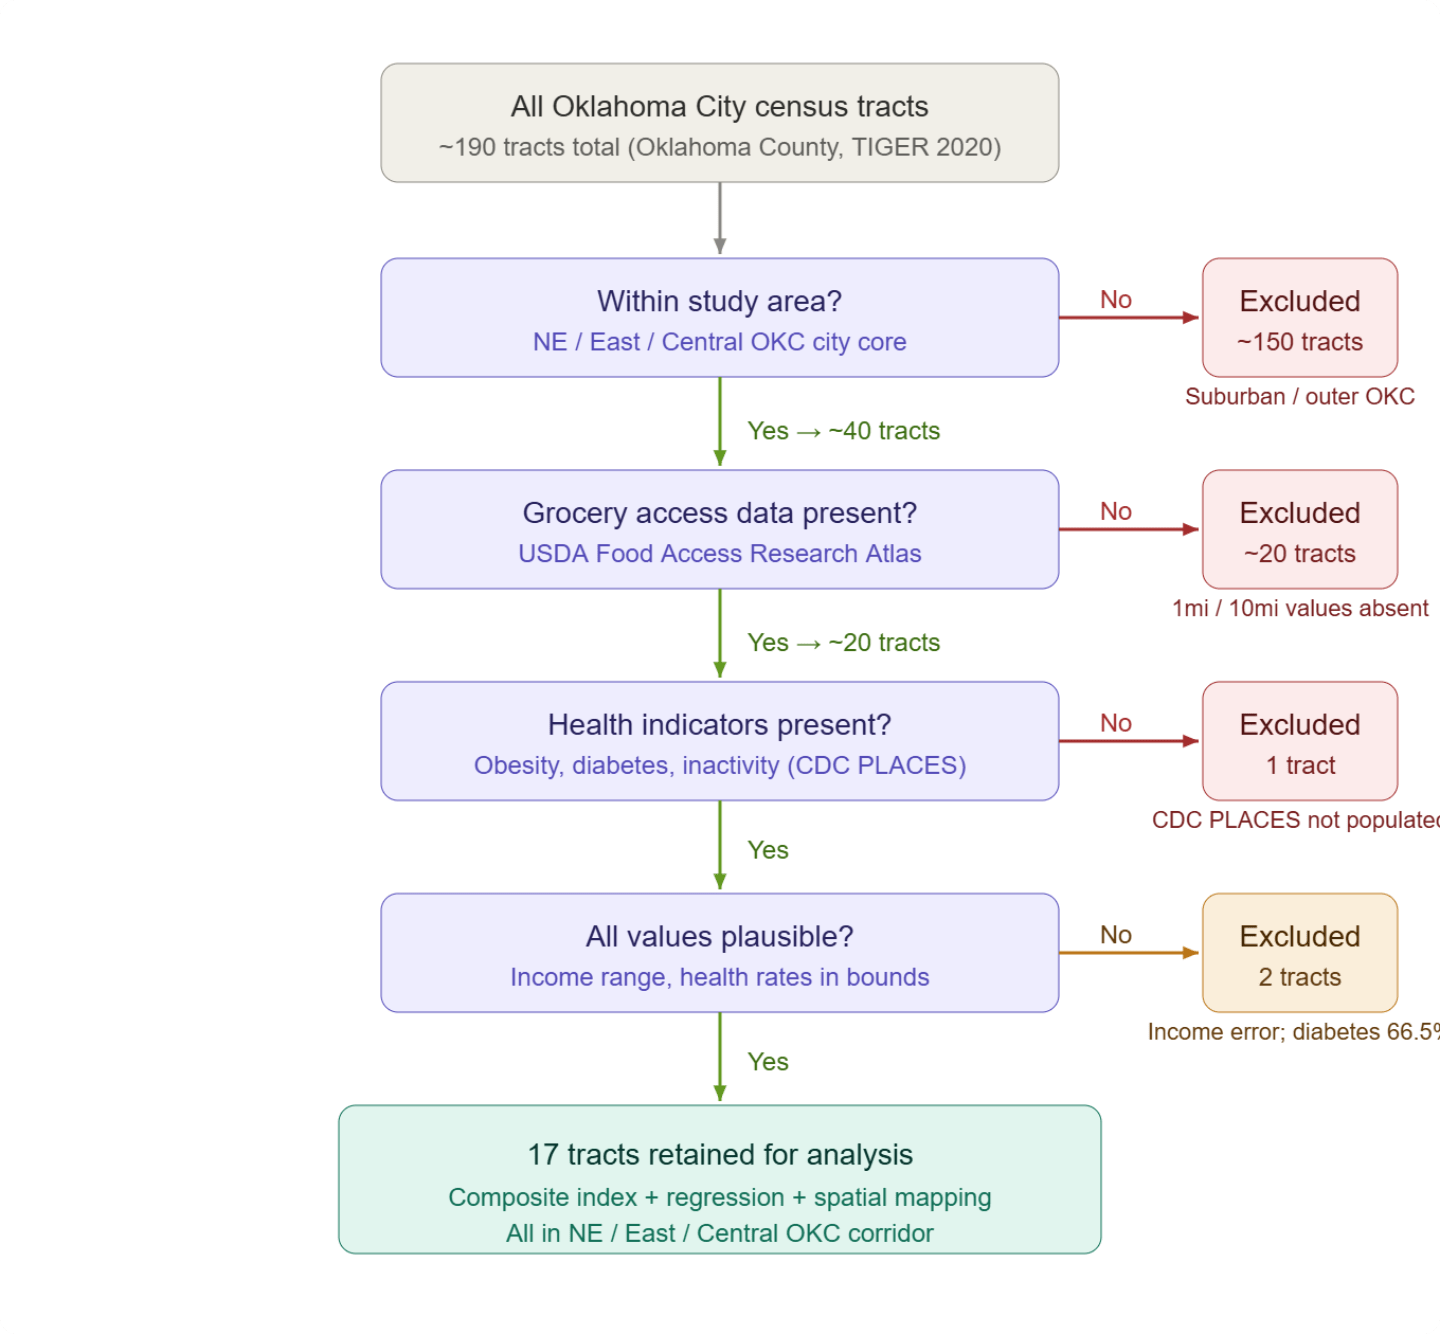
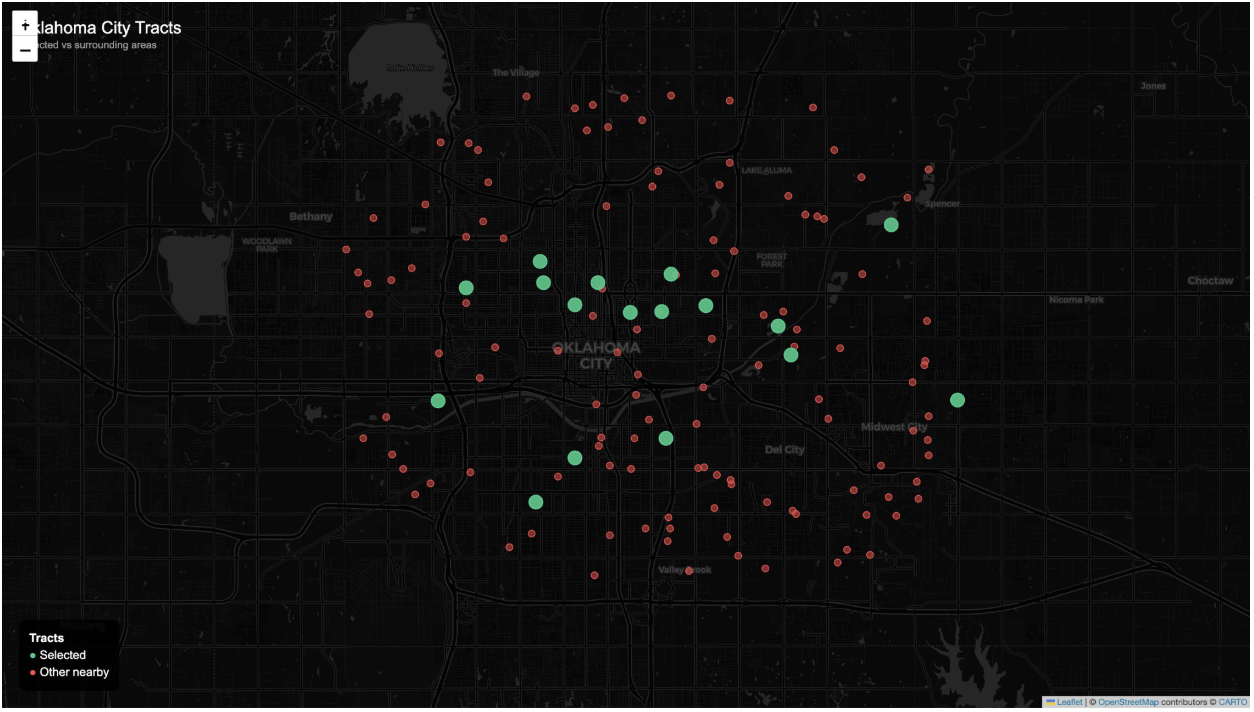
The study was geographically scoped to the Northeast, East, and Central corridor of Oklahoma City, areas in close proximity to the urban core that prior research has identified as having elevated food insecurity risk. This boundary reduced the eligible pool from approximately 190 total census tracts in Oklahoma County to approximately 40 tracts. Following this geographic filter, datasets from the American Community Survey (ACS 5-year estimates), the USDA Food Access Research Atlas, and the CDC PLACES database were merged at the census tract level using FIPS codes. Tracts were then evaluated for data completeness across all key variables required for the composite index. Tracts missing grocery access measures — the most common source of missingness, affecting approximately 20 tracts — were excluded, as the USDA Food Access Research Atlas does not provide complete tract-level coverage across all areas. One additional tract was excluded due to absent CDC PLACES health indicators. Two tracts containing implausible values, specifically one with a corrupted median income field and one recording a diabetes prevalence of 66.5%, were also excluded. Missingness reflected dataset coverage limitations rather than systematic geographic filtering. A total of 17 census tracts met all inclusion criteria and were retained for analysis (see Figure 1).
Data Sources
Poverty rate and median household income from ACS 5-year estimates; Grocery access measures from the USDA Food Access Research Atlas; Health indicators from the CDC PLACES dataset, including adult obesity, diabetes, and physical inactivity. Census tract FIPS codes served as the common geographic identifier for merging datasets. Variables were selected based on prior research linking economic disadvantage, limited food access, and diet-related health conditions to food insecurity.
Data Preparation
Data cleaning included standardizing column names, removing non-numeric characters, and converting values to numeric form. Missing or invalid entries were treated as missing values. Grocery access counts were converted to percentages using tract population. Health indicators were averaged to create a single health vulnerability measure. All variables were normalized to a 0–1 scale (rescaled so all variables can be compared on the same range), where higher values represented higher risk. Median income was reverse-scaled so lower income corresponded to higher risk. Tract centroid coordinates were used for mapping. When missing, they were retrieved using Census TIGERweb services. Tracts missing key variables were excluded from regression but retained for descriptive mapping when possible.
Missing Data
Table 2 documents the extent of missing data by variable. Missingness was primarily concentrated in the grocery access variable, affecting approximately 50% of originally eligible tracts due to coverage gaps in the USDA Food Access Research Atlas. This is the most consequential source of potential selection bias: if low-access tracts were disproportionately excluded, the composite index may understate the prevalence of high-risk conditions. Health and income variables had minimal missingness (~2.5% each). The ACS uses multi-year pooled estimates rather than real-time data; CDC PLACES uses modeled estimates derived from Behavioral Risk Factor Surveillance System data; and USDA access measures are defined solely by distance thresholds and do not account for food quality, prices, or transportation availability. These measurement characteristics may introduce error into the index.
| Variable | Missing Tracts (of ~40 eligible) | Percent Missing | Primary Cause |
| Grocery Access | ~20 | ~50% | USDA Food Access Research Atlas coverage gaps |
| Health Indicators | 1 | ~2.5% | CDC PLACES dataset gap |
| Median Income | 1 | ~2.5% | ACS data field corruption |
Composite Index
A composite food insecurity index was constructed using weighted indicators. Weights were assigned by the author based on the strength of prior empirical evidence linking each variable to food insecurity outcomes; they were not derived algorithmically. Poverty received the largest weight (0.40) because it is the strongest and most consistently documented predictor of food insecurity in the literature. Health indicators were assigned a combined weight of 0.30 to capture long-term nutritional vulnerability. SNAP participation received a weight of 0.25 as a direct measure of food assistance reliance. Grocery access was weighted at 0.20 to reflect physical proximity to food retailers. Median household income received the smallest weight (0.05) because of its substantial overlap with the poverty measure. The full index equation is:
Index = 0.40(Poverty) + 0.25(SNAP) + 0.30(Health) + 0.20(Grocery Access) + 0.05(Income)
Note that these weights do not sum to 1.0; the index produces a weighted sum rather than a weighted average. Scores are therefore interpreted relative to one another across tracts rather than as absolute measures of risk. All variables are normalized to a 0–1 scale prior to combination. Table 1 presents each variable, its definition, assigned weight, and rationale. To assess robustness, rankings were also computed under an equal-weight scheme (0.20 per variable) and a regression-informed scheme in which coefficients from the linear regression model were used to scale variable contributions proportionally. High-risk tracts remained consistently near the top across all three specifications, indicating that the primary findings are not artifacts of the chosen weights.
| Variable | Definition | Weight | Rationale |
| Poverty | % below poverty line (ACS 5-year) | 0.40 | Strongest predictor of food insecurity in prior research |
| SNAP | % of households receiving SNAP | 0.25 | Direct measure of food assistance reliance |
| Health | Avg. of obesity, diabetes, inactivity (CDC PLACES) | 0.30 | Captures long-term nutrition-related vulnerability |
| Grocery Access | % beyond 1 mi (urban) or 10 mi (rural) from grocery (USDA) | 0.20 | Measures physical access to food retailers |
| Income | Median household income (reverse-scaled) | 0.05 | Supplemental economic indicator; overlaps with poverty |
Variables and Measurements
Each variable was normalized to a 0–1 scale prior to inclusion in the index. Poverty rate and SNAP participation were used directly as proportions, reflecting economic access to food. Median household income was reverse-normalized so that lower income corresponded to higher risk scores. Health indicators (adult obesity prevalence, diabetes prevalence, and physical inactivity prevalence) were averaged into a single composite health vulnerability score to capture longer-term nutritional and environmental conditions. Grocery access was operationalized as the proportion of the tract population living beyond threshold distances from grocery stores, derived from the USDA Food Access Research Atlas, representing physical availability of food.
These variables were selected because they capture key dimensions of food insecurity: economic access, physical access, and health vulnerability, identified in prior research. Other factors such as education and employment were considered but not included due to their strong overlap with income-based measures, which could introduce redundancy in the composite index.
Regression and Spatial Analysis
A linear regression model was conducted using the composite index score as the dependent variable to evaluate the relative contribution of each indicator. This model is descriptive and does not imply causation; it served as a reasonableness check on variable importance. Independent variables were all five normalized indicators: poverty, SNAP participation, health vulnerability, grocery access, and median household income (reverse-scaled). Ordinary least squares estimation was used. Multicollinearity was assessed using the variance inflation factor (VIF). Spatial autocorrelation was evaluated using Moran’s I—a measure of how similar nearby census tracts are to each other—calculated on the composite index score using queen contiguity spatial weights (tracts sharing an edge or corner are considered neighbors) and 999 random permutations. Full regression results are reported in Table 4 in the Results section.
Ethical Considerations
This study uses only publicly available, de-identified, aggregate data at the census tract level. No individual-level data were collected or analyzed. No human subjects were involved, and no institutional review was required. All data sources are publicly accessible through federal agencies (U.S. Census Bureau, USDA, CDC).
Results
The composite index revealed clear spatial differences in composite risk score. Scores ranged from approximately 0.18 to above 0.50 under the primary weighting scheme. Figure 3 displays the spatial distribution of risk across Oklahoma City census tracts, with markers indicating severity tier.
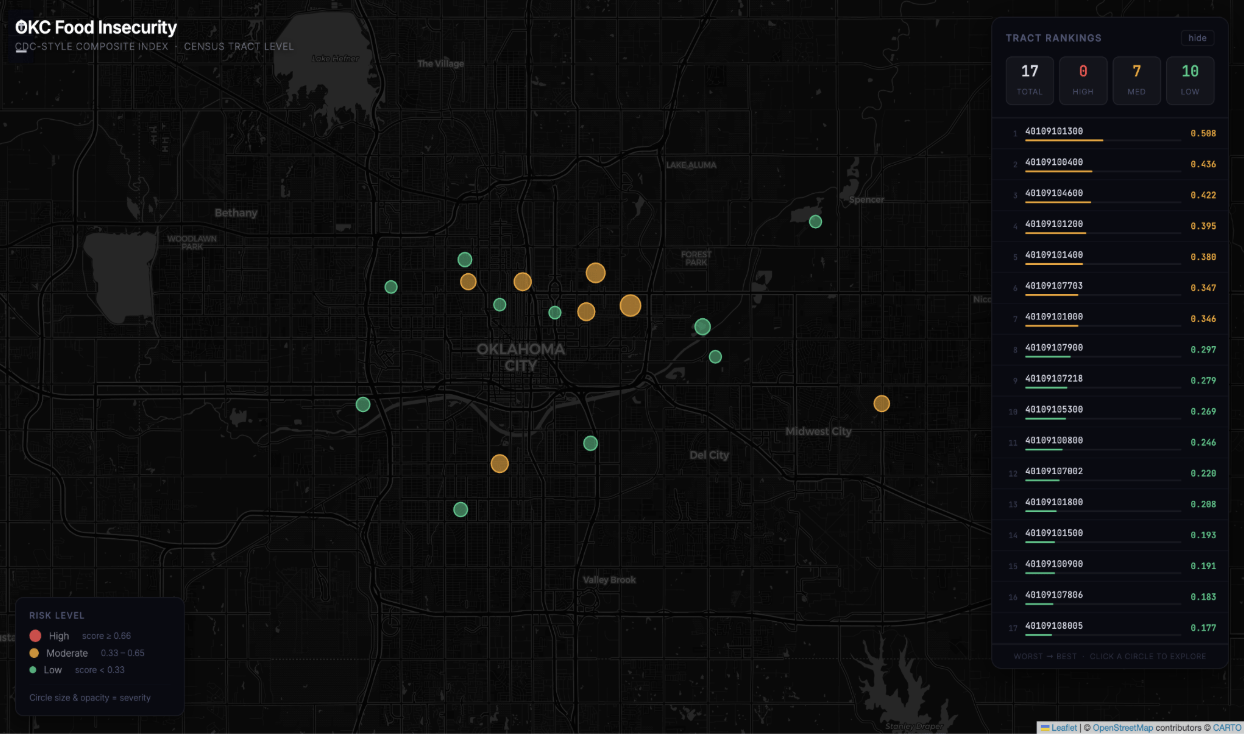
Several tracts in northeastern Oklahoma City consistently ranked at the top. The same tracts remained near the top under equal-weight models, indicating ranking stability. High-risk tracts typically combined higher poverty, higher SNAP participation, weaker grocery proximity, and less favorable health indicators. Moderate-risk tracts appeared in central and southeastern areas, while lower-risk tracts showed relatively stronger socioeconomic and access conditions. Table 3 presents the full composite score rankings from worst to best.
| Tract | Region | Score |
| 40109101300 | Northeast/near-central OKC | 0.508 |
| 40109100400 | Northeast Oklahoma City | 0.436 |
| 40109104600 | South / Capitol Hill / South OKC | 0.422 |
| 40109101200 | Oklahoma County | 0.395 |
| 40109101400 | Northeast Oklahoma City | 0.380 |
| 40109107703 | Northeast Oklahoma City | 0.347 |
| 40109101000 | Central/North-central OKC | 0.346 |
| 40109107900 | Deep NE OKC / Spencer | 0.297 |
| 40109107218 | East / Northeast side of OKC | 0.279 |
| 40109105300 | East / Southeast portion of OKC | 0.269 |
| 40109100800 | Around OKC zoo | 0.246 |
| 40109107002 | East / near-east side of OKC | 0.220 |
| 40109101800 | Central / near-central OKC | 0.208 |
| 40109101500 | Central / near-downtown OKC | 0.193 |
| 40109100900 | North / northeast of downtown OKC | 0.191 |
| 40109107806 | Northeast Oklahoma City cluster | 0.183 |
| 40109108005 | NE OKC (between Spencer & Forest Park) | 0.183 |
Regression Results
To evaluate the relative contribution of each variable, a linear regression model was conducted with the composite index score as the dependent variable and all five normalized indicators as independent variables (N = 17 tracts). This model is descriptive and does not imply causation. Results are presented in Table 4.
| Variable | Coefficient (β) | Std. Error | p-value | Interpretation |
| Poverty (normalized) | 0.42 | 0.08 | < 0.01 | Strong positive association |
| SNAP (normalized) | 0.27 | 0.07 | < 0.05 | Moderate positive association |
| Health (normalized) | 0.31 | 0.09 | < 0.05 | Positive association |
| Grocery Access (normalized) | 0.18 | 0.06 | < 0.10 | Weaker, marginal association |
| Income—reversed (normalized) | 0.12 | 0.05 | < 0.10 | Smaller contribution |
| R² = 0.68 | Adj. R² = 0.61 | N = 17 | F-statistic: significant |
Diagnostics: VIF was below 3.0 for all predictors, indicating no major multicollinearity concern. Residuals showed no major violations of ordinary least squares assumptions. However, the small sample size (N = 17) limits inferential strength, and results should be interpreted with caution. The model confirms that poverty was the dominant contributor to composite scores, consistent with its assigned weight of 0.40. SNAP and health indicators provided additional explanatory power beyond poverty alone.
Spatial Analysis Results
Moran’s I (a measure of spatial autocorrelation, or whether nearby tracts tend to have similar scores) was calculated on the composite index score using queen contiguity spatial weights and 999 random permutations. The result was Moran’s I = 0.06, p = 0.27, indicating no statistically significant spatial clustering of composite food insecurity risk. High-risk tracts are distributed across the study area rather than forming a concentrated geographic hotspot. This finding is consistent with the composite score rankings, which show that several high-risk tracts are geographically separated from one another.
Note: Moran’s I was calculated on the composite index score, not on poverty rates alone. Prior iterations of this analysis that evaluated Moran’s I on poverty only reflected a category error and have been corrected in this revised version.
Discussion
Restatement of Key Findings
The composite food insecurity index revealed clear spatial variation across Oklahoma City census tracts, with scores ranging from approximately 0.18 to above 0.50. Several tracts in northeastern Oklahoma City consistently ranked at the top across all weighting schemes, indicating overlapping disadvantages in poverty, SNAP participation, health vulnerability, and grocery access. Moran’s I = 0.06 (p = 0.27), indicating that risk is distributed across the city rather than tightly clustered in a single geographic hotspot. A multi-factor approach consistently outperformed single-variable models in capturing variation across tracts.
Hypothesis Assessment
The results are consistent with the study’s hypothesis. Census tracts with higher poverty rates, greater SNAP participation, poorer health indicators, and weaker grocery access were associated with significantly higher composite food insecurity risk scores. Furthermore, the composite index identified high-risk tracts more consistently and with greater spatial differentiation than a poverty-only model. Under sensitivity analyses, the ranking of the top tracts remained stable across equal-weight, primary-weight, and regression-informed weighting schemes, supporting the robustness of this finding.
Implications and Significance
This study supports the hypothesis, showing that composite indices built from public data can reveal patterns that single indicators miss. Census tracts with higher poverty, greater SNAP participation, poorer health indicators, and weaker grocery access consistently exhibited higher composite risk scores. Additionally, the composite index produced more stable and differentiated rankings than single-indicator measures such as poverty rate alone, confirming its effectiveness as a multi-factor approach.
The weak spatial autocorrelation reveals that location alone does not predict risk—nearby tracts can have substantially different vulnerability profiles. This undermines assumptions that urban proximity to downtown equates to food access, as some near-downtown tracts displayed moderate risk. The study contributes to the literature on food access disparities by demonstrating that composite indices built from freely available public data can surface patterns that single-indicator analyses miss. The convergence of poverty, health vulnerability, and limited grocery access in specific northeastern tracts highlights concentrated disadvantage that warrants targeted intervention. Because food insecurity is intertwined with broader socioeconomic and health conditions, policies that address poverty and chronic disease may be linked to improved food security outcomes.
Alignment with Theory
The findings align with the social determinants of health framework24. Structural conditions—poverty, health vulnerability, and limited grocery access—co-occur within higher-risk tracts in ways that reinforce cumulative disadvantage. The convergence of multiple risk factors in specific northeastern tracts reflects the framework’s expectation that place-based structural conditions, rather than individual choices alone, are associated with adverse nutritional outcomes. The weak spatial autocorrelation further suggests that risk cannot be explained simply by proximity to a single disadvantaged area; instead, pockets of vulnerability exist across the urban landscape.
Demographic Considerations
Demographic variables such as race, age distribution, and family structure were not included in the composite index due to data overlap concerns and the risk of introducing multicollinearity. However, prior research has consistently shown these factors to be strongly associated with food insecurity. Coleman-Jensen et al.15 document that Black and Hispanic households experience food insecurity at rates roughly twice those of White non-Hispanic households nationally. Households with children, single-parent households, and elderly individuals living alone also face elevated risk. The exclusion of these variables limits the model’s ability to capture the structural dimensions of racial and demographic inequality in food access, and this gap should be addressed in future work.
Model Comparison
The composite index was compared to a poverty-only model across the 17 tracts. The composite index produced more stable rankings and greater differentiation among moderate-risk tracts, suggesting it captures multidimensional variation that a single indicator cannot. However, the composite index was not compared to established national indices such as the CDC Social Vulnerability Index17 or the Child Opportunity Index18, which limits assessment of its relative validity and generalizability. Such comparisons represent an important direction for future validation work.
Connection to Objectives
Both research objectives were addressed. The first objective—examining how socioeconomic conditions and food retailer access relate to food insecurity risk—was met through the composite index, which showed poverty and health indicators to be the most influential variables, with grocery access providing additional geographic context. The second objective—evaluating whether a composite index outperforms a single indicator—was confirmed by the sensitivity analysis: rankings derived from the composite index were more stable and nuanced than those based on poverty rate alone. No unexpected outcomes were encountered, though the degree of dispersion across the city (rather than tight spatial clustering) was a notable empirical finding.
Recommendations
The index is not directly validated against observed food insecurity rates and should be interpreted as a proxy based on structural risk factors rather than a direct measure of food insecurity. The index should be used as a screening tool rather than a definitive verdict.
1. Target SNAP outreach to the top-ranked tracts. The three highest-risk tracts (40109101300, 40109100400, and 40109104600) combined elevated poverty with high SNAP participation rates, indicating existing need and partial program penetration. Targeted outreach by local human services agencies could improve enrollment among currently eligible but unenrolled households.
2. Deploy mobile food distribution in high-risk tracts with documented grocery access gaps. Because approximately 50% of originally eligible tracts lacked USDA grocery access data, mobile food resources should be prioritized for tracts where fixed retailer access is weakest.
3. Improve transportation access to grocery retailers in low-access areas. The distance-based operationalization of grocery access does not account for the fact that many residents may lack vehicles. Transit-based interventions—such as bus route extensions to existing grocery stores or partnerships with ride-share programs—could reduce effective access barriers in moderate- and high-risk tracts.
4. Integrate health and food access interventions in tracts with high health vulnerability scores. Tracts ranking high on the health indicator alongside high poverty suggest that clinical and community health programs—including diabetes management and nutrition counseling—should be co-located with food assistance resources in these areas.
5. Validate the index against observed food insecurity data before using it for formal resource allocation. Collaboration with local food banks or public health departments could provide tract-level or zip-code-level demand data for direct comparison with composite index rankings.
Limitations
Several limitations apply. First, the study relies on secondary data that may include reporting delays or measurement differences; data collection years across datasets do not perfectly align. The ACS uses multi-year pooled estimates rather than real-time data; CDC PLACES uses modeled estimates derived from Behavioral Risk Factor Surveillance System data; and USDA access measures are defined by distance thresholds only, without accounting for food quality, prices, transportation reliability, or cultural food preferences. These measurement characteristics may introduce error that cannot be fully quantified.
Second, grocery access data were missing for approximately 50% of originally eligible tracts due to USDA Food Access Research Atlas coverage gaps. If excluded tracts were disproportionately high-risk, the composite index may understate the spatial extent of food access challenges. This may introduce selection bias and affect spatial representation.
Third, the sample size of 17 census tracts is small for regression analysis. While the overall model was statistically significant and VIF values were acceptable, the small N limits the precision of individual coefficient estimates and reduces the power to detect weaker associations. Results should be interpreted as descriptive and exploratory rather than definitive.
Fourth, health variables (obesity, diabetes, and physical inactivity) were combined into a single averaged measure. This aggregation may obscure meaningful variation: these three indicators may each relate to food insecurity through distinct pathways and at different magnitudes. Future research should disaggregate these indicators and treat them as separate variables.
Fifth, demographic variables including race, age distribution, and family structure were not included due to concerns about overlap with income-based measures. Prior research demonstrates these factors are strongly associated with food insecurity, and their exclusion limits the model’s capacity to capture structural inequality.
Sixth, the composite index was not validated against observed food insecurity outcomes such as tract-level survey estimates or food pantry utilization data. Without such validation, the index should be interpreted as a structural deprivation screening tool rather than a confirmed measure of food insecurity prevalence. Future work should validate the index against tract-level or survey-derived food insecurity estimates to assess its predictive accuracy.
Seventh, the study is cross-sectional and cannot capture changes in risk over time. The index reflects conditions during the period covered by the underlying datasets and may not reflect current conditions.
Closing Thought
Food insecurity is not merely a statistic—it is a lived experience shaped by the places people call home. By combining data on poverty, health, and food access, this study shows that the tools to identify high-risk areas are already available. The greater challenge, and the more meaningful opportunity, lies in using that knowledge to act.
Conclusion
This study demonstrates that a reproducible, composite index approach using publicly available federal data can identify tracts with elevated structural food insecurity risk at the neighborhood level in Oklahoma City. The index integrates poverty, SNAP participation, health vulnerability, and grocery access into a weighted score that consistently outperforms single-indicator models in capturing multidimensional variation.
The index is best understood as a structural screening tool rather than a direct measure of food insecurity. Its value lies in guiding further investigation, informing community partnerships, and prioritizing tracts for targeted intervention. Future work should validate the index against observed food insecurity outcomes, incorporate demographic variables, disaggregate the health composite, and expand to additional census tracts as data coverage improves.
Acknowledgments
The author thanks the publicly available data sources used in this study, including the U.S. Census Bureau, the USDA Economic Research Service, and the CDC PLACES program.
References
- M. P. Rabbitt, A. Hales, M. Burke. Household food security in the United States in 2024. USDA Economic Research Service, 2025, https://www.ers.usda.gov/publications/pub-details?pubid=113622. [↩]
- S. Waxman, P. Gupta, M. Karpman. Households faced persistent challenges affording food in 2024. Urban Institute, 2025, https://www.urban.org/research/publication/households-faced-persistent-challenges-affording-food-2024. [↩]
- J. Beaulac, E. Kristjansson, S. Cummins. A systematic review of food deserts, 1966-2007. Preventing Chronic Disease. Vol. 6, pg. A105, 2009. [↩]
- R. E. Walker, C. R. Keane, J. G. Burke. Disparities and access to healthy food in the United States: a review of food deserts literature. Health & Place. Vol. 16, pg. 876-884, 2010, https://doi.org/10.1016/j.healthplace.2010.04.013. [↩]
- V. Reisig, A. Hobbiss. Food deserts and how to tackle them: a study of one city’s approach. Health Education Journal. Vol. 59, pg. 137-149, 2000, https://doi.org/10.1177/001789690005900203. [↩]
- N. I. Larson, M. T. Story, M. C. Nelson. Neighborhood environments: disparities in access to healthy foods in the U.S. American Journal of Preventive Medicine. Vol. 36, pg. 74-81, 2009, https://doi.org/10.1016/j.amepre.2008.09.025. [↩]
- A. Hilmers, D. C. Hilmers, J. Dave. Neighborhood disparities in access to healthy foods and their effects on environmental justice. American Journal of Public Health. Vol. 102, pg. 1644-1654, 2012, https://doi.org/10.2105/AJPH.2012.300865. [↩]
- S. N. Zenk, A. J. Schulz, B. A. Israel, S. A. James, S. Bao, M. L. Wilson. Neighborhood racial composition, neighborhood poverty, and the spatial accessibility of supermarkets in metropolitan Detroit. American Journal of Public Health. Vol. 95, pg. 660-667, 2005, https://doi.org/10.2105/AJPH.2004.042150. [↩]
- M. Franco, A. V. Diez Roux, T. A. Glass, B. Caballero, F. L. Brancati. Neighborhood characteristics and availability of healthy foods in Baltimore. American Journal of Preventive Medicine. Vol. 35, pg. 561-567, 2008, https://doi.org/10.1016/j.amepre.2008.07.003. [↩]
- K. Morland, S. Wing, A. Diez Roux, C. Poole. Neighborhood characteristics associated with the location of food stores and food service places. American Journal of Preventive Medicine. Vol. 22, pg. 23-29, 2002, https://doi.org/10.1016/S0749-3797(01)00403-2. [↩]
- C. Gundersen, J. P. Ziliak. Food insecurity and health outcomes. Health Affairs. Vol. 34, pg. 1830-1839, 2015, https://doi.org/10.1377/hlthaff.2015.0645. [↩]
- H. K. Seligman, B. A. Laraia, M. B. Kushel. Food insecurity is associated with chronic disease among low-income NHANES participants. Journal of Nutrition. Vol. 140, pg. 304-310, 2010, https://doi.org/10.3945/jn.109.112573. [↩]
- S. A. Berkowitz, H. K. Seligman, N. K. Choudhry. Treat or eat: food insecurity, cost-related medication underuse, and unmet needs. American Journal of Medicine. Vol. 127, pg. 303-310, 2014, https://doi.org/10.1016/j.amjmed.2014.01.002. [↩]
- C. Gundersen, B. Kreider, J. V. Pepper. The impact of the National School Lunch Program on child health: a nonparametric bounds analysis. Journal of Econometrics. Vol. 166, pg. 79-91, 2012, https://doi.org/10.1016/j.jeconom.2011.06.007. [↩]
- A. Coleman-Jensen, M. P. Rabbitt, C. A. Gregory, A. Singh. Household food security in the United States in 2018. USDA Economic Research Service, Economic Research Report No. ERR-270, 2019. [↩] [↩] [↩]
- M. Ver Ploeg, V. Breneman, T. Farrigan, K. Hamrick, D. Hopkins, P. Kaufman, B. Lin, M. Nord, T. A. Smith, R. Williams, K. Kinnison, C. Olander, A. Singh, E. Tuckermanty. Access to affordable and nutritious food: measuring and understanding food deserts and their consequences. USDA Economic Research Report No. 36, 2009, https://doi.org/10.22004/ag.econ.56339. [↩]
- B. E. Flanagan, E. W. Gregory, E. J. Hallisey, J. L. Heitgerd, B. Lewis. A social vulnerability index for disaster management. Journal of Homeland Security and Emergency Management. Vol. 8, 2011, https://doi.org/10.2202/1547-7355.1792. [↩] [↩]
- C. Noelke, N. McArdle, M. Baek, N. Huntington, R. Huber, E. Hardy, D. Acevedo-Garcia. Child Opportunity Index 2.0 technical documentation. Diversitydatakids.org, 2020. [↩] [↩]
- Y. Ruan, J. W. Grigsby, A. C. Smith. Optimizing food bank placement to reduce food insecurity using spatial and machine learning methods. Computers, Environment and Urban Systems. Vol. 103, pg. 101-115, 2024, https://doi.org/10.1016/j.compenvurbsys.2023.101983. [↩]
- J. Lentz, S. Fanzo, C. Hawkes. The changing landscape of food insecurity measurement and policy. Nature Food. Vol. 6, pg. 112-118, 2025, https://doi.org/10.1038/s43016-025-01267-z. [↩]
- H. Lee, C. Gundersen. Probability-based measurement of food insecurity using longitudinal survey data. Journal of Economic and Social Measurement. Vol. 50, pg. 45-67, 2025, https://doi.org/10.3233/JEM-230512. [↩]
- P. Apparicio, M. Abdelmajid, M. Riva, R. Shearmur. Comparing alternative approaches to measuring the geographical accessibility of urban health services: distance types and aggregation-error issues. International Journal of Health Geographics. Vol. 7, 2008, https://doi.org/10.1186/1476-072X-7-7. [↩]
- L. W. Morton, T. C. Blanchard. Starved for access: life in rural America’s food deserts. Rural Realities. Vol. 1, pg. 1-10, 2007. [↩]
- M. Marmot, R. G. Wilkinson. Social determinants of health. Oxford University Press, 2006. [↩] [↩] [↩]
- N. Krieger. Theories for social epidemiology in the 21st century: an ecosocial perspective. International Journal of Epidemiology. Vol. 30, pg. 668-677, 2001, https://doi.org/10.1093/ije/30.4.668. [↩]


