
Abstract
Galaxy M33, a close neighbor of the Milky Way, exhibits measurable variations in its velocity structure that provide insight into its internal dynamics and mass distributions. This study analyzes HI 21-cm spectral image cube data of M33 using SAOImage DS9, an astronomical image visualization tool for inspecting and analyzing FITS image and spectral data cubes, along with Python-based computational methods. The spectral cube includes a velocity axis, allowing motion to be examined across the galaxy’s spatial dimensions with greater precision than traditional two-dimensional imagery. Because M33 is not oriented perfectly face-on, observed velocities appear as line-of-sight projections rather than true rotational motion. To address this, inclination corrections were applied using measurements derived from the data, improving the interpretation of the galaxy’s velocity field. The resulting velocity structure shows a rising rotational trend near the center and sustained velocities at larger radii, consistent with previously published rotation curves of M33. The velocity distributions align with Doppler-shift expectations, and the observed behavior at large radii is consistent with established evidence for dark matter in spiral galaxies. While the outer disk shows mild irregularities that may suggest structural distortions such as warps, these features are interpreted qualitatively. Overall, this study reproduces key kinematic features of M33 and demonstrates a reproducible approach for analyzing galactic dynamics using spectral image cubes.
Keywords: M33, rotation curve, dark matter, spectral image cubes, inclination correction
Introduction
M33 is a nearby spiral galaxy whose motions reveal its internal structure and mass distribution. By studying how galaxies move, we can learn about their structure, mass, and the forces that shape them. The goal of this study is to analyze the rotational dynamics and mass distribution of M33 by examining HI 21-cm spectral image cube data and applying inclination corrections to derive an accurate galactic rotation curve. We specifically investigate whether inclination-corrected velocity measurements derived from HI spectral cube data reproduce the known rotational behavior and dark matter signatures of M33 reported in previous studies. M33’s properties and its role within the Local Group have also been discussed in broader studies of nearby dwarf and spiral galaxies1. To understand what is happening in M33, we must look at how waves behave and how light changes when objects move. When something moves, it affects the waves it emits.
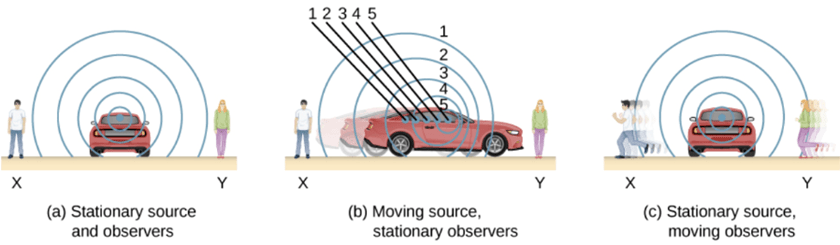
In sound, this effect is easy to observe waves become compressed in front of a moving source and stretched behind it, as shown in Figure 1. Light behaves in a similar way. When a galaxy moves toward the observer, its light shifts toward shorter wavelengths (blueshift), while motion away causes a shift toward longer wavelengths (redshift). This phenomenon, known as the Doppler Effect, allows astronomers to measure velocities along the line of sight, and is commonly expressed as
(1) 
where △λ is the wavelength shift, λ0 is the rest wavelength, ν is the line-of-sight velocity, and c is the speed of light. Equation 1 is later applied to interpret the velocity structure in M33.
This effect becomes especially useful when observing changes along the line of sight, where spatial differences in velocity cause measurable shifts in spectral lines. Such shifts, interpreted through the Doppler Effect, form the foundation for understanding galactic motion3.
Galaxy M33 and its motion provide key insights into its rotation, mass distribution, and the role of dark matter. M33’s velocity structure has been mapped using spectral image cubes, a tool that lets astronomers see galaxy motion in 3D.
Traditional images are flat, but spectral cubes add a third axis — velocity — allowing astronomers to track the movement across different regions of the galaxy. Such kinematic analyses using spectral and radio observations have been widely applied in studies of nearby galaxies, including M334,5,6. Studies such as Corbelli and Salucci7, Sofue8, Kam et al.3, Putman et al.9, McConnachie et al.1, and Druard et al.10 have used this method to reveal M33’s rotational behavior and how dark matter influences its motion.
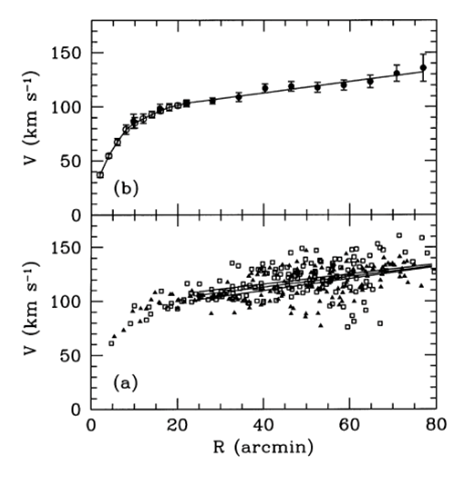
According to Kepler’s law, objects should orbit more slowly as they get farther from the center of mass. However, as shown in Figure 2, the rotation curve of M33 derived from H i observations remains constant beyond ~30 arcmin, rather than declining as expected. This deviation from Keplerian motion provides compelling evidence for the presence of dark matter,11,12,13, which exerts additional gravitational influence on the galaxy’s outer regions11,14. Several studies have examined how both visible and dark matter contribute to shaping M33’s rotation curve15,16. Another challenge in analyzing M33’s motion is its tilt; because the galaxy is not face-on, the velocities we observe are projections along the line of sight, which must be corrected to obtain an accurate interpretation.
Correcting this inclination is crucial to getting accurate velocity measurements. Several studies have examined how inclination affects observations and how spectral cubes help correct for these distortions. Using spectral imaging and visualization tools such as DS9, this research refines understanding of M33’s motion. Studying its velocity structure helps us understand how this galaxy behaves and contributes to the broader picture of galaxies’ evolution and their interactions with dark matter in the universe.
Rotation curves, derived from observed velocities, are compared to the prediction of Keplerian motion. If only visible matter, stars farther from the center should orbit more slowly. However, in M33, the rotational speed remains relatively constant even at large radii, suggesting the influence of an unseen mass component known as dark matter. Early observational evidence for flat rotation curves that deviate from Keplerian expectations in low-surface-brightness galaxies and similar systems, such as M33, was provided by de Blok and McGaugh11.
Data Analysis
Data
The primary tool used for data collection and visualization was DS9, an astronomy image visualization software. DS9 was employed to manage and manipulate spectral image cubes of the Triangulum Galaxy (M33), enabling detailed exploration of its spatial and velocity properties. Spectral image cubes, which provide a three-dimensional representation of the galaxy’s light across spatial dimensions (x and y) and the velocity dimension (z), are ideal for studying gas dynamics. These cubes allowed for an in-depth examination of the kinematic properties of M33, facilitating the analysis of velocity variations across its structure17. Computational analysis was performed by extracting velocity axes from the FITS headers followed by programmatic manipulation using Astropy, NumPy, and Matplotlib. These tools enable cube slicing, velocity calibration, and spectral fitting to extract physical parameters from the raw data. Elliptical apertures were applied to the Moment 1 velocity map (intensity-weighted mean velocity; see Methods) to isolate the rotational structure at increasing radii. This masking technique reduces noise from low-emission regions and ensures that only H i gas belonging to the disk contributes to the velocity measurements. After masking low-intensity noise regions, the moment maps were computed to ensure reliable velocity measurements.
Velocity Measurements
For analysis of the galaxy’s velocity structure, this study utilized Python software to generate Moment 0 and Moment 1 maps and a Position-Velocity Diagram (PVD).
Moment 0 Map
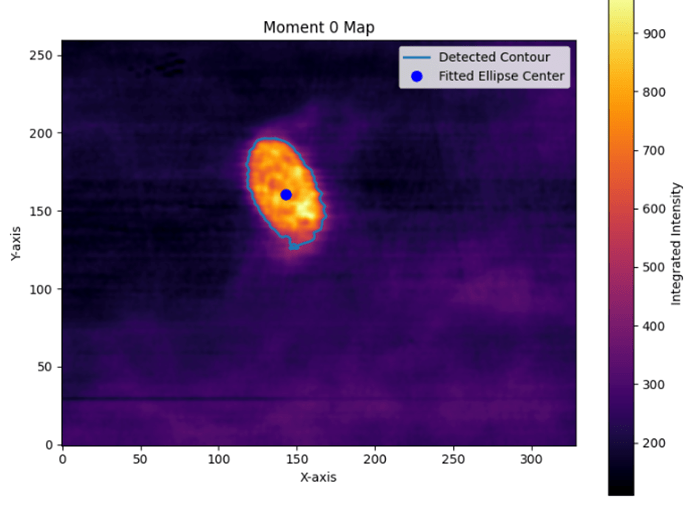
As shown in Figure 3, the integrated intensity distribution of M33 which presents the Moment 0 map derived by summing the spectral cube along the velocity (z) axis. This two-dimensional projection highlights the regions where atomic gas is most concentrated, particularly in the central regions and along the spiral arms. These high-intensity areas trace the dense structures within the galactic disk, while the declining brightness toward the outskirts reflects the natural drop in gas density. The distribution of atomic and molecular gas in M33 has also been extensively studied, providing important context for interpreting velocity structures18,19,20,21.
Moment 1 Map
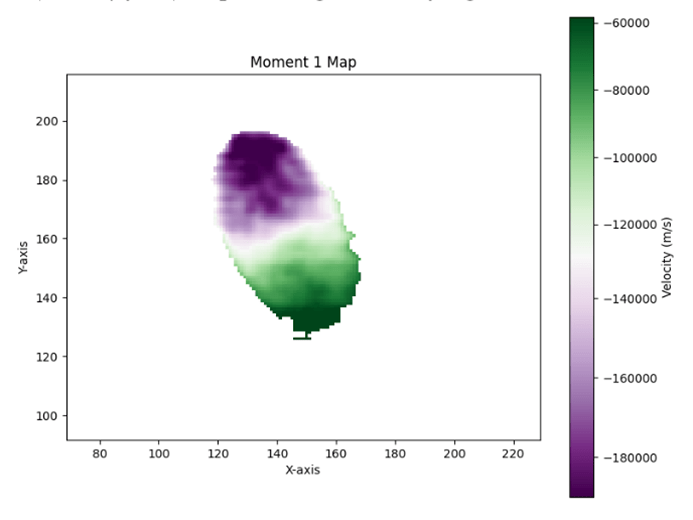
As shown in Figure 4, the velocity field of M33 was obtained from the Moment 1 map, which computes the intensity-weighted mean velocity at each spatial position. As shown in the Figure 4, one side of the disk exhibits blue-shifted velocities while the opposite side shows red-shifted motion – a clear signature of galactic rotation. This symmetric gradient provides a direct visualization of M33’s kinematics and forms the foundation for constructing its rotation curve.
Position Velocity Diagram
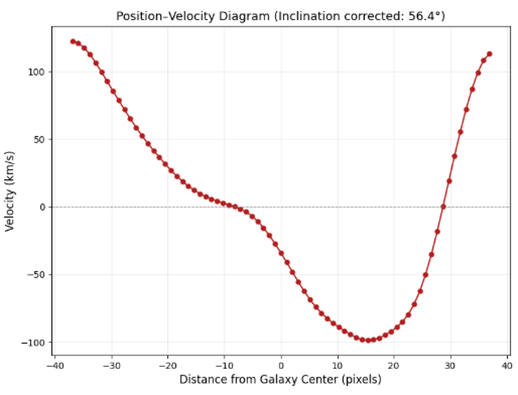
These visualizations reveal M33’s rotation: one side of the disk is blue shifted and the other is red shifted. The Position-Velocity Diagram additionally identifies possible warps or non-circular motions. As shown in Figure 5, the kinematic structure of M33 along a selected axis is illustrated by the Position-Velocity Diagram (PVD). This diagram plots velocity as a function of spatial position, revealing how gas on either side of the galactic center moves at equal but opposite velocities due to rotation. As shown in Figure 5, the PVD exposes both the rising inner rotation and the nearly constant outer velocities, which together help trace the galaxy’s rotation curve. As seen in Figure 5, subtle irregularities and asymmetries – features that may indicate non-circular motions, warps, or disturbances influenced by the underlying mass distribution, including dark matter. Because it provides a clean cross-section of the galaxy’s kinematics, the PVD serves as a critical diagnostic tool for analyzing galactic dynamics and mass structure.
Inclination and Error Analysis
One of the primary challenges in this analysis was the inclination of M33. Since the galaxy is not perfectly face-on, the velocity measurements observed in the spectral cubes are a projection of the galaxy’s proper motion. This inclination distorts the true motion, leading to underestimated line-of-sight velocities. To correct this, a mathematical model was applied to adjust the observed velocities, taking into account the galaxy’s tilt. The inclination angle was calculated by fitting an ellipse to the 50% intensity contour of the Moment 0 map using skimage.measure. EllipseModel, which used the ratio b/a to compute the angle as yielded an inclination angle of 56.4 . The corrected velocity field was then obtained by dividing the observed velocities by cos(l), allowing for de-projection of the line-of-sight component. While this correction helps refine the velocity measurements, it also introduces potential errors. Minor discrepancies may arise in the corrected velocity field due to uncertainties in the ellipse fit, particularly in asymmetric or low-signal regions. Nonetheless, the inclination correction is essential for obtaining a more accurate and realistic view of M33’s kinematics, particularly in studying its dark matter distribution.
Software and Tools Used
The spectral cube data originated from HI observations conducted using the Arecibo Observatory, specifically as documented in9. These data were accessed in FITS format, a standard format for storing multidimensional arrays of scientific data. Visualization and manipulation of the cube were performed using DS9. Python libraries, including Astropy, as documented in Robitaille et al22, NumPy, and Matplotlib, were employed to parse FITS headers, calibrate the velocity axis, and produce scientific plots such as Moment maps and Position-Velocity Diagrams—the skimage.measure.The EllipseModel class was used to estimate inclination by fitting ellipses to the intensity contours of the Moment 0 map, providing a geometric basis for de-projecting the observed velocities.
Methods
All data processing and analysis were performed using Python, with key libraries including Astropy, as documented in Robitaille et al22, NumPy, SciPy, Matplotlib, and scikit-image. The analysis workflow includes spectral cube calibration, moment map generation, Gaussian fitting, inclination correction, and PVD construction. These steps are described in sufficient detail to allow reproduction of the analysis using the same publicly available dataset.
The Data Analysis section provides an overview of the processing steps and tools used, while the Methods section presents a more detailed and structured description of the analysis pipeline and mathematical formulations.
Data Acquisition and Preparation
The data used in this study were sourced from a FITS (Flexible Image Transport System) file containing a spectral image cube of the Triangulum Galaxy (M33). The cube consists of three axes: right ascension (x), declination (y), and spectral channels (z), with the spectral axis corresponding to velocity along the line of sight. The cube was accessed and loaded using the astropy.io.fits module in Python.
To calibrate the spectral (velocity) axis, the FITS header keywords CRVAL3 (reference velocity for the spectral axis), CDELT3 (velocity increment per channel), and CRPIX3 (reference pixel for velocity mapping) were extracted. Using these, the velocity for each spectral index i was calculated with the linear transformation
(2) 
This conversion allows for an accurate physical interpretation of the velocity structure across the data cube.
Dataset Properties
The HI spectral cube of M33 used in this study was obtained from Arecibo observations as presented in9. The data are provided in FITS format and include spatial dimensions (right ascension and declination) along with a spectral axis corresponding to radial velocity. The velocity axis was calibrated using standard FITS header parameters (CRVAL3, CDELT3, CRPIX3), resulting in a velocity range of approximately -250 to +250 kms-1 with a channel width of ~5kms-1. The spatial resolution of the dataset is determined by the telescope beam size, and the cube covers the full extent of the M33 disk. These parameters provide the necessary observational context for interpreting the velocity structure and ensure reproducibility of the analysis.
Moment Map Generation
Two-dimensional moment maps were computed to extract physical and kinematic properties from the data cube.
Moment 0 Map (Integrated Intensity)
The Moment 0 map was generated by summing the flux over all velocity channels, representing the total emission intensity at each spatial location. It serves as a proxy for the gas surface density within the galaxy. The equation used is
(3) 
in which M0(x,y) is the integrated intensity at pixel(x,y),and Ii(x,y) is the intensity at the channel i and position.
Moment 1 Map (Intensity-Weighted Mean Velocity)
The Moment 1 map was computed as the intensity-weighted average of the velocity at each spatial location, providing a two-dimensional velocity field of the galaxy
(4) 
in which vi is the velocity at the channel i,and Ii(x,y) is the intensity at that velocity and position.
Velocity Offset Fitting
Gaussian fitting was performed along the spectral axis at each spatial pixel using the fit_velocity_offsets function in combination with scipy.optimize.curve_fit to obtain detailed local velocity measurements. The Gaussian function fitted to each spectrum is defined as
(5) 
in which  the amplitude (peak intensity), μ the central velocity (mean), and σ the velocity dispersion (standard deviation).
Initial parameter estimates were determined from the peak intensity and corresponding velocity channel of each spectrum. Fitting was restricted to velocity ranges where emission exceeded the background noise level to reduce the influence of noise.
The parameter μ from the fitted profile was stored as the local velocity offset at that spatial location. Fits that failed to converge or returned nonphysical parameter values were classified unsuccessful and recorded as NaN. The fitting procedure was successful for approximately ~90% of pixels within the main disk region, with failures primarily occurring in low signal-to-noise regions.
Inclination Estimation and Correction
The inclination angle of the galaxy was estimated by fitting an ellipse to the 50% intensity contour level of the Moment 0 map using the Ellipse Model class from skimage.measure. The shape of the ellipse gives insight into the galaxy’s tilt relative to the observer. The inclination angle l is derived from the ratio of the semi-minor axis b to the semi-major axis a of the ellipse.
Uncertainty Estimates
The inclination angle derived from ellipse fitting is estimated to be 56.4 3 accounting for uncertainties in the contour fitting process. Typical velocity uncertainties are on the order of ~5 – 10 kms-1, particularly in regions of lower signal-to-noise. These uncertainties may introduce small variations in the corrected velocity field but do not significantly alter the overall rotational trends observed in the galaxy.
(6) 
In this analysis, the calculated inclination angle was 56.4
The inclination was used to geometrically correct the velocity offsets, as the observed velocities are projections of the actual rotational velocities. The corrected velocities are given by
(7) 
Additionally, velocities were converted from m/s to km/s for astrophysical relevance.
(8) 
Position-Velocity Diagram (PVD) Construction
A Position-Velocity Diagram (PVD) was constructed using the inclination-corrected velocity map. The x-axis of the PVD represents the projected distance from the galaxy center (in pixels), and the y-axis shows the inclination-corrected velocity in km/s.
To ensure that only meaningful velocities within the galaxy disk were used, an elliptical mask was applied based on the fitted ellipse parameters. The mask follows the equation of a rotated ellipse centered at ( ).
).
(9) 
This ensured that only pixels within the galaxy’s projected disk were included in the PVD.
Results
Moment Maps
The Moment 0 map revealed the integrated intensity distribution across M33, highlighting the concentration of emission near the central regions and along the spiral arms. This distribution corresponds to dense region of atomic gas, consistent with the known structure of M33’s disk. Lower-emission regions were observed in the outer regions, reflecting the natural decrease in gas density with an increasing radius.
The Moment 1 map visualizes the velocity field of M33. A clear rotational pattern emerged, with one side of the galaxy exhibiting blue-shifted velocities (approaching motion) and the opposite side exhibiting red-shifted velocities (receding motion). This symmetric gradient is consistent with previous studies of M333,15,17,6 and supports its classification as a rotating disk galaxy. Minor asymmetries on the map may indicate local non-circular motions or small-scale turbulence.
Gaussian Velocity Fitting
Gaussian profiles were fitted to the spectral data at each spatial pixel using the scipy.optimize.curve_fit function. Initial parameter estimates were determined from the peak intensity and corresponding velocity channel of each spectrum. Fitting was restricted to velocity ranges where emission exceeded the background noise level to reduce the influence of noise. Fits that failed to converge or returned nonphysical parameter values were classified as unsuccessful and recorded as NaN. The fitting procedure was successful for approximate ~ 90% of pixels within the main disk region. Failed fits were primarily located in low signal-to-noise regions at larger radii and did not significantly affect the overall velocity structure. The resulting velocity offset map is consistent with the Moment 1 map and provides a more localized view of the velocity field, particularly in regions with strong emissions. The distribution of fitted central velocities across the galaxy is consistent with previously reported rotational patterns and served as the basis for Position-Velocity analysis.
Position-Velocity Diagram (PVD)
The Position-Velocity Diagram (PVD), constructed along the projected major axis of the galaxy, as determined from the fitted ellipse to the Moment 0 map, showed a pattern of lines rising and falling, indicating different velocity sets emitted on both sides of the galaxy. These features arise from the 21-cm HI emission line, shifted in velocity due to the Doppler effect. This trend reflects the Doppler-shifted velocities of the rotating gas: near the galaxy center, velocities are close to the systemic velocity (in kms-1), while at greater distances, gas on either side of the center moves at high but opposite velocities due to disk rotation.
After correcting M33’s inclination 56.4, the outer velocities in the PVD, the velocities remained elevated (in kms-1) instead of declining as would be expected under the Keplerian dynamics. Environmental effects, including gas accretion and high-velocity cloud interactions, may also influence the outer regions of galaxies like M3323,24,25,26. This plateauing of rotational velocity at large radii is consistent with the well-established signature of dark matter observed in spiral galaxies. Rather than declining as expected under purely Keplerian motion, the sustained velocities align with previously published rotation curves of M33, which indicate that visible mass alone cannot fully account for the observed dynamics.
While a full rotation curve (velocity vs. radius) is not explicitly derived in this study, the position-velocity structure and velocity field are qualitatively consistent with previously published rotation curves of M33.
These results are consistent with earlier studies of M33’s rotation and demonstrate that combining inclination correction, spectral fitting, and moment analysis can successfully reproduce its known kinematic structure. These kinematic features and outer-disk behaviors are broadly consistent with a wide range of observational and theoretical studies of M33 and similar spiral galaxies4,12,27,28,6,18,13,29,5,19,20,21,23,25,26.
Conclusion
This study presents a kinematic analysis of the Triangulum Galaxy (M33) using HI 21-cm spectral image cube data and inclination-correction techniques. The resulting velocity field and position-velocity structure are consistent with previously published rotation curves, showing sustained rotational velocities at large radii that align with the presence of a dark matter halo. Rather than introducing a new mass model, this work reproduces and supports well-established evidence for dark matter in M33 through a transparent and reproducible analysis pipeline. The combined use of Moment maps, Gaussian profile fitting, and Position-Velocity Diagram demonstrates how standard kinematic techniques can be applied to recover known galactic dynamics from publicly available data. Several limitations should be noted. The use of a single global inclination correction, uncertainties in Gaussian fitting in low signal-to-noise regions, and the choice of axis for the Position-Velocity Diagram may introduce systematic uncertainties in the derived velocity structure. Future work could improve these results by incorporating spatially varying inclination models, more robust error qualification, and multi-wavelength observations to better constrain the mass distribution. The derived inclination of approximately 56.4 and sustained outer velocities are consistent with previously reported values for M33.
References
- A. W. McConnachie. The observed properties of dwarf galaxies in and around the Local Group. The Astronomical Journal. Vol. 144, no. 1, p. 4, 2012. [↩] [↩]
- OpenStax. University Physics Volume 1. Rice University, 2016. [↩]
- S. Z. Kam et al. H I kinematics and mass distribution of Messier 33. The Astronomical Journal. Vol. 154, no. 2, p. 41, 2017. [↩] [↩] [↩]
- K. G. Begeman. HI rotation curves of spiral galaxies. Astronomy & Astrophysics. Vol. 223, pp. 47–60, 1989. [↩] [↩]
- L. Chemin, C. Carignan, and T. Foster. H I kinematics and dynamics of M33. Monthly Notices of the Royal Astronomical Society, 2009. [↩] [↩]
- F. S. Tabatabaei et al. High-resolution radio continuum survey of M33. Astronomy & Astrophysics. Vol. 490, pp. 1005–1017, 2008. [↩] [↩] [↩]
- E. Corbelli and P. Salucci. The extended rotation curve and the dark matter halo of M33. Monthly Notices of the Royal Astronomical Society. Vol. 311, no. 2, pp. 441–447, 2000. [↩] [↩]
- Y. Sofue and V. Rubin. Rotation curves of spiral galaxies. Annual Review of Astronomy and Astrophysics. Vol. 39, pp. 137–174, 2001. [↩]
- M. E. Putman et al. The disruption and fueling of M33. The Astrophysical Journal. Vol. 703, no. 2, pp. 1486–1501, 2009. [↩] [↩] [↩]
- C. Druard et al. The IRAM M33 CO(2–1) survey: A complete census of the molecular gas in M33. Astronomy & Astrophysics. Vol. 567, A118, 2014. [↩]
- W. J. G. de Blok and S. S. McGaugh. The dark and visible matter content of low surface brightness disk galaxies. Monthly Notices of the Royal Astronomical Society. Vol. 290, pp. 533–552, 1997. [↩] [↩] [↩]
- W. J. G. de Blok et al. High-resolution rotation curves and galaxy mass models. The Astronomical Journal. Vol. 136, pp. 2648–2719, 2008. [↩] [↩]
- R. A. Swaters et al. The rotation curve shapes of late-type dwarf galaxies. Astronomy & Astrophysics. Vol. 493, pp. 871–892, 2008. [↩] [↩]
- E. Corbelli. Dark matter and visible baryons in M33. Monthly Notices of the Royal Astronomical Society. Vol. 342, no. 1, pp. 199–207, 2003. [↩]
- L. Chemin, C. Carignan, and T. Foster. HI kinematics and dynamics of Messier 33. The Astronomical Journal. Vol. 132, no. 6, pp. 2527–2544, 2006. [↩] [↩]
- E. Corbelli, D. Thilker, S. Zibetti, C. Giovanardi, and P. Salucci. Dynamical signatures of a ΛCDM halo and the distribution of baryons in M33. Astronomy & Astrophysics. Vol. 572, A23, 2014. [↩]
- E. Corbelli et al. Extended H I disk and kinematics of M33. Astronomy & Astrophysics. Vol. 511, A89, 2009. [↩] [↩]
- A. Schruba et al. The scale dependence of the molecular gas depletion time in M33. The Astrophysical Journal, 2010. [↩] [↩]
- E. Rosolowsky et al. Molecular gas and GMC properties in M33. Monthly Notices of the Royal Astronomical Society, 2021. [↩] [↩]
- S. Verley et al. Star formation in M33: Multiwavelength signatures. Astronomy & Astrophysics. Vol. 488, pp. 115–123, 2008. [↩] [↩]
- S. Verley et al. Star formation in M33: Radial relations with gas. Astronomy & Astrophysics, 2009. [↩] [↩]
- T. P. Robitaille et al. Astropy: A community Python package for astronomy. Astronomy & Astrophysics. Vol. 558, A33, 2013. [↩] [↩]
- M. E. Putman et al. Gas accretion and outer disk structure in M33. The Astrophysical Journal, 2009. [↩] [↩]
- T. Westmeier et al. High-velocity clouds and gaseous environment of nearby galaxies. Astronomy & Astrophysics, 2005. [↩]
- T. Westmeier et al. High-velocity clouds around nearby galaxies. Publications of the Astronomical Society of Australia, 2007. [↩] [↩]
- O. Müller et al. Dwarf galaxy populations around low-mass spirals. Astronomy & Astrophysics, 2020. [↩] [↩]
- A. W. McConnachie et al. The stellar halo and outer disk of M33. The Astrophysical Journal Letters. Vol. 647, L25, 2006. [↩]
- M. Grossi et al. Stellar structures in the outer regions of M33. Astronomy & Astrophysics. Vol. 527, A82, 2011. [↩]
- K. M. Gilbert et al. The TREX survey. The Astrophysical Journal. Vol. 924, p. 116, 2022. [↩]

 and Fluoroform (CHF3) using Molecular Dynamics")
