
Abstract
Since 2018, the US Centers for Disease Control and Prevention has recommended adolescents aged 6 to 17 years engage in ≥60 minutes of moderate to vigorous physical activity (MVPA) daily. However, the proportion of adolescents who meet these recommendations is low. I utilize nationally representative data from over 20,000 high-school students surveyed in the 2023 Youth Risk Behavior Survey. I assessed whether the proportion of adolescents meeting physical activity recommendations varied by socio-demographic, school, psychological, nutritional, and health characteristics. I fit a weighted logistic regression model; the outcome was ≥60 minutes of MVPA on ≥5 days per week. All estimates are survey-weighted and account for the complex sampling design. First, the overall prevalence of ≥60 minutes of MVPA on ≥5 days per week among teens was 46%. Second, the proportion of adolescents who reported ≥60 minutes of MVPA on ≥5 days per week peaked at age 15. Third, the odds of ≥60 minutes of MVPA on ≥5 days per week was 2.33 times higher for males than for females accounting for other characteristics (95% confidence interval [CI]: 2.03-2.67). Fourth, the odds of ≥60 minutes of MVPA on ≥5 days per week, accounting for these characteristics, decreased as students’ academic performance decreased. For example, compared to students who earned mostly A’s, the odds decreased with lower grades (e.g., adjusted odds ratio 0.83; 95% CI: 0.71-0.97 for mostly B students). School curriculum could better emphasize the benefits of exercising and identify strategies to build more physical activity throughout the day. In conclusion, greater physical activity during adolescence can build lasting healthy habits that carry into adulthood.
Keywords: Physical activity, Adolescents, Mental health, Academic performance.
Introduction
Since 2018, the US Centers for Disease Control and Prevention (CDC) has recommended that adolescents aged 6 to 17 years engage in ≥60 minutes of moderate to vigorous physical activity (MVPA) daily1. However, the proportion of adolescents who meet these recommendations is low2. Between 2021 and 2023, for example, 39% of adolescents did not report MVPA most days or every day3. Additionally, there are significant differences across sex, race, and other socio-demographic factors in the frequency of MVPA. For example, 35.5% of males, compared to 17.5% of females, reported ≥60 minutes of physical activity 7 days per week4. Furthermore, Hispanic, Black, and Asian students were physically active on fewer days per week compared to White students5. Specifically, Pontes et al. found that the proportions of White males who reported ≥60 minutes of MVPA on ≥5 days per week and all 7 days per week were both higher than their Black and Hispanic counterparts and likewise for White females between 2011 and 20176. Pontes et al. also found the proportions who reported ≥60 minutes of MVPA on ≥5 days per week and all 7 days per week decreased with increasing high school grade levels. For example, 61.8% of ninth grade males and 43.7% of ninth grade females engaged in ≥5 days of physical activity per week, but only 53.8% of twelfth grade males and 33.0% of twelfth grade females did so6.
Health behaviors in adolescence often do not occur independently. Adolescents who maintain healthier dietary habits are also more likely to engage in regular physical activity. For example, students who participated in recommended levels of daily fruit and vegetable consumption were more likely to engage in daily physical activity7. For example, Lowry et al. found that over half (57.8%) of US high school students who ate fruits ≥2 times per day were also physically active for ≥60 minutes on all 7 days per week.
Various studies identify the mental health and physical health benefits associated with physical activity, such as lower rates of suicidal ideation8,9,10 and depression11,12, improved memory13, more activity in adulthood14, decreased sedentary behavior15, decreased feelings of loneliness16,17, potential assistance in coping with violence18, and boosted academic performance19,20. Despite these benefits, adolescents often face difficulties in achieving the recommended level of physical activity. Some students struggle to reach the recommendations because they have minimal time due to academics and extracurriculars21. Other limiting factors include lack of financial support, transportation, or parental emphasis on fitness; poor facilities; safety concerns; low confidence; or lack of understanding of the benefits of physical activity22.
Although socio-demographic factors are known to affect the likelihood of MVPA among older adolescents, it is unclear whether school performance is also associated with this likelihood. Academic performance and physical activity may also be related through broader patterns of student engagement and lifestyle behaviors. Previous studies have reached different conclusions regarding the association between school performance and MVPA. For example, Sibley et al. and Tomporowski both found a positive association between school performance and physical activity23,24. In contrast, Tremblay et al. and Huang et al. found an inverse relationship between academic performance and physical activity25,26. Moreover, Daley et al. and Kalantari et al. found no significant association between academic performance and physical activity27,28. Additionally, I do not know whether the race/ethnic-, sex-, and school grade-based differences observed between 2011 and 2017 (i.e., before the COVID-19 pandemic) by Pontes et al. continued after the pandemic. Finally, Merlo et al. (2020) assessed differences in the prevalence of MVPA all 7 days per week by sex and race. Although MVPA on all 7 days per week is the ideal recommendation, 5 or more days of MVPA per week has been shown to also confer physical and mental health benefits among adolescents and adults29,30,31,32,33. Thus, I do not yet know whether differences similarly exist across these socio-demographic characteristics for this less stringent, though beneficial, goal of MVPA.
Using nationally representative data from over 20,000 high-school students surveyed in 2023, this study assesses whether the proportion of adolescents meeting physical activity recommendations varies by socio-demographic, school, psychological, nutritional, and health characteristics. I hypothesize that male adolescents will be more likely to engage in ≥60 minutes of MVPA on ≥5 days per week than females, and that the likelihood of ≥60 minutes of MVPA on ≥5 days per week will increase with improved academic performance.
Methods
Data
The 2023 Youth Risk Behavior Survey (YRBS), collected by the CDC, gathered a nationally representative sample of high-school students (grades 9 through 12) by implementing a three-stage cluster sampling method. The intended survey population included all students in these grade levels from public, parochial, or private schools. To account for the larger proportion of Black and Hispanic students sampled, as well as students who did not respond, a weighting factor was applied. The weights were adjusted so that the overall number of students remained the same, and the number of students in each grade aligned with what was expected for that year. The survey had N=20,103 respondents.
In accordance with published literature,6,11,34,35, I used ≥60 minutes of MVPA on ≥5 days per week as my outcome for adequate weekly physical activity.. The outcome was based on the following survey question: “During the past 7 days, on how many days were you physically active for a total of at least 60 minutes per day? (Add up all the time you spent in any kind of physical activity that increased your heart rate and made you breathe hard some of the time.)”. Students could respond with any number of days between zero and seven inclusively. The outcome was made binary by setting all students who reported 4 or fewer days of physical activity to 0, and students who reported ≥5 days of physical activity to 1. This categorization allowed me to calculate the proportion of students who reported ≥60 minutes of MVPA on ≥5 days per week.
Covariates spanned numerous socio-demographic, nutritional, psychological, health-related, and school-related characteristics. Socio-demographic covariates included age, sex, and race/ethnicity. Nutritional covariates included reporting daily fruit consumption, daily green salad consumption, and daily soda consumption. Psychological covariates included reporting feeling sad or hopeless most days for two weeks or more in a row in the last year, and reporting seriously considering attempting suicide in the last year. Health-related covariates included body mass index (BMI) and average duration of sleep on a school night. School-related characteristics included academic performance (as measured by school letter grades) and weekly PE classes. See Appendix Table 1 for details on survey questions and levels of each covariate.
The YRBS assigned each respondent a sampling weight based on sex, race/ethnicity, and grade level to account for the nonresponse of students and the oversampling of Black and Hispanic students. The weights were scaled so that the weighted count of students aligned with the sample size and grade-level proportions aligned with the national population, to ensure the data represented US students in grades 9-12 across both public and private schools.
Methods. First, I calculated the distribution of the sample by socio-demographic, nutritional, psychological, health-related, and school-related characteristics. Second, I estimated the weighted prevalence of ≥60 minutes of MVPA on ≥5 days per week by each covariate. Third, I fit a weighted logistic regression model. The binary outcome of interest was ≥60 minutes of MVPA on ≥5 days per week. Covariates included age, sex, race/ethnicity, BMI quartile, daily fruit consumption, daily salad consumption, daily soda consumption, weekly PE classes, academic performance, suicidal ideation, feelings of sadness or hopelessness, and weekly sleep. Fourth, in secondary analysis, I fit a similarly specified weighted logistic regression with ≥60 minutes of MVPA on 7 days per week. I also assessed the interaction of sex and race. For each model, I evaluated fit using survey-weighted binned residual plots by grouping observations according to predicted probability and comparing weighted observed and predicted outcome proportions within each group. I also examined leverage values and deviance residuals to identify observations that might unduly influence the model estimates. I utilized R version 4.5.1 for all statistical analyses36. I set the type I error rate at 5%.
Results
Characteristics of Sample
My study consisted of N=20,103 participants enrolled in US high schools in 2023 (Table 1). Most respondents in our sample were between the ages of 14 and 18 years old: 13% were 14 years old, 28% were 15 years old, 26% were 16 years old, 22% were 17 years old, and 11% were 18 years old. Our sample was evenly divided between males and females. Almost half of the participants were non-Hispanic White (49%), 20% were Hispanic, 9.1% were non-Hispanic Black, and 22% of participants did not fall into any of these categories. Forty percent of students reported earning mostly A’s, 31% reported mostly B’s, 16% were mostly C students, and 5% were mostly D students. The majority of the respondents did not attend any physical education classes in a school week (52%), the next most common was PE class every day (27%), followed by 3 classes per week (11%), 2 classes per week (4.3%), 4 classes per week (2.9%), and 1 class per week (2.1%). More than 2 in 5 high-school students felt sad or hopeless most days for weeks in a row (41%), and more than 1 in 5 high-school students (21%) considered suicide in the last year. The frequency of eating fruit varied: 12% ate no fruit in a week, 34% ate fruit 1-3 times in a week, 21% ate fruit 4 to 6 times in a week, 11% ate fruit once per day, 4.5% ate fruit twice per day, 4.5% ate fruit 3 times per day, and 5.0% ate fruit 4 or more times per day. The majority of high-school students ate no salad in a week (45%) or salad 1 to 3 times in the week (37%). Approximately 1 in 4 students (29%) drank no soda in the last week. Most students did not sleep 8 or more hours on an average school night (77%).
Weighted Prevalence of ≥60 Minutes of MVPA on ≥5 Days per Week
The overall proportion of adolescents who reported ≥60 minutes of MVPA on ≥5 days per week was 46.3% (95% confidence interval [CI]: 45.2% – 47.5%; Table 2). The proportion of adolescents who reported ≥60 minutes of MVPA on ≥5 days per week peaked at age 15 (50.8%; 95% CI: 48.6% – 53.0%) and was substantially higher among males than females. The prevalence among Hispanic and non-Hispanic Black students was very similar, and both lower than that of non-Hispanic White students. The proportion was about half for students in the first, second, and third quartiles of BMI. In comparison, the proportion was lower for students in the highest quartile of BMI (40.9%; 95% CI: 38.5% – 43.4%). As students’ letter grades decreased, the proportion of students reporting sufficient physical activity also decreased: 53.2% for mostly A students (95% CI 51.3% – 55.2%), 47.8% for mostly B students (95% CI: 45.6% – 50.0%), and 42.4% for mostly C students (95% CI: 39.3% – 45.4%). Among students who attended at least 1 PE class in a school week, the proportion increased with each additional PE class per school week: 18.4% for students who attended only 1 PE class in a school week (95% CI: 12.3% – 24.4%), 39.6% for students who attended 2 PE classes in a school week (95% CI: 34.0% – 45.1%), and 49.0% for students who attended 3 PE classes in a school week (95% CI: 45.5% – 52.5%). However, students who reported attending no PE classes in a school week did not fit this trend (36.3%; 95% CI: 34.7% – 38.0%).
The proportion of students who met ≥60 Minutes of MVPA on ≥5 days per week was higher for those who reported not feeling sad or hopeless most days for weeks in a row (51.4%; 95% CI: 49.9% – 52.9%) compared to those who did (39.0%; 95% CI: 37.3% – 40.8%). Similarly, the proportion was greater for those who reported not considering suicide in the last 12 months (48.9%; 95% CI: 47.5% – 50.2%) compared to those who did (38.6%; 95% CI: 36.1% – 41.1%). The proportion of students who did eat daily salad (57.1%; 95% CI: 53.2% – 61.0%) was higher compared to students who did not (44.9%; 95% CI: 43.6% – 46.2%). Similarly, compared to students who did not eat daily fruit (40.9%; 95% CI: 39.5% – 42.3%), the proportion was higher for those who did (57.8%; 95% CI: 53.2% – 61.0%). The proportion was similar for those who had no soda, less than daily soda, and daily soda. Finally, the proportion was greater for students who slept 8 or more hours on an average school night (54.6%; 95% CI: 52.1% – 57.1%) than for students who did not (44.3%; 95% CI: 42.9% – 45.6%).
Regression Results
The odds of ≥60 minutes of MVPA on ≥5 days per week were higher for males than for females, accounting for socio-demographic, school, psychological, nutrition, and health-related characteristics (adjusted odds ratio [aOR] 2.29; 95% CI: 2.00 – 2.62; Table 3). Compared to non-Hispanic White students, the odds were lower for non-Hispanic Black students (aOR 0.53; 95% CI: 0.43 – 0.64) and Hispanic students (aOR 0.54; 95% CI: 0.46 – 0.63). Compared to students who earned mostly A’s, the odds decreased with lower grades (e.g., aOR 0.83; 95% CI: 0.71 – 0.96 for mostly B students). Compared to students who did not attend any PE classes, the odds were lower for students who attended only 1 PE class (aOR 0.48; 95% CI: 0.29 – 0.80), but higher for students who attended 3, 4, or 5 days of PE class (e.g., aOR 3.35; 95% CI: 2.86 – 3.92 for 5 days). Compared to students who did not eat daily salad, the odds were higher for those who did (aOR 1.37; 95% CI: 1.09 – 1.73). The odds were also greater for daily fruit (aOR 1.67; 95% CI: 1.45 – 1.92), compared to less than daily fruit.
Secondary Analysis
The odds of ≥60 minutes of MVPA on 7 days per week were also higher for males than for females, accounting for socio-demographic, school, psychological, nutrition, and health-related characteristics (aOR 2.22; 95% CI: 1.91 – 2.58; Table 4). Compared to non-Hispanic White students, the odds were lower for non-Hispanic Black students (aOR 0.66; 95% CI: 0.53 – 0.83) and Hispanic students (aOR 0.61; 95% CI: 0.51 – 0.72). Compared to students who earned mostly A’s, the odds were approximately similar for students with mostly B’s (aOR 1.00; 95% CI: 0.85 – 1.18, mostly C’s (aOR 0.82; 95% CI: 0.67 – 1.01), mostly D’s (aOR 0.85; 95% CI: 0.60 – 1.22), and mostly F’s (aOR 0.66; 95% CI: 0.40 – 1.08). Compared to students who did not eat daily salad, the odds were significantly higher for those who did (aOR 1.73; 95% CI: 1.37 – 2.18). Compared to students who reported not feeling sad or hopeless most days for weeks in a row, the odds were lower for those who did (aOR 0.79; 95% CI: 0.67 – 0.94). In a separate secondary analysis, the interaction between sex and race was not significant (Table 5).
Discussion
My study reached five central findings. First, the overall prevalence of ≥60 minutes of MVPA on ≥5 days per week among teens aged 12 to 18 years old was 46%. In other words, 54% did not meet ≥60 minutes of MVPA on ≥5 days per week. Second, the proportion of adolescents who reported ≥60 minutes of MVPA on ≥5 days per week peaked at age 15. Third, the majority of high school students did not report attending any weekly PE classes. Fourth, the odds of ≥60 minutes of MVPA on ≥5 days per week were over 2 times higher for males than for females, accounting for socio-demographic, school, psychological, nutrition, and health-related characteristics. Fifth, the odds of ≥60 minutes of MVPA on ≥5 days per week, accounting for socio-demographic, school, psychological, nutrition, and health related characteristics, decreased as students’ academic performance decreased.
Pontes et al. found that the proportion of teenagers who engaged in ≥60 minutes of physical activity on 5 days per week or 7 days per week decreased with higher grade level in school6. Between 2011 and 2017, the proportion for males engaging in ≥60 minutes of PA on 5 days per week equaled 62% for 9th graders, 59% for 10th graders, 57% for 11th graders, and 54% for 12th graders. Similarly, the proportion for females equaled 44% for 9th graders, 39% for 10th graders, 35% for 11th graders, and 33% for 12th graders. In contrast, I focused on age and found that the proportion of teenagers who engaged in ≥60 minutes of MVPA on ≥5 days per week rose to a peak level among 15-year-olds and subsequently decreased (i.e., an ‘inverted U-shape’). The difference in results suggests that the pattern of physical activity may differ between the 2011-2017 and 2023 time periods. These periods span the COVID-19 pandemic, which could have contributed to shifts in adolescent physical activity. It is important to note that the confidence intervals for younger age groups are wide, suggesting limited precision in my findings. In a systematic review, Do et al. identified numerous studies that found the level of physical activity differentially changed by age37,38,38.
Merlo et al. found that the proportion of females who engaged in ≥60 minutes of physical activity on 7 days per week decreased from 19% in 2011 to 15% in 20195. Likewise, the proportion decreased from 38% in 2011 to 31% in 2019 for males5. Pontes et al. found that female teens exercised nearly 1 fewer day per week, on average, than male teens6. I reached substantively similar conclusions in the 2023 time period. After accounting for numerous socio-demographic, school-related, nutritional, psychosocial, and health-related characteristics, I found that the adjusted odds ratio for males engaging in ≥60 minutes of MVPA on ≥5 days a week was over 2 times that for females.
Merlo et al. also found that the proportion of non-Hispanic Black teens who engaged in ≥60 minutes of physical activity on 7 days per week decreased from 26% in 2011 to 21% in 20195. The proportion of non-Hispanic White teens who engaged in ≥60 minutes of physical activity on 7 days per week decreased from 30% in 2011 to 26% in 20195. And the proportion of Hispanic teens who engaged in ≥60 minutes of physical activity on 7 days per week decreased from 27% in 2011 to 21% in 20195. Pontes et al. also found that the proportion was lower among non-Hispanic Black and Hispanic teens compared to non-Hispanic White teens6. For example, for ≥5 days a week of ≥60 minutes of physical activity, the risk difference was approximately 7% for non-Hispanic Black males and approximately 7% for Hispanic males compared to non-Hispanic White males6. Likewise, for ≥5 days a week of ≥60 minutes of physical activity, the risk difference was approximately 10% for non-Hispanic Black females and approximately 7% for Hispanic females compared to non-Hispanic White females6. My findings align with these studies. The odds of ≥5 days per week of ≥60 minutes/day of MVPA were nearly half for non-Hispanic Black and Hispanic students compared to non-Hispanic White students.
Lowry et al. found positive associations between consumption of fruits and vegetables and routine physical activity7. My study aligns with these findings. I found that the prevalence of ≥60 minutes of MVPA on ≥5 days/week was higher in students who consumed daily fruits and vegetables.. Both studies likely found a positive association between fruit and vegetable consumption and frequent physical activity because healthy eating habits and physical activity are key aspects of a healthy lifestyle39. Therefore, the observed associations do not serve as evidence that increasing fruit or salad consumption alone would lead to higher levels of physical activity.
Sibley et al. and Tomporowski both found a positive association between school performance and physical activity23,24. In contrast, Tremblay et al. and Huang et al. found an inverse relationship between academic performance and physical activity25,26. Daley et al. and Kalantari et al. found no significant association between school performance and physical activity27,28. I found that as students’ letter grades improved, the proportion of students reporting ≥60 minutes of MVPA on ≥5 days per week also increased. For example, I found that the proportion of students reporting ≥60 minutes of MVPA on ≥5 days per week was 42.4% for mostly C students, 47.8% for mostly B students, and 53.2% for mostly A students. My findings may have aligned with Sibley et al. and Tomporowski because routine physical activity improves cognitive function and concentration, which could lead to improved academic performance13,40,41,42,43. Schools with well-developed physical education programs may also have high-quality academics. It is also possible that devoting a significant amount of time to physical activity may take away from study time, thus offsetting the benefits.
Wang et al. found an association between adequate physical activity and lower odds of depressive symptoms11. While I found that the prevalence of ≥60 minutes of MVPA on ≥5 days per week was higher for students who were not sad or hopeless for ≥2 weeks in a row in the last year, I did not observe a significant difference in the odds ratios. However, I did observe a significant difference in the odds ratios for the outcome of 7 days of ≥60 minutes of MVPA. Brown et al. found that the odds of suicide ideation were lower among teens reporting frequent vigorous-intensity physical activity9. My study did not find a significant association between suicidal ideation and the odds of MVPA with either outcome. It is possible that our results differ from those of Brown et al. because the latter considered vigorous-intensity physical activity while the former considered both moderate- and vigorous-intensity physical activity.
Foti et al. found an association between sufficient sleep (i.e. ,≥ 8 hours of sleep per night) and adequate physical activity44. My findings align with Foti et al. because I found that the odds of ≥5 days of ≥60 minutes of MVPA were significantly higher for those who had sufficient sleep compared to those who did not. These concordant results suggest that sleep is also a key aspect of a healthy lifestyle.
My results directly inform numerous school-, district-, and state-level policies. School curriculum could better emphasize the benefits of exercising and identify strategies to build more physical activity throughout the day. Wellness-based curriculum could also benefit students by potentially improving nutrition and sleep. Specifically, schools could integrate programs such as daily intramural sports or wellness clubs. Parents, in addition to schools, can also encourage their children to be more physically active and discuss the benefits of physical activity. Parents can also advocate for schools to integrate more activities, such as intramural sports and wellness clubs.
Barriers such as limited physical education time in school may require more action from state legislatures. State legislatures can directly influence student physical activity by legislating minimum physical education requirements and funding school programs. However, they face barriers such as limited budgets, pressure to prioritize core academics, and may face resistance from schools concerned about losing instructional time. Different districts also have unequal access to resources. If more time cannot be allocated to physical education classes, then schools can also prioritize high-quality equipment and hire more physical education teachers.
My study has several strengths. First, it utilized nationally representative data, which improved the generalizability of the findings. Second, it considered a wide range of factors related to physical activity, allowing for a more comprehensive assessment. I also note several important limitations. First, physical activity was self-reported, which may have resulted in potential misreporting. Second, the study did not capture the duration of MVPA beyond 60 minutes, limiting the ability to look at results associated with longer activity periods. Additionally, it is possible that students engaged in MVPA daily, but only for less than 60 minutes, and this may have influenced the results for students who did not meet the recommended ≥60 minutes of MVPA on ≥5 days per week. MVPA across different students could have considerable variability with respect to intensity and type of activity. Third, my study also did not assess other types of physical activity, such as vigorous-intensity aerobic, muscle-strengthening, and bone-strengthening physical activity45. Fourth, it is also important to consider that several lifestyle and behavioral factors in the model are likely correlated and may also capture broader social and environmental influences rather than a single determinant. Consequently, observed associations may reflect overall lifestyle patterns and weaken the estimated effects of any individual covariate. For example, students from higher socioeconomic backgrounds may be more likely to have healthier diets and greater participation in physical education due to more school resources and family support. Fifth, BMI was calculated based on self-reported height and weight data. Since it is a calculated variable based on self-reported data from adolescents, there may be some biases that affect the precision of the BMI-related results46. Finally, my primary outcome was ≥60 minutes of MVPA on ≥5 days per week. I reached similar substantive conclusions in secondary analysis using ≥60 minutes of MVPA on 7 days per week as the outcome. Future research could assess factors related to the number of days of ≥60 minutes of MVPA per week.
In conclusion, a large proportion of adolescents nationally did not achieve sufficient MVPA. Those who did reported better mental health, more consumption of fruits and vegetables, adequate sleep, and improved academic performance. Increasing physical activity during adolescence can lead to numerous physical and mental health benefits. Future longitudinal studies can quantify the lasting effects of routine MVPA on academic performance, mental health, and physical health. Greater physical activity during adolescence can build lasting healthy habits that carry into adulthood.
Acknowledgments
I acknowledge Nicholas Menzorio (Sr.) and Betty Menzorio for their helpful suggestions and comments.
Tables with Captions
| Characteristic | N = 20,1031 |
| Age (years) | |
| 12 | 44 (0.2%) |
| 13 | 33 (0.2%) |
| 14 | 2,569 (13%) |
| 15 | 5,526 (28%) |
| 16 | 5,208 (26%) |
| 17 | 4,458 (22%) |
| 18 | 2,167 (11%) |
| Unknown | 98 |
| Sex | |
| Female | 9,884 (50%) |
| Male | 10,061 (50%) |
| Unknown | 158 |
| Race/Ethnicity | |
| Non-Hispanic White | 9,700 (49%) |
| Non-Hispanic Black | 1,791 (9.1%) |
| Hispanic | 3,994 (20%) |
| Non-Hispanic Other | 4,248 (22%) |
| Unknown | 370 |
| BMI Quartile | |
| 1 | 4,454 (25%) |
| 2 | 4,454 (25%) |
| 3 | 4,453 (25%) |
| 4 | 4,453 (25%) |
| Unknown | 2,289 |
| Grades | |
| Mostly A’s | 6,585 (40%) |
| Mostly B’s | 5,094 (31%) |
| Mostly C’s | 2,667 (16%) |
| Mostly D’s | 842 (5.1%) |
| Mostly F’s | 506 (3.1%) |
| None of these grades | 79 (0.5%) |
| Not sure | 762 (4.6%) |
| Unknown | 3,568 |
| Days attending PE classes per school week | |
| 0 | 7,283 (52%) |
| 1 | 292 (2.1%) |
| 2 | 599 (4.3%) |
| 3 | 1,543 (11%) |
| 4 | 398 (2.9%) |
| 5 | 3,761 (27%) |
| Unknown | 6,227 |
| Felt sad or hopeless most days for weeks in a row | 8,108 (41%) |
| Unknown | 240 |
| Considered suicide in the last 12 months | 4,214 (21%) |
| Unknown | 436 |
| Times eating fruit in the last week | |
| Less than daily | 12,845 (68%) |
| Daily | 6,182 (32%) |
| Unknown | 1,076 |
| Times eating salad in the last week | |
| Less than daily | 13,802 (90%) |
| Daily | 1,534 (10%) |
| Unknown | 4,767 |
| Times drinking soda in the last week | |
| None | 4,383 (29%) |
| Less than daily | 8,215 (54%) |
| Daily | 2,585 (17%) |
| Unknown | 4,920 |
| 8 or More Hours of sleep on an average school night | 4,006 (23%) |
| Unknown | 2,662 |
1 n (%). Abbreviations: BMI=body mass index; PE=physical activity.
| Group | Proportion | Lower 95% CI | Upper 95% CI |
| Overall | |||
| 46.3% | 45.2% | 47.5% | |
| Age (years) | |||
| 12 | 35.7% | 13.2% | 58.3% |
| 13 | 38.0% | 13.4% | 62.7% |
| 14 | 46.9% | 43.6% | 50.1% |
| 15 | 50.8% | 48.6% | 53.0% |
| 16 | 45.2% | 43.0% | 47.4% |
| 17 | 42.2% | 39.8% | 44.6% |
| 18 | 47.6% | 44.0% | 51.2% |
| Sex | |||
| Female | 36.0% | 34.5% | 37.6% |
| Male | 56.0% | 54.4% | 57.7% |
| Race/Ethnicity | |||
| Non-Hispanic White | 53.3% | 51.7% | 55.0% |
| Non-Hispanic Black | 38.9% | 35.7% | 42.1% |
| Hispanic | 39.8% | 37.5% | 42.1% |
| Non-Hispanic Other | 44.7% | 41.5% | 47.9% |
| BMI Percentile | |||
| 1 | 46.5% | 44.1% | 49.0% |
| 2 | 53.4% | 51.0% | 55.8% |
| 3 | 50.6% | 48.1% | 53.0% |
| 4 | 40.9% | 38.5% | 43.4% |
| Grades | |||
| Mostly A’s | 53.2% | 51.3% | 55.2% |
| Mostly B’s | 47.8% | 45.6% | 50.0% |
| Mostly C’s | 42.4% | 39.3% | 45.4% |
| Mostly D’s | 38.4% | 32.4% | 44.5% |
| Mostly F’s | 30.8% | 23.9% | 37.6% |
| None of these grades | 49.1% | 31.3% | 66.9% |
| Not sure | 32.4% | 26.7% | 38.1% |
| PE Classes (days) | |||
| 0 | 36.3% | 34.7% | 38.0% |
| 1 | 18.4% | 12.3% | 24.4% |
| 2 | 39.6% | 34.0% | 45.1% |
| 3 | 49.0% | 45.5% | 52.5% |
| 4 | 50.0% | 43.0% | 57.0% |
| 5 | 65.4% | 63.1% | 67.6% |
| Sad or Hopeless | |||
| No | 51.4% | 49.9% | 52.9% |
| Yes | 39.0% | 37.3% | 40.8% |
| Considered Suicide | |||
| No | 48.9% | 47.6% | 50.2% |
| Yes | 38.6% | 36.1% | 41.1% |
| Weekly Salad | |||
| Less than daily | 44.9% | 43.6% | 46.2% |
| Daily | 57.1% | 53.2% | 61.0% |
| Weekly Fruit | |||
| Less than daily | 40.9% | 39.5% | 42.3% |
| Daily | 57.8% | 55.8% | 59.7% |
| Weekly Soda | |||
| None | 45.4% | 43.2% | 47.7% |
| Less than daily | 47.3% | 45.6% | 48.9% |
| Daily | 43.1% | 40.0% | 46.1% |
| Weekday Sleep 8 or More Hours | |||
| No | 44.3% | 42.9% | 45.6% |
| Yes | 54.6% | 52.1% | 57.1% |
Abbreviations: BMI=body mass index; PE=physical activity.
| Variable | aOR | 95% CI | p-value |
| Age (years) | |||
| 14 | — | — | |
| 12 | 2.24 | 0.13, 38.6 | 0.6 |
| 13 | 0.54 | 0.09, 3.47 | 0.5 |
| 15 | 1.17 | 0.93, 1.46 | 0.2 |
| 16 | 1.09 | 0.87, 1.37 | 0.4 |
| 17 | 1.11 | 0.88, 1.39 | 0.4 |
| 18 | 1.31 | 1.01, 1.70 | 0.044 |
| Sex | |||
| Female | — | — | |
| Male | 2.29 | 2.00, 2.62 | <0.001 |
| Race/Ethnicity | |||
| Non-Hispanic White | — | — | |
| Non-Hispanic Black | 0.53 | 0.43, 0.64 | <0.001 |
| Hispanic | 0.54 | 0.46, 0.63 | <0.001 |
| Non-Hispanic Other | 0.66 | 0.54, 0.81 | <0.001 |
| BMI Quartile | |||
| 1 | — | — | |
| 2 | 1.33 | 1.11, 1.59 | 0.002 |
| 3 | 1.19 | 1.00, 1.43 | 0.051 |
| 4 | 0.94 | 0.78, 1.12 | 0.5 |
| Grades | |||
| Mostly A’s | — | — | |
| Mostly B’s | 0.83 | 0.71, 0.96 | 0.015 |
| Mostly C’s | 0.61 | 0.50, 0.74 | <0.001 |
| Mostly D’s | 0.49 | 0.36, 0.66 | <0.001 |
| Mostly F’s | 0.45 | 0.29, 0.70 | <0.001 |
| None of these grades | 1.04 | 0.29, 3.70 | >0.9 |
| Not sure | 0.46 | 0.31, 0.68 | <0.001 |
| Days attending PE classes per school week | |||
| 0 | — | — | |
| 1 | 0.48 | 0.29, 0.80 | 0.005 |
| 2 | 1.25 | 0.92, 1.68 | 0.15 |
| 3 | 1.42 | 1.17, 1.72 | <0.001 |
| 4 | 1.91 | 1.37, 2.67 | <0.001 |
| 5 | 3.35 | 2.86, 3.92 | <0.001 |
| Felt sad or hopeless most days for weeks in a row | |||
| No | — | — | |
| Yes | 0.89 | 0.76, 1.04 | 0.13 |
| Considered suicide in the last 12 months | |||
| No | — | — | |
| Yes | 0.98 | 0.82, 1.17 | 0.8 |
| Times eating fruit in the last week | |||
| Less than daily | — | — | |
| Daily | 1.67 | 1.45, 1.92 | <0.001 |
| Times eating salad in the last week | |||
| Less than daily | — | — | |
| Daily | 1.37 | 1.09, 1.73 | 0.007 |
| Times drinking soda in the last week | |||
| None | — | — | |
| Less than daily | 1.07 | 0.93, 1.24 | 0.3 |
| Daily | 0.89 | 0.73, 1.09 | 0.3 |
| 8 or More Hours of sleep on an average school night | |||
| No | — | — | |
| Yes | 1.15 | 0.98, 1.34 | 0.079 |
| No. Obs. | 9,471 | ||
| AIC | 14,352 | ||
Abbreviations: CI = Confidence Interval, aOR = Adjusted Odds Ratio, BMI=body mass index; PE=physical activity.
| Variable | aOR | 95% CI | p-value |
| Age (years) | |||
| 14 | — | — | |
| 12 | 4.24 | 0.33, 54.6 | 0.3 |
| 13 | 0.00 | 0.00, 0.00 | <0.001 |
| 15 | 1.11 | 0.87, 1.43 | 0.4 |
| 16 | 1.01 | 0.78, 1.30 | >0.9 |
| 17 | 1.02 | 0.78, 1.32 | >0.9 |
| 18 | 0.99 | 0.74, 1.34 | >0.9 |
| Sex | |||
| Female | — | — | |
| Male | 2.22 | 1.91, 2.58 | <0.001 |
| Race/Ethnicity | |||
| Non-Hispanic White | — | — | |
| Non-Hispanic Black | 0.66 | 0.53, 0.83 | <0.001 |
| Hispanic | 0.61 | 0.51, 0.72 | <0.001 |
| Non-Hispanic Other | 0.61 | 0.48, 0.76 | <0.001 |
| BMI Quartile | |||
| 1 | — | — | |
| 2 | 1.36 | 1.12, 1.64 | 0.002 |
| 3 | 1.10 | 0.90, 1.33 | 0.3 |
| 4 | 0.84 | 0.68, 1.03 | 0.090 |
| Grades | |||
| Mostly A’s | — | — | |
| Mostly B’s | 1.00 | 0.85, 1.18 | >0.9 |
| Mostly C’s | 0.82 | 0.67, 1.01 | 0.066 |
| Mostly D’s | 0.85 | 0.60, 1.22 | 0.4 |
| Mostly F’s | 0.66 | 0.40, 1.08 | 0.10 |
| None of these grades | 1.36 | 0.44, 4.19 | 0.6 |
| Not sure | 0.82 | 0.53, 1.27 | 0.4 |
| Days attending PE classes per school week | |||
| 0 | — | — | |
| 1 | 0.65 | 0.37, 1.16 | 0.15 |
| 2 | 1.13 | 0.79, 1.61 | 0.5 |
| 3 | 1.37 | 1.10, 1.69 | 0.005 |
| 4 | 0.94 | 0.63, 1.40 | 0.7 |
| 5 | 1.98 | 1.68, 2.34 | <0.001 |
| Felt sad or hopeless most days for weeks in a row | |||
| No | — | — | |
| Yes | 0.79 | 0.67, 0.94 | 0.007 |
| Considered suicide in the last 12 months | |||
| No | — | — | |
| Yes | 1.04 | 0.85, 1.28 | 0.7 |
| Times eating fruit in the last week | |||
| Less than daily | — | — | |
| Daily | 1.55 | 1.34, 1.81 | <0.001 |
| Times eating salad in the last week | |||
| Less than daily | — | — | |
| Daily | 1.73 | 1.37, 2.18 | <0.001 |
| Times drinking soda in the last week | |||
| None | — | — | |
| Less than daily | 1.07 | 0.91, 1.27 | 0.4 |
| Daily | 1.26 | 1.01, 1.57 | 0.042 |
| 8 or More Hours of sleep on an average school night | |||
| No | — | — | |
| Yes | 1.16 | 0.98, 1.37 | 0.083 |
| No. Obs. | 9,471 | ||
| AIC | 12,490 | ||
Abbreviations: CI = Confidence Interval, aOR = Adjusted Odds Ratio
| Variable | OR | 95% CI | p-value |
| Age (years) | |||
| 14 | — | — | |
| 12 | 2.25 | 0.13, 37.8 | 0.6 |
| 13 | 0.55 | 0.09, 3.54 | 0.5 |
| 15 | 1.17 | 0.94, 1.47 | 0.2 |
| 16 | 1.10 | 0.88, 1.38 | 0.4 |
| 17 | 1.11 | 0.88, 1.39 | 0.4 |
| 18 | 1.31 | 1.01, 1.71 | 0.041 |
| Sex | |||
| Female | — | — | |
| Male | 2.16 | 1.79, 2.61 | <0.001 |
| Race/Ethnicity | |||
| Non-Hispanic White | — | — | |
| Non-Hispanic Black | 0.43 | 0.32, 0.57 | <0.001 |
| Hispanic | 0.53 | 0.42, 0.66 | <0.001 |
| Non-Hispanic Other | 0.67 | 0.49, 0.92 | 0.012 |
| BMI Quartile | |||
| 1 | — | — | |
| 2 | 1.33 | 1.12, 1.60 | 0.002 |
| 3 | 1.20 | 1.00, 1.43 | 0.045 |
| 4 | 0.94 | 0.79, 1.13 | 0.5 |
| Grades | |||
| Mostly A’s | — | — | |
| Mostly B’s | 0.83 | 0.71, 0.96 | 0.016 |
| Mostly C’s | 0.60 | 0.50, 0.73 | <0.001 |
| Mostly D’s | 0.49 | 0.36, 0.66 | <0.001 |
| Mostly F’s | 0.45 | 0.29, 0.70 | <0.001 |
| None of these grades | 1.04 | 0.29, 3.67 | >0.9 |
| Not sure | 0.46 | 0.31, 0.68 | <0.001 |
| Days attending PE classes per school week | |||
| 0 | — | — | |
| 1 | 0.48 | 0.29, 0.80 | 0.005 |
| 2 | 1.24 | 0.92, 1.67 | 0.2 |
| 3 | 1.42 | 1.17, 1.73 | <0.001 |
| 4 | 1.90 | 1.36, 2.66 | <0.001 |
| 5 | 3.34 | 2.85, 3.91 | <0.001 |
| Felt sad or hopeless most days for weeks in a row | |||
| No | — | — | |
| Yes | 0.89 | 0.76, 1.04 | 0.13 |
| Considered suicide in the last 12 months | |||
| No | — | — | |
| Yes | 0.98 | 0.82, 1.18 | 0.9 |
| Times eating fruit in the last week | |||
| Less than daily | — | — | |
| Daily | 1.66 | 1.44, 1.91 | <0.001 |
| Times eating salad in the last week | |||
| Less than daily | — | — | |
| Daily | 1.38 | 1.09, 1.74 | 0.007 |
| Times drinking soda in the last week | |||
| None | — | — | |
| Less than daily | 1.07 | 0.93, 1.24 | 0.4 |
| Daily | 0.90 | 0.73, 1.10 | 0.3 |
| 8 or More Hours of sleep on an average school night | |||
| No | — | — | |
| Yes | 1.15 | 0.99, 1.35 | 0.076 |
| Sex * Race/Ethnicity | |||
| Male * Non-Hispanic Black | 1.49 | 1.00, 2.21 | 0.050 |
| Male * Hispanic | 1.03 | 0.76, 1.40 | 0.8 |
| Male * Non-Hispanic Other | 0.98 | 0.65, 1.48 | >0.9 |
| No. Obs. | 9,471 | ||
| AIC | 14,356 | ||
Abbreviations: CI = Confidence Interval, OR = Odds Ratio
Appendix
Appendix Tables with Captions
| Variable | Question | Response options | Coding for analysis |
| Desired outcome | |||
| ≥ 5 days of MVPA per week | During the past 7 days, on how many days were you physically active for a total of at least 60 minutes per day? (Add up all the time you spent in any kind of physical activity that increased your heart rate and made you breathe hard some of the time.) | 0 days, 1 day, 2 days, 3 days, 4 days, 5 days, 6 days, or 7 days | ≤4 days versus ≥5 days |
| Socio-demographic variables | |||
| Age | How old are you? | 12 years old or younger, 13 years old, 14 years old, 15 years old, 16 years old, 17 years old, or 18 years old or older | 12, 13, 14, 15, 16, 17, or 18 |
| Sex | What is your sex? | Female or male | Female or male |
| Race / Hispanic Ethnicity (YRBS calculated variable) | What is your race? (Select one or more responses.) Are you Hispanic or Latino? | Am Indian/Alaska Native, Asian, Black or African American, Native Hawaiian/Other PI, White, Hispanic/Latino, Multiple – Hispanic, Multiple – Non-Hispanic | non-Hispanic other, non-Hispanic Black, non-Hispanic White, or Hispanic |
| Nutritional variables | |||
| Times eating fruit in the last week | During the past 7 days, how many times did you eat fruit? (Do not count fruit juice.) | I did not eat fruit during the past 7 days, 1 to 3 times during the past 7 days, 4 to 6 times during the past 7 days, 1 time per day, 2 times per day, 3 times per day, or 4 or more times per day | Less than daily, Daily |
| Times eating salad in the last week | During the past 7 days, how many times did you eat green salad? | I did not eat green salad during the past 7 days, 1 to 3 times during the past 7 days, 4 to 6 times during the past 7 days, 1 time per day, 2 times per day, 3 times per day, or 4 or more times per day | Less than daily, Daily |
| Times drinking soda in the last week | During the past 7 days, how many times did you drink a can, bottle, or glass of soda or pop, such as Coke, Pepsi, or Sprite? (Do not count diet soda or diet pop.) | I did not drink soda or pop during the past 7 days, 1 to 3 times during the past 7 days, 4 to 6 times during the past 7 days, 1 time per day, 2 times per day, 3 times per day, or 4 or more times per day | None, Less than daily, Daily |
| School-related variables | |||
| Weekly physical education classes | In an average week when you are in school, on how many days do you go to physical education (PE) classes? | 0 days, 1 day, 2 days, 3 days, 4 days, or 5 days | 0, 1, 2, 3, 4, or 5 |
| Academic grades in school | During the past 12 months, how would you describe your grades in school? | Mostly A’s, Mostly B’s, Mostly C’s, Mostly D’s, Mostly F’s, None of these grades, Not sure | Mostly A’s, Mostly B’s, Mostly C’s, Mostly D’s, Mostly F’s, None of these grades, Not sure |
| Psychological variables | |||
| Felt sad or hopeless most days for two weeks or more in the last 12 months | During the past 12 months, did you ever feel so sad or hopeless almost every day for two weeks or more in a row that you stopped doing some usual activities? | Yes or No | Yes or No |
| Seriously considered attempting suicide in the last 12 months | During the past 12 months, did you ever seriously consider attempting suicide? | Yes or No | Yes or No |
| Health-related variables | |||
| Average sleep on a school night | On an average school night, how many hours of sleep do you get? | 4 or less hours, 5 hours, 6 hours, 7 hours, 8 hours, 9 hours, or 10 or more hours | Less than 8, 8 or more |
| BMI Percentile (YRBS calculated variable) | – | – | 1-25th percentile, 26-50th percentile, 51-75th percentile, 76-100th percentile |
Source: 2023 Youth Risk Behavior Survey.
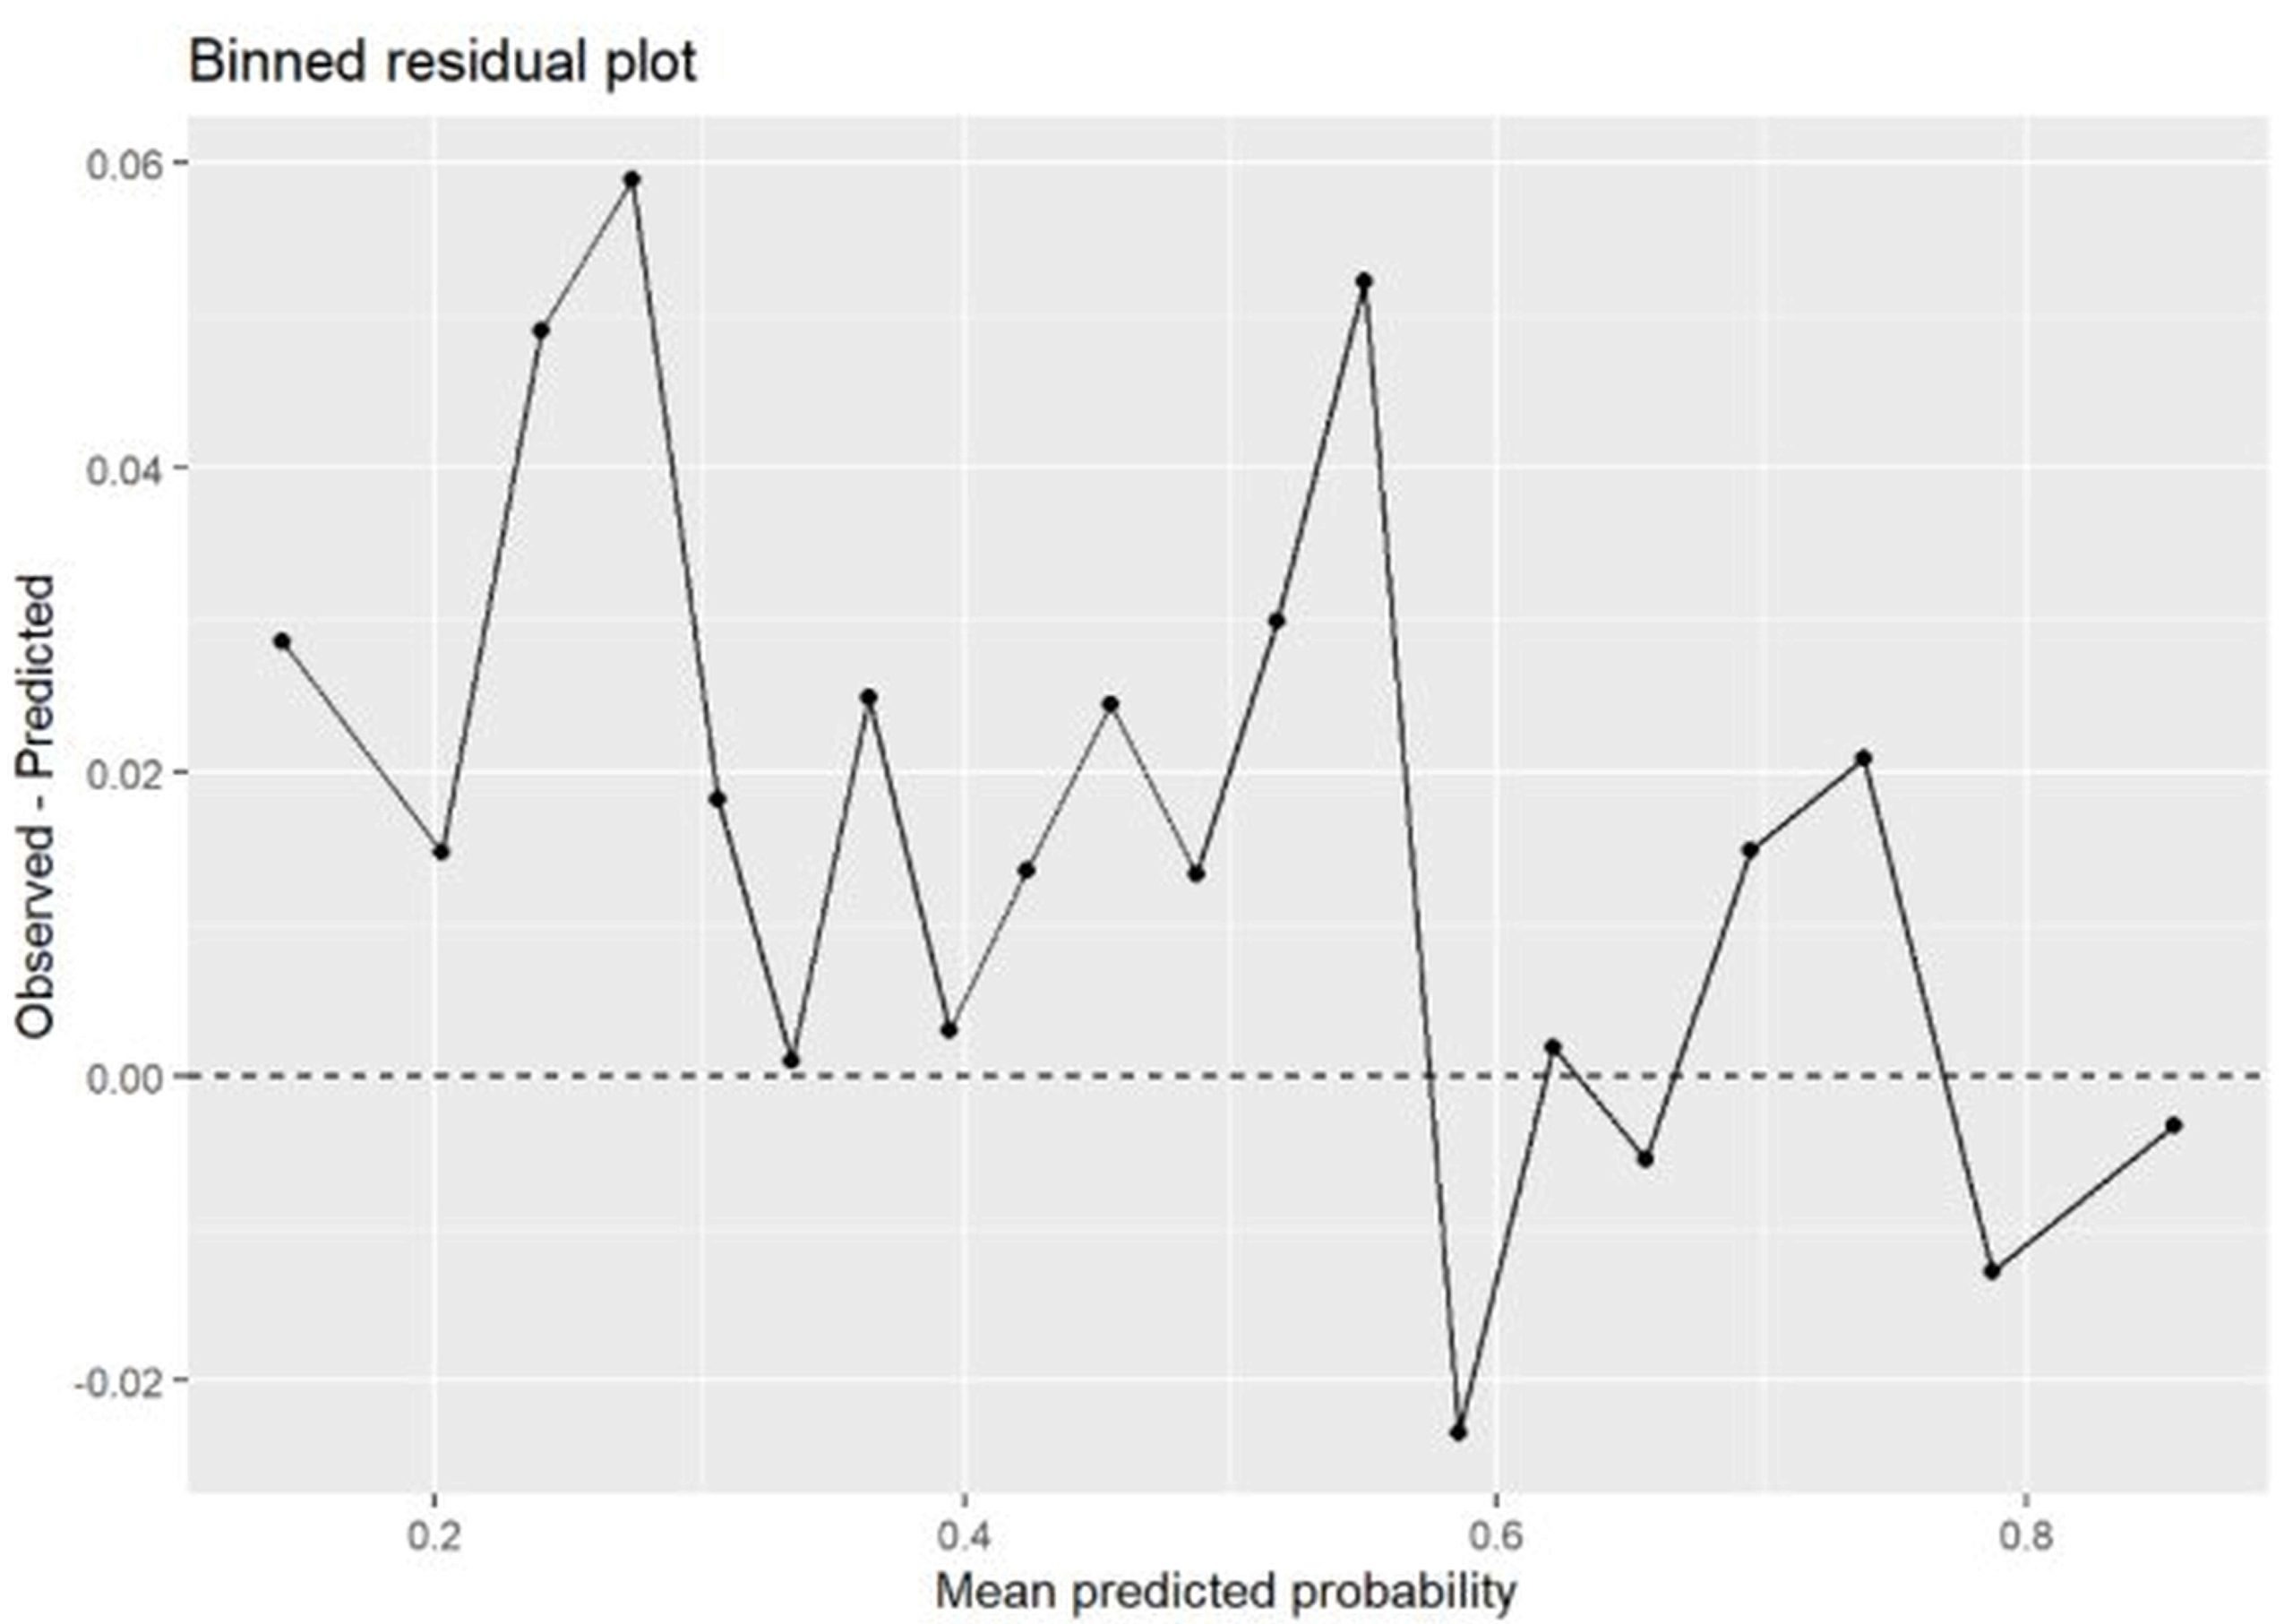
A binned residual plot was used to assess the goodness-of-fit of the logistic regression model. In this plot, residuals are grouped into bins based on the model’s predicted probabilities, and the average residual within each bin is plotted with confidence intervals. The points in the binned residual plot were generally centered around zero and fell within the expected confidence bands, suggesting that the model fits the data reasonably well and that there is no strong systematic pattern of over- or under-prediction across the range of predicted probabilities. This indicates that the logistic specification provides an adequate description of the relationship between the covariates and the probability of meeting physical activity guidelines.
| Diagnostic | Value |
| Sample size (N) | 9,471 |
| Number of model coefficients (p) | 32 |
| Max leverage | 0.5420 |
| 99th percentile leverage | 0.0203 |
| Leverage threshold (2p/N) | 0.0068 |
| Observations with leverage > 2p/N | 1,350 |
| Max |deviance residual| | 4.5211 |
| Observations with |deviance residual| > 3 | 187 |
Influential observation diagnostics were also conducted to evaluate whether any individual observations had an undue impact on the estimated regression coefficients. Measures such as leverage were examined to screen for influential cases. The summary of this screening indicated that no observations exceeded commonly used thresholds for influence, suggesting that the estimated associations were not driven by a small number of atypical respondents. Overall, the diagnostic checks provide reassurance that the model estimates are stable and not unduly affected by influential observations.
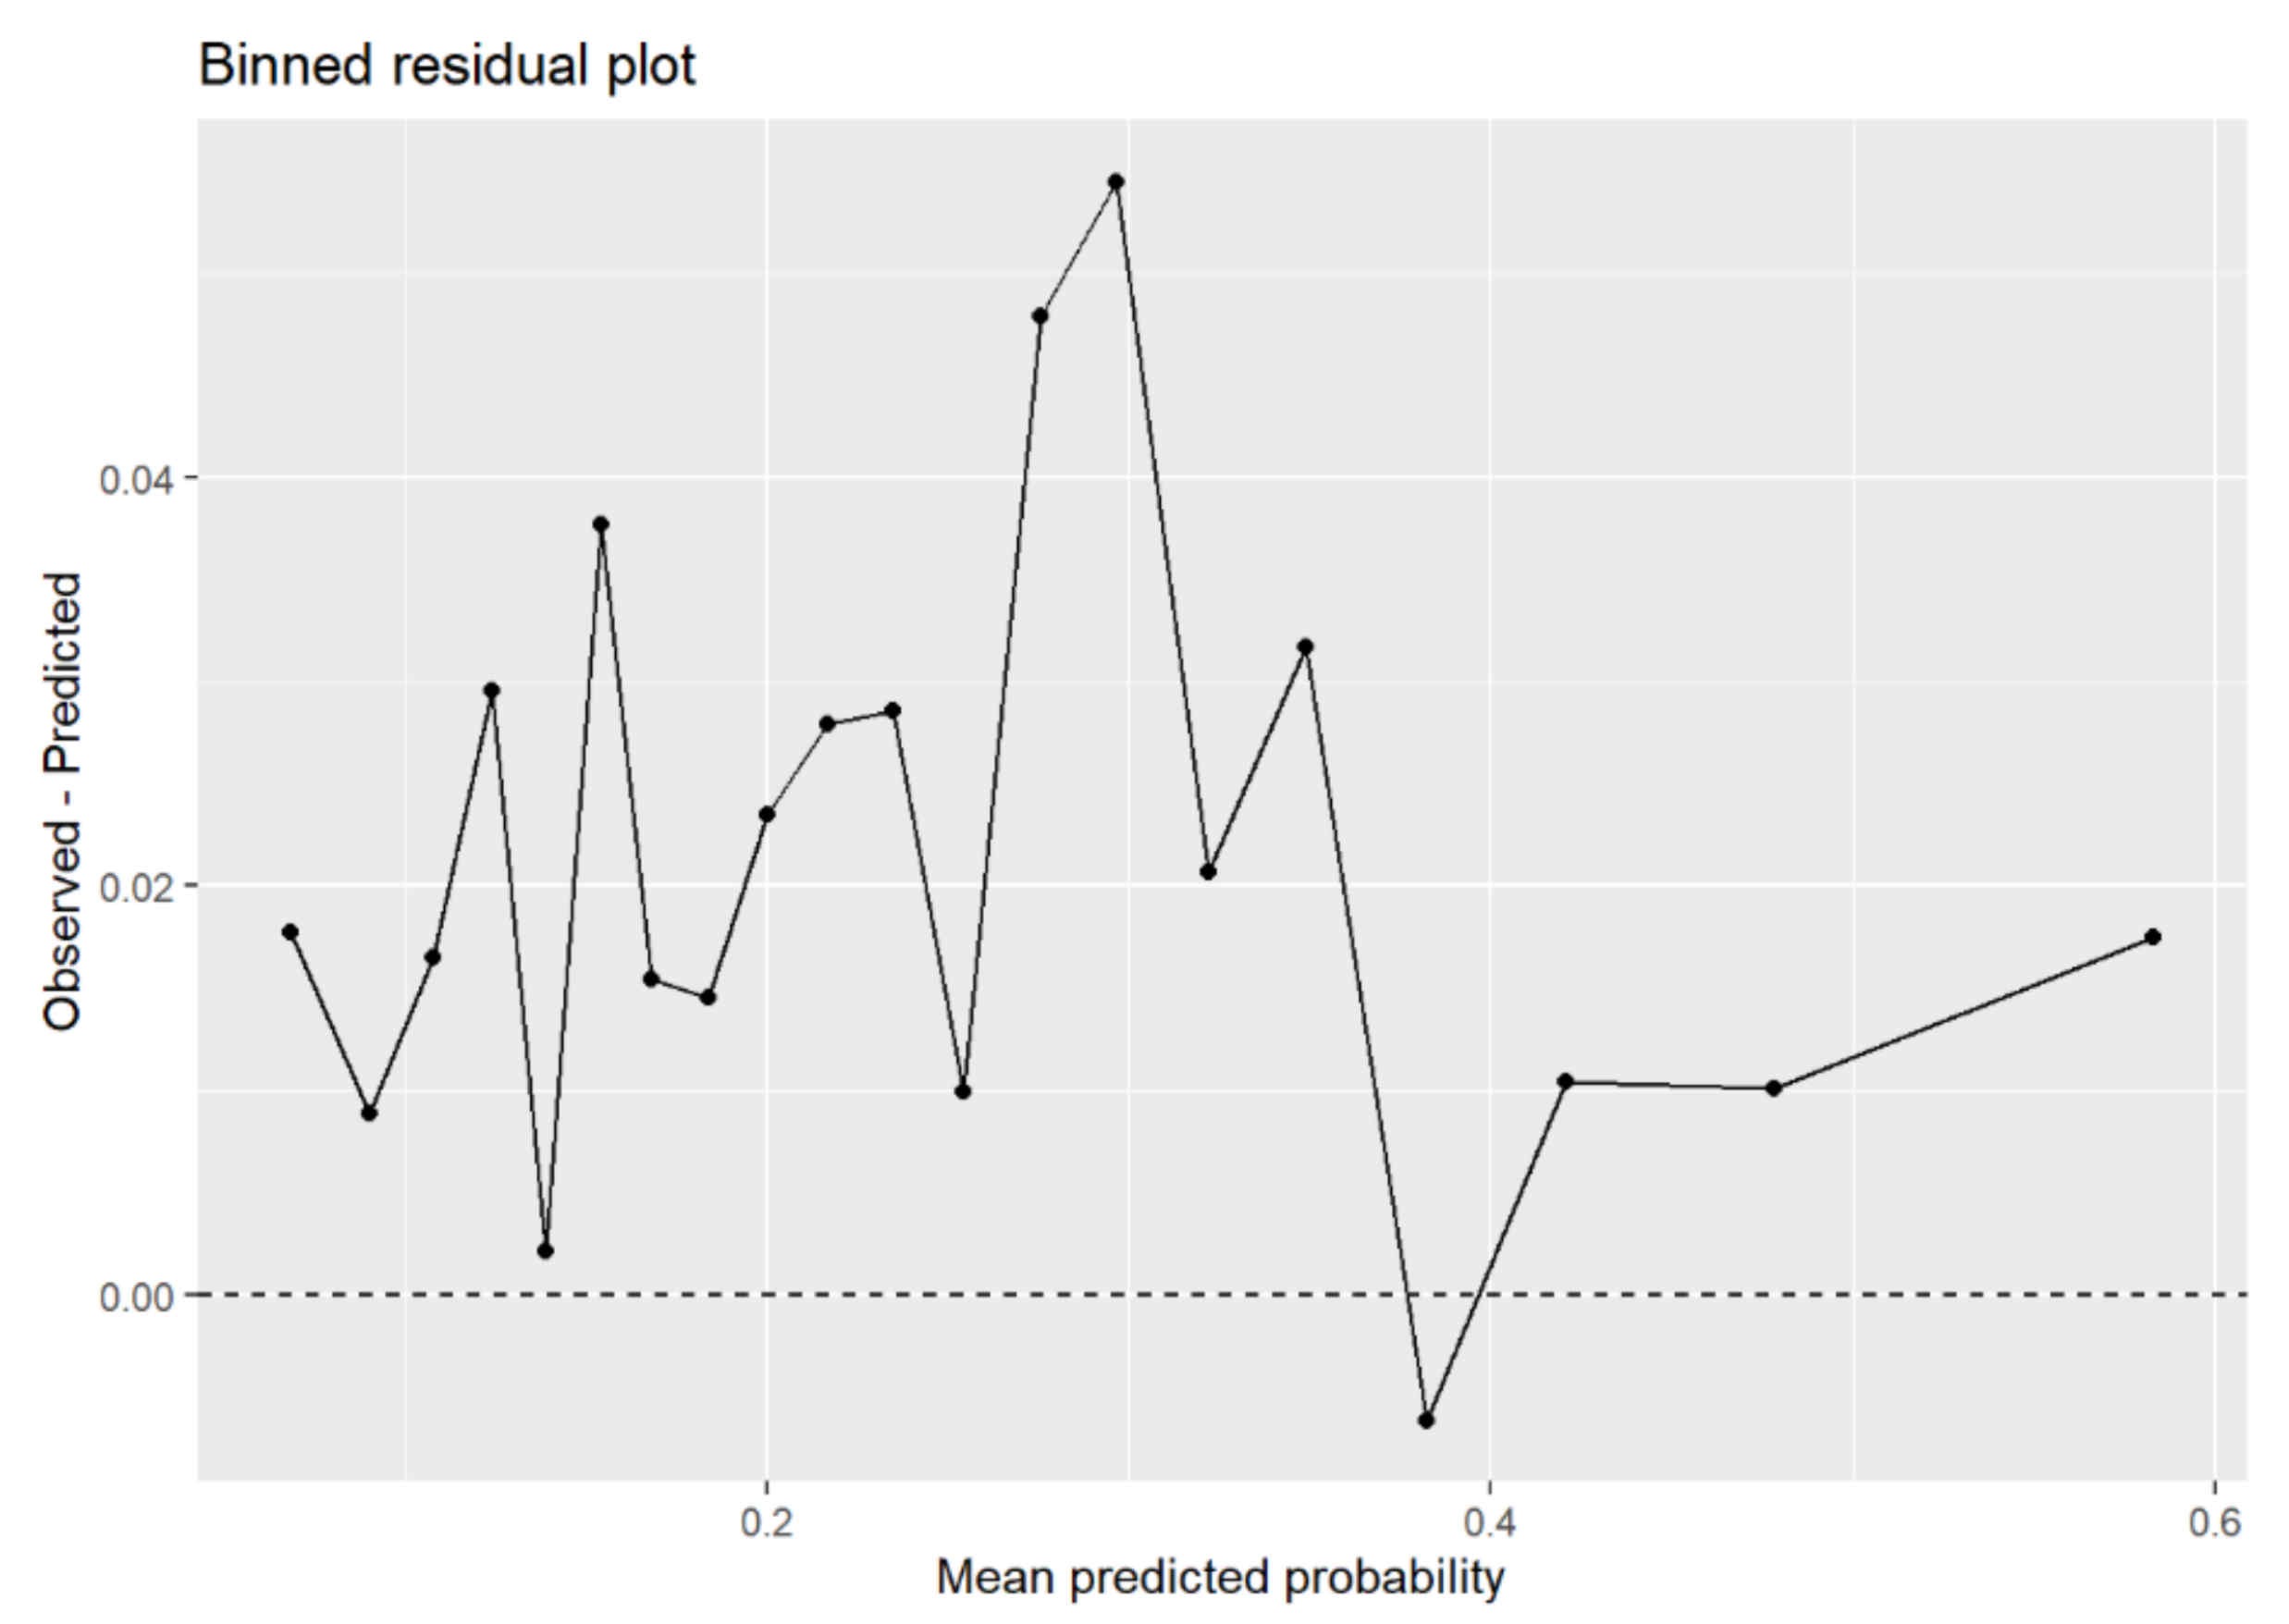
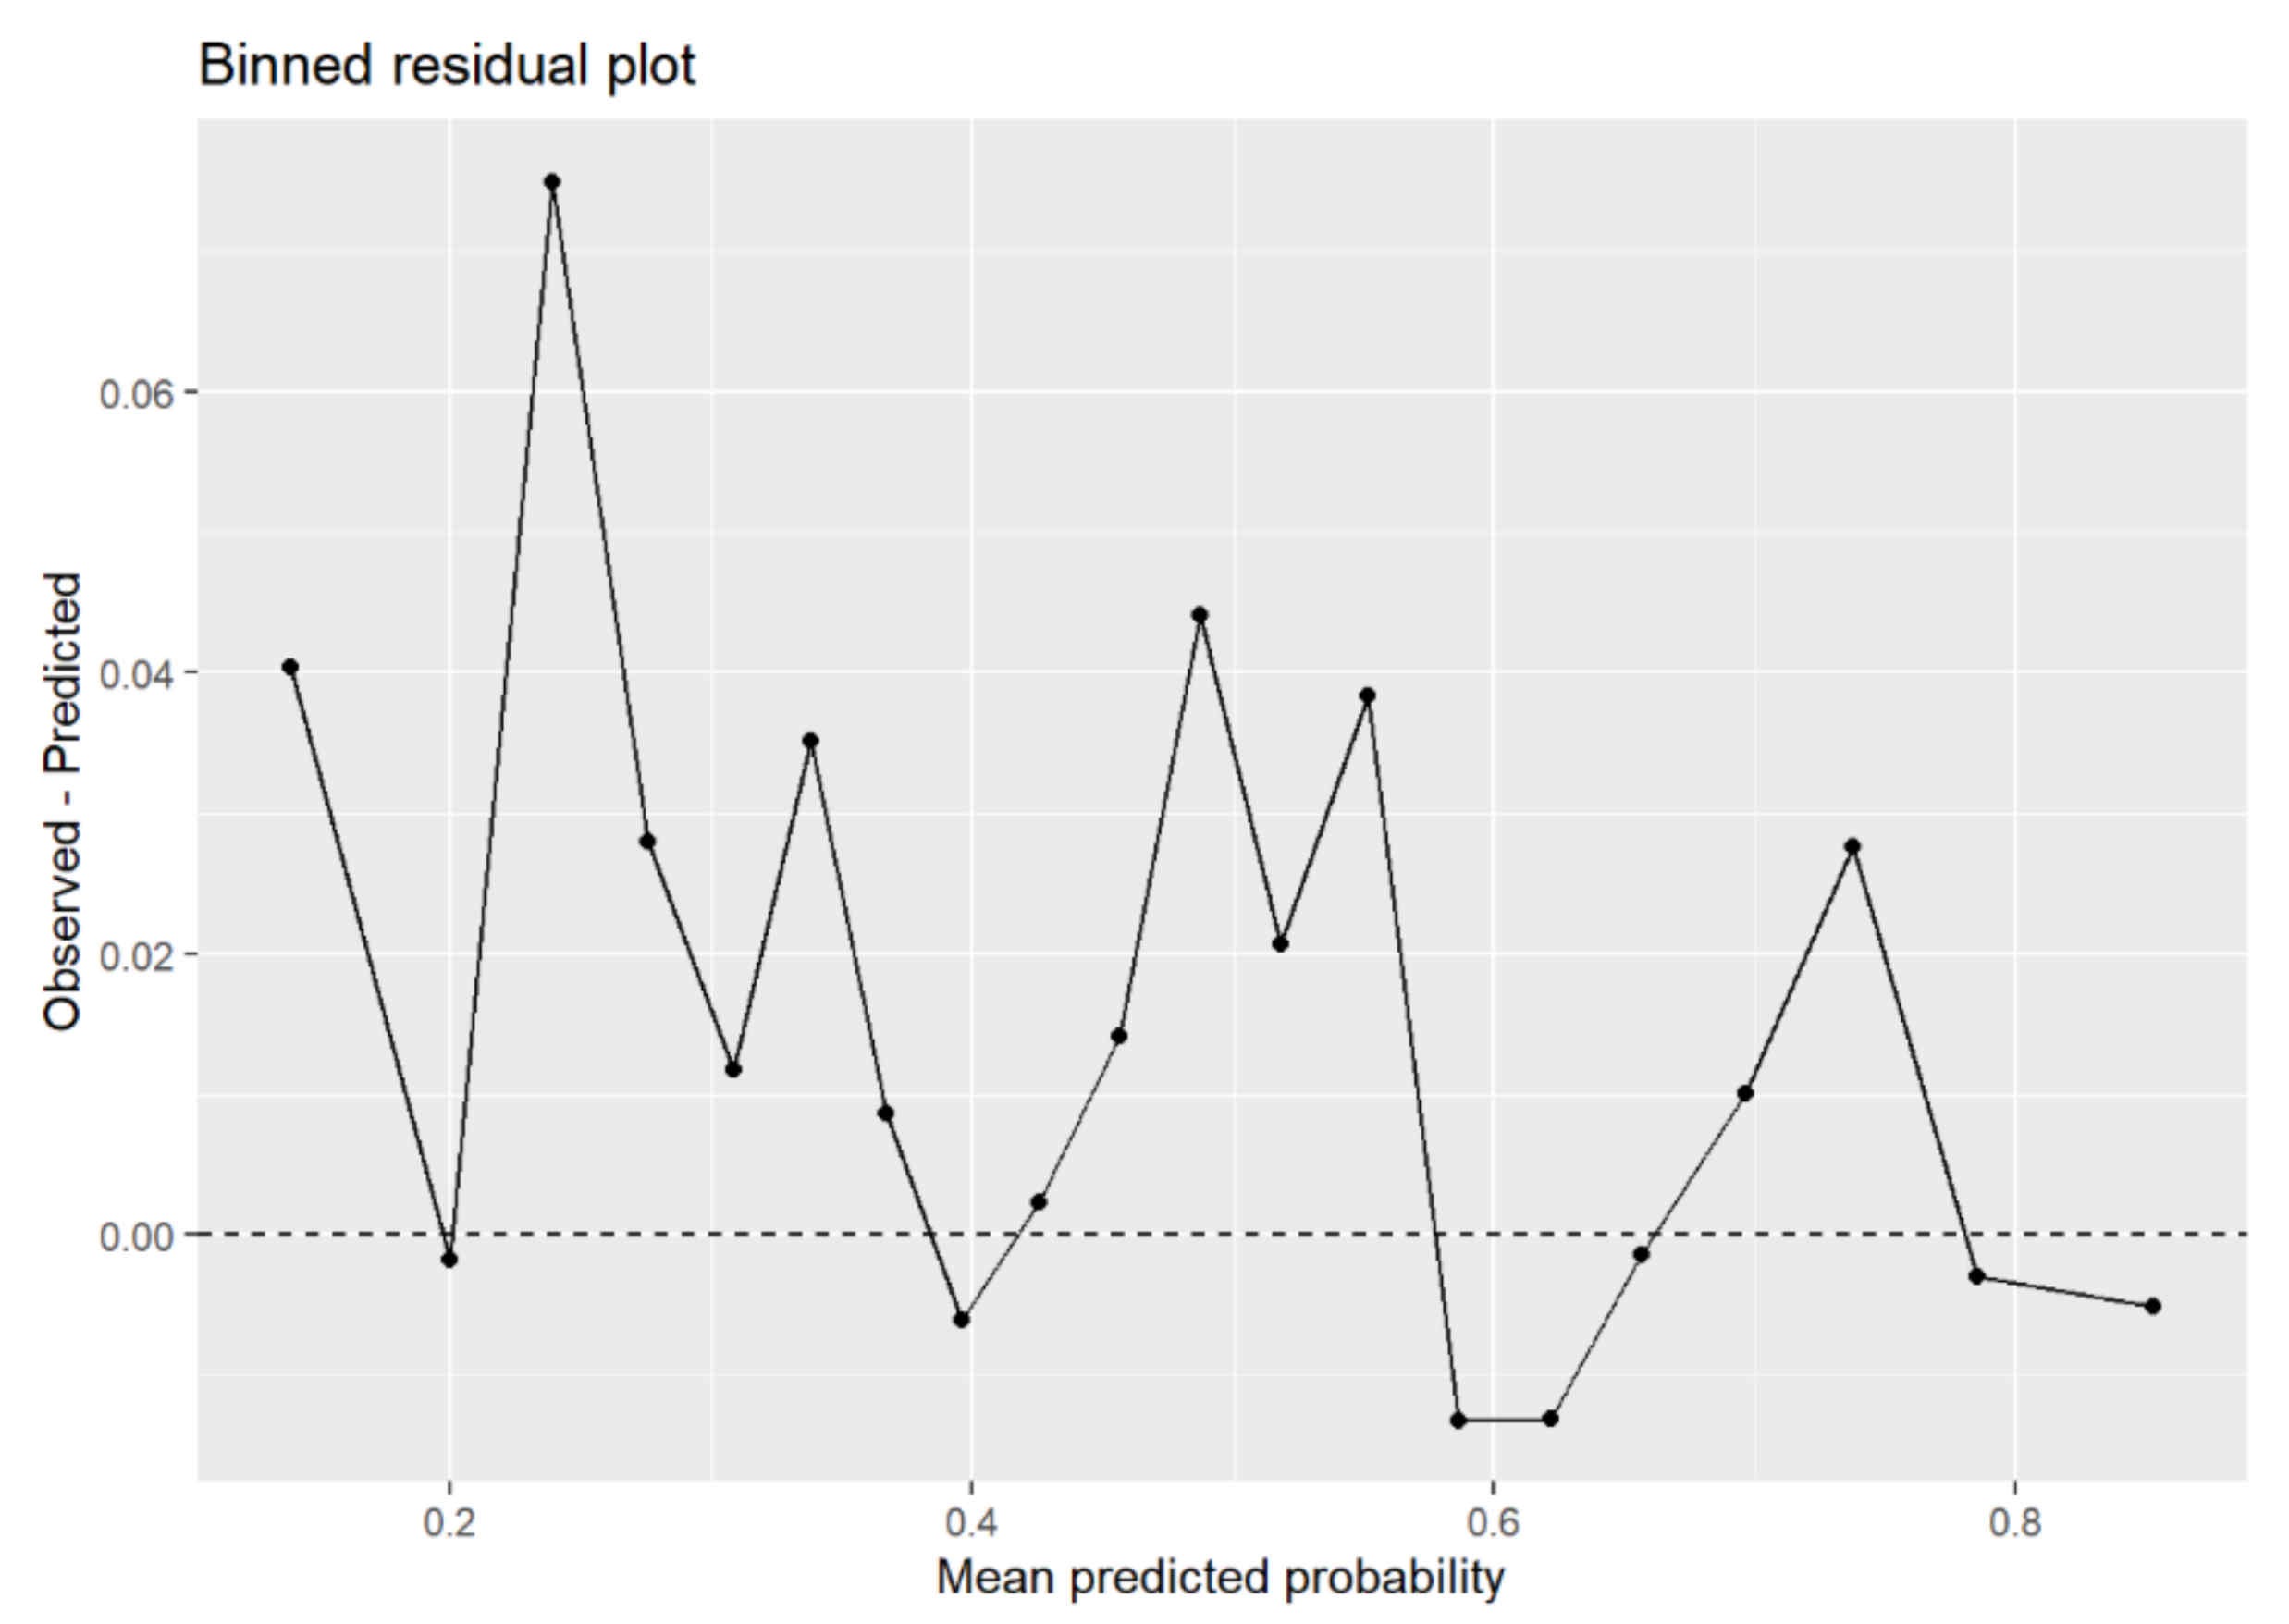
A binned residual plot was used to assess the goodness-of-fit of the logistic regression model. In this plot, residuals are grouped into bins based on the model’s predicted probabilities, and the average residual within each bin is plotted with confidence intervals. The points in the binned residual plot were generally centered around zero and fell within the expected confidence bands, suggesting that the model fits the data reasonably well and that there is no strong systematic pattern of over- or under-prediction across the range of predicted probabilities. This indicates that the logistic specification provides an adequate description of the relationship between the covariates and the probability of meeting physical activity guidelines.
| Diagnostic | Value |
| Sample size (N) | 9,471 |
| Number of model coefficients (p) | 35 |
| Max leverage | 0.4066 |
| 99th percentile leverage | 0.0209 |
| Leverage threshold (2p/N) | 0.0074 |
| Observations with leverage > 2p/N | 1,384 |
| Max |deviance residual| | 4.3476 |
| Observations with |deviance residual| > 3 | 123 |
Influential observation diagnostics were also conducted to evaluate whether any individual observations had an undue impact on the estimated regression coefficients. Measures such as leverage were examined to screen for influential cases. The summary of this screening indicated that no observations exceeded commonly used thresholds for influence, suggesting that the estimated associations were not driven by a small number of atypical respondents. Overall, the diagnostic checks provide reassurance that the model estimates are stable and not unduly affected by influential observations.
References
- U.S. Department of Health and Human Services. Physical Activity Guidelines for Americans, 2nd Edition. U.S. Department of Health and Human Services. odphp.health.gov/sites/default/files/2019-09/Physical_Activity_Guidelines_2nd_edition. [↩]
- C. A. Cortez, I. Yuefan Shao, M. J. Seamans, E. E. Dooley, K. Pettee Gabriel, J. M. Nagata. Moderate-to-vigorous intensity physical activity among U.S. adolescents before and during the COVID-19 pandemic: Findings from the Adolescent Brain Cognitive Development Study. Preventive Medicine Reports. Vol. 35, pg. 102344, 2023, https://doi.org/10.1016/j.pmedr.2023.102344. [↩]
- CDC MMWR. QuickStats: Percentage of children and adolescents aged 12–17 years who participated in 60 minutes of physical activity most days or every day, by daily hours of screen time use — United States, July 2021–December 2023. MMWR Morbidity and Mortality Weekly Report. Vol. 73, 2024, https://doi.org/10.15585/mmwr.mm7344a5. [↩]
- N. M. H. Pontes, W. M. Williams, M. C. F. Pontes. Interactions between race/ethnicity and gender on physical activity among US high school students: Youth Risk Behavior Survey 2011-2017. Journal of Pediatric Nursing. Vol. 60, pg. 100-108, 2021, https://doi.org/10.1016/j.pedn.2021.02.013. [↩]
- C. L. Merlo. Dietary and physical activity behaviors among high school students — Youth Risk Behavior Survey, United States, 2019. MMWR Supplements. Vol. 69, 2020, https://doi.org/10.15585/mmwr.su6901a8. [↩] [↩] [↩] [↩] [↩]
- N. M. H. Pontes, W. M. Williams, M. C. F. Pontes. Interactions between race/ethnicity and gender on physical activity among US high school students: Youth Risk Behavior Survey 2011-2017. Journal of Pediatric Nursing. Vol. 60, pg. 100-108, 2021, https://doi.org/10.1016/j.pedn.2021.02.013. [↩] [↩] [↩] [↩] [↩] [↩] [↩] [↩]
- R. Lowry, S. Michael, Z. Demissie, L. Kann, D. A. Galuska. Associations of physical activity and sedentary behaviors with dietary behaviors among US high school students. Journal of Obesity. Vol. 2015, pg. 876524, 2015, https://doi.org/10.1155/2015/876524. [↩] [↩]
- P. T. Veliz, J. Jardine, A. Cureton, M. Mutumba. Assessing the association between sport participation and suicide ideation and behaviors among middle and high school students in the U.S. between 2007 and 2023. Annals of Epidemiology. Vol. 108, pg. 8-15, 2025, https://doi.org/10.1016/j.annepidem.2025.05.017. [↩]
- D. R. Brown, D. A. Galuska, J. Zhang, et al. Psychobiology and behavioral strategies. Physical activity, sport participation, and suicidal behavior: U.S. high school students. Medicine & Science in Sports & Exercise. Vol. 39, pg. 2248-2257, 2007, https://doi.org/10.1249/mss.0b013e31815793a3. [↩] [↩]
- S. L. Michael, R. Lowry, C. Merlo, A. C. Cooper, E. T. Hyde, R. McKeon. Physical activity, sedentary, and dietary behaviors associated with indicators of mental health and suicide risk. Preventive Medicine Reports. Vol. 19, pg. 101153, 2020, https://doi.org/10.1016/j.pmedr.2020.101153. [↩]
- C. H. Wang, N. Peiper. Association between physical activity and sedentary behavior with depressive symptoms among US high school students, 2019. Preventing Chronic Disease. Vol. 19, pg. E76, 2022, https://doi.org/10.5888/pcd19.220003. [↩] [↩] [↩]
- L. P. Dale, L. Vanderloo, S. Moore, G. Faulkner. Physical activity and depression, anxiety, and self-esteem in children and youth: An umbrella systematic review. Mental Health and Physical Activity. Vol. 16, pg. 66-79, 2019, https://doi.org/10.1016/j.mhpa.2018.12.001. [↩]
- T. Ren, X. Ye, Z. Li, et al. Associations between physical activity and proactive control and the modulating role of working memory. Psychology of Sport and Exercise. Vol. 66, pg. 102374, 2023, https://doi.org/10.1016/j.psychsport.2022.102374. [↩] [↩]
- X. Zhang, J. Yun. The relationship between high-quality physical education, physical literacy, and physical activity participation: A retrospective study from U.S. college students. Research Quarterly for Exercise and Sport. pg. 1-10, 2025, https://doi.org/10.1080/02701367.2025.2472943. [↩]
- R. Lowry, S. M. Lee, J. E. Fulton, Z. Demissie, L. Kann. Obesity and other correlates of physical activity and sedentary behaviors among US high school students. Journal of Obesity. Vol. 2013, pg. 276318, 2013, https://doi.org/10.1155/2013/276318. [↩]
- L. Jiang, L. J. Cheskin, C. L. Frankenfeld, Z. H. Rana, L. de Jonge. Loneliness is associated with unhealthful dietary behaviors and physical inactivity among US college students. Journal of American College Health. Vol. 72, pg. 2932-2937, 2024, https://doi.org/10.1080/07448481.2022.2141060. [↩]
- S. L. Michael, J. Li, S. Sliwa, K. Cornett, M. Hertz. Association between adolescent self-reported physical activity behaviors and feeling close to people at school during the COVID-19 pandemic. American Journal of Lifestyle Medicine. Vol. 18, pg. 364-375, 2024, https://doi.org/10.1177/15598276231157324. [↩]
- K. Cornett, S. L. Michael, S. Sliwa, et al. Physical activity behaviors and negative safety and violence experiences among high school students – Youth Risk Behavior Survey, United States, 2023. MMWR Supplements. Vol. 73, pg. 94-103, 2024, https://doi.org/10.15585/mmwr.su7304a11. [↩]
- Y. Kuroda, T. Ishihara, K. Kamijo. Balancing academics and athletics: School-level athletes’ results are positively associated with their academic performance. Trends in Neuroscience and Education. Vol. 33, pg. 100210, 2023, https://doi.org/10.1016/j.tine.2023.100210. [↩]
- S. Chen, X. Li, J. Yan, Z. Ren. To be a sportsman? Sport participation is associated with optimal academic achievement in a nationally representative sample of high school students. Frontiers in Public Health. Vol. 9, pg. 730497, 2021, https://doi.org/10.3389/fpubh.2021.730497. [↩]
- R. M. Ferreira Silva, C. R. Mendonça, V. D. Azevedo, A. Raoof Memon, P. R. E. S. Noll, M. Noll. Barriers to high school and university students’ physical activity: A systematic review. PLOS ONE. Vol. 17, pg. e0265913, 2022, https://doi.org/10.1371/journal.pone.0265913. [↩]
- O. Alliott, M. Ryan, H. Fairbrother, E. van Sluijs. Do adolescents’ experiences of the barriers to and facilitators of physical activity differ by socioeconomic position? A systematic review of qualitative evidence. Obesity Reviews. Vol. 23, pg. e13374, 2022, https://doi.org/10.1111/obr.13374. [↩]
- B. A. Sibley, J. L. Etnier. The relationship between physical activity and cognition in children: A meta-analysis. Pediatric Exercise Science. Vol. 15, pg. 243-256, 2003, https://doi.org/10.1123/pes.15.3.243. [↩] [↩]
- P. D. Tomporowski. Cognitive and behavioral responses to acute exercise in youths: A review. Pediatric Exercise Science. Vol. 15, pg. 348-359, 2003, https://doi.org/10.1123/pes.15.4.348. [↩] [↩]
- T. T. K. Huang, M. I. Goran, D. Spruijt-Metz. Associations of adiposity with measured and self-reported academic performance in early adolescence. Obesity. Vol. 14, pg. 1839-1845, 2006, https://doi.org/10.1038/oby.2006.212. [↩] [↩]
- R. H. O. Araujo, A. O. Werneck, G. M. Jesus, et al. Association between participation in physical education classes and physical activity among 284,820 adolescents: A progressive exposure gradient analysis. Pediatric Exercise Science. 2024, https://doi.org/10.1123/pes.2023-0154. [↩] [↩]
- A. J. Daley, J. Ryan. Academic performance and participation in physical activity by secondary school adolescents. Perceptual and Motor Skills. Vol. 91, pg. 531-534, 2000, https://doi.org/10.2466/pms.2000.91.2.531. [↩] [↩]
- H. A. Kalantari, S. Esmaeilzadeh. Association between academic achievement and physical status including physical activity, aerobic and muscular fitness tests in adolescent boys. Environmental Health and Preventive Medicine. Vol. 21, pg. 27-33, 2016, https://doi.org/10.1007/s12199-015-0495-x. [↩] [↩]
- M. Dos Santos, G. Ferrari, D. H. Lee, et al. Association of the “weekend warrior” and other leisure-time physical activity patterns with all-cause and cause-specific mortality: A nationwide cohort study. JAMA Internal Medicine. Vol. 182, pg. 840-848, 2022, https://doi.org/10.1001/jamainternmed.2022.2488. [↩]
- World Health Organization. Recommended population levels of physical activity for health. In: Global recommendations on physical activity for health. World Health Organization, 2010, https://www.ncbi.nlm.nih.gov/books/NBK305058/. [↩]
- P. D. Loprinzi. Frequency of moderate-to-vigorous physical activity (MVPA) is a greater predictor of systemic inflammation than total weekly volume of MVPA: Implications for physical activity promotion. Physiology & Behavior. Vol. 141, pg. 46-50, 2015, https://doi.org/10.1016/j.physbeh.2015.01.002. [↩]
- T. Nakagawa, I. Koan, C. Chen, et al. Regular moderate- to vigorous-intensity physical activity rather than walking is associated with enhanced cognitive functions and mental health in young adults. International Journal of Environmental Research and Public Health. Vol. 17, pg. 614, 2020, https://doi.org/10.3390/ijerph17020614. [↩]
- J. Valero-Elizondo, J. A. Salami, C. U. Osondu, et al. Economic impact of moderate-vigorous physical activity among those with and without established cardiovascular disease: 2012 Medical Expenditure Panel Survey. Journal of the American Heart Association. Vol. 5, pg. e003614, 2016, https://doi.org/10.1161/JAHA.116.003614. [↩]
- K. Morgan, B. Hallingberg, H. Littlecott, et al. Predictors of physical activity and sedentary behaviours among 11-16 year olds: Multilevel analysis of the 2013 Health Behaviour in School-aged Children (HBSC) study in Wales. BMC Public Health. Vol. 16, pg. 569, 2016, https://doi.org/10.1186/s12889-016-3213-8. [↩]
- Centers for Disease Control and Prevention. Youth risk behavior surveillance — United States, 2009. https://www.cdc.gov/mmwr/preview/mmwrhtml/ss5905a1.htm, 2010. [↩]
- The Comprehensive R Archive Network. https://cran.r-project.org/, 2025. [↩]
- D B. Do, C. Kirkland, G. M. Besenyi, C. Smock, K. Lanza. Youth physical activity and the COVID-19 pandemic: A systematic review. Preventive Medicine Reports. Vol. 29, pg. 101959, 2022, https://doi.org/10.1016/j.pmedr.2022.101959. [↩]
- J. M. Alves, A. G. Yunker, A. DeFendis, A. H. Xiang, K. A. Page. BMI status and associations between affect, physical activity and anxiety among U.S. children during COVID-19. Pediatric Obesity. Vol. 16, pg. e12786, 2021, https://doi.org/10.1111/ijpo.12786. [↩] [↩]
- A. Moradell, J. A. Casajús, L. A. Moreno, G. Vicente-Rodríguez, A. Gómez-Cabello. Effects of diet—exercise interaction on human health across a lifespan. Nutrients. Vol. 15, pg. 2520, 2023, https://doi.org/10.3390/nu15112520. [↩]
- J. E. Donnelly, C. H. Hillman, D. Castelli, et al. Physical activity, fitness, cognitive function, and academic achievement in children: A systematic review. Medicine & Science in Sports & Exercise. Vol. 48, pg. 1197-1222, 2016, https://doi.org/10.1249/MSS.0000000000000901. [↩]
- F. Gomez-Pinilla, C. Hillman. The influence of exercise on cognitive abilities. Comprehensive Physiology. Vol. 3, pg. 403-428, 2013, https://doi.org/10.1002/cphy.c110063. [↩]
- L. Liu, X. Xin, Y. Zhang. The effects of physical exercise on cognitive function in adolescents: A systematic review and meta-analysis. Frontiers in Psychology. Vol. 16, pg. 1556721, 2025, https://doi.org/10.3389/fpsyg.2025.1556721. [↩]
- J. James, A. Pringle, S. Mourton, C. M. P. Roscoe. The effects of physical activity on academic performance in school-aged children: A systematic review. Children. Vol. 10, pg. 1019, 2023, https://doi.org/10.3390/children10061019. [↩]
- K. E. Foti, D. K. Eaton, R. Lowry, L. R. McKnight-Ely. Sufficient sleep, physical activity, and sedentary behaviors. American Journal of Preventive Medicine. Vol. 41, pg. 596-602, 2011, https://doi.org/10.1016/j.amepre.2011.08.009. [↩]
- H E. T. Hyde, K. B. Watson, J. D. Omura, et al. Surveillance of meeting the youth physical activity guideline: Impact of including vigorous-intensity and bone-strengthening activities. Research Quarterly for Exercise and Sport. Vol. 93, pg. 728-733, 2022, https://doi.org/10.1080/02701367.2021.1914303. [↩]
- R. S. Strauss. Comparison of measured and self-reported weight and height in a cross-sectional sample of young adolescents. International Journal of Obesity. Vol. 23, pg. 904-908, 1999, https://doi.org/10.1038/sj.ijo.0800971. [↩]


