
Abstract
Oral squamous cell carcinoma (OSCC) is a major global health burden, and most cases arise through stepwise malignant transformation of oral potentially malignant disorders (OPMDs). Conventional tissue biopsy provides only a static snapshot of disease status and fails to capture the dynamic molecular changes occurring during progression. This study aimed to develop a saliva-based, time-series biomarker model capable of predicting malignant transformation in OPMD and to translate these molecular findings into a rapid, point-of-care diagnostic platform. Saliva samples were collected twice weekly from OPMD patients over 12 weeks, and four key biomarkers—IL-8, TNF-α, MMP-9, and CYFRA21-1—were quantified by ELISA. The longitudinal analysis revealed sequential biomarker patterns, with IL-8 and MMP-9 rising in parallel, reflecting a progression from inflammation to matrix degradation. In vitro validation using TNF-α–treated human oral keratinocytes (HOKs) confirmed that inflammatory stimulation induces IL-8 secretion, cell migration, and invasion, thereby mimicking the in vivo transition process. Transcriptomic profiling of clinical samples further identified POSTN (periostin) as a key hub gene linking inflammatory signaling with extracellular matrix remodeling. ELISA validation demonstrated a stepwise increase in salivary POSTN concentrations across disease stages, confirming its translational potential as a novel, non-invasive biomarker. Finally, a lateral flow assay (LFA) prototype targeting POSTN was developed using N- and C-terminal antibody pairs conjugated to gold nanoparticles, enabling visual detection of POSTN within 10 minutes. Together, this study aimed to determine whether longitudinal salivary biomarker dynamics could distinguish OPMD lesions with histologically confirmed high-risk features from clinically stable OPMD.
Keywords: Oral potentially malignant disorders (OPMD), saliva, POSTN, Lateral flow assay (LFA)
Introduction
Oral squamous cell carcinoma (OSCC) is the sixth most common cancer worldwide, with a five-year survival rate of only about 50–60%1,2. The primary reason for this poor prognosis is that most patients are diagnosed at an invasive stage3,4,5. Oral potentially malignant disorders (OPMDs) represent a precancerous stage preceding this transformation6, progressing to malignancy through years of inflammatory and stromal remodeling processes7.
However, tissue biopsies currently used clinically provide only a single-point pathological snapshot, lacking the ability to reflect the disease’s temporal dynamics8,9,10. Saliva is a non-invasive bodily fluid sample11,12,13 that directly reflects oral metabolism and immune responses. Therefore, quantitatively analyzing the temporal pattern changes of biomarkers in saliva can capture dynamic signals of disease progression that are difficult to detect with static tissue biopsies.
In this study, we hypothesized that longitudinal, personalized salivary biomarker monitoring can identify molecular features associated with histologically high-risk OPMD, thereby supporting non-invasive risk stratification rather than prospective prediction of malignant transformation.
From this perspective, this study aimed to:
The aims of this study were to predict malignant transformation in OPMD using longitudinal salivary biomarker data, elucidate the inflammatory pathways driving matrix remodeling and cell infiltration using in vitro cellular models, identify novel molecular targets through transcriptomic analysis of clinical samples, and develop a POSTN-based point-of-care diagnostic lateral flow assay (LFA).
Through this, the study highlights an integrated understanding of the malignant transformation axis in OPMD—“inflammation–stroma–infiltration–invasion”—and presents a POSTN-centered predictive platform that can be extended into a non-invasive, saliva-based diagnosis system.
Materials & Methods
Human saliva sample collection and ethics approval
This study was conducted with approval from the Institutional Review Board (IRB approval no. P01-202506-02-009), and written informed consent was obtained from all participants.
Unstimulated whole saliva samples were collected from patients diagnosed with OPMDs and healthy volunteers. Participants were instructed to refrain from eating, drinking, or smoking for at least one hour before sample collection.
Group classification
Healthy group (n = 5): adults with no clinical oral lesions.
OPMD-Stable group (n = 5): clinically diagnosed OPMD (e.g., leukoplakia) without morphological changes for ≥6 months.
OPMD-Progressor group (n = 5): histologically confirmed dysplasia or microinvasive lesions.
Histopathological evaluation of OPMD lesions was performed by board-certified oral pathologists. Epithelial dysplasia was graded as mild, moderate, or severe based on established architectural and cytological criteria. OPMD-Progressor cases were defined as patients with histologically confirmed epithelial dysplasia or microinvasive carcinoma identified at or prior to enrollment, rather than progression observed during the 12-week monitoring period.
The clinical and histopathological characteristics of all enrolled participants are summarized in Supplementary Table 1.
Approximately 2 mL of unstimulated saliva was collected into sterile tubes, stored on ice, and centrifuged at 10,000 × g for 10 min at 4 °C. The supernatant and cell pellet were separated for protein and RNA analyses, respectively, and stored at −80 °C until use.
Salivary biomarker time-series analysis
Saliva samples from OPMD patients were collected twice weekly for 12 weeks (24 total samples per patient), yielding up to 24 time points per participant. For longitudinal visualization in the main figures, measurements were summarized into 2-week intervals by averaging values within each bin. This temporal aggregation was applied to reduce short-term variability associated with high-frequency sampling and to facilitate interpretation of longer-term biomarker trends. Longitudinal biomarker measurements were analyzed descriptively to characterize within-individual temporal patterns. No formal hypothesis testing or p-value–based comparisons were performed across repeated time points; therefore, multiple testing correction was not applied.
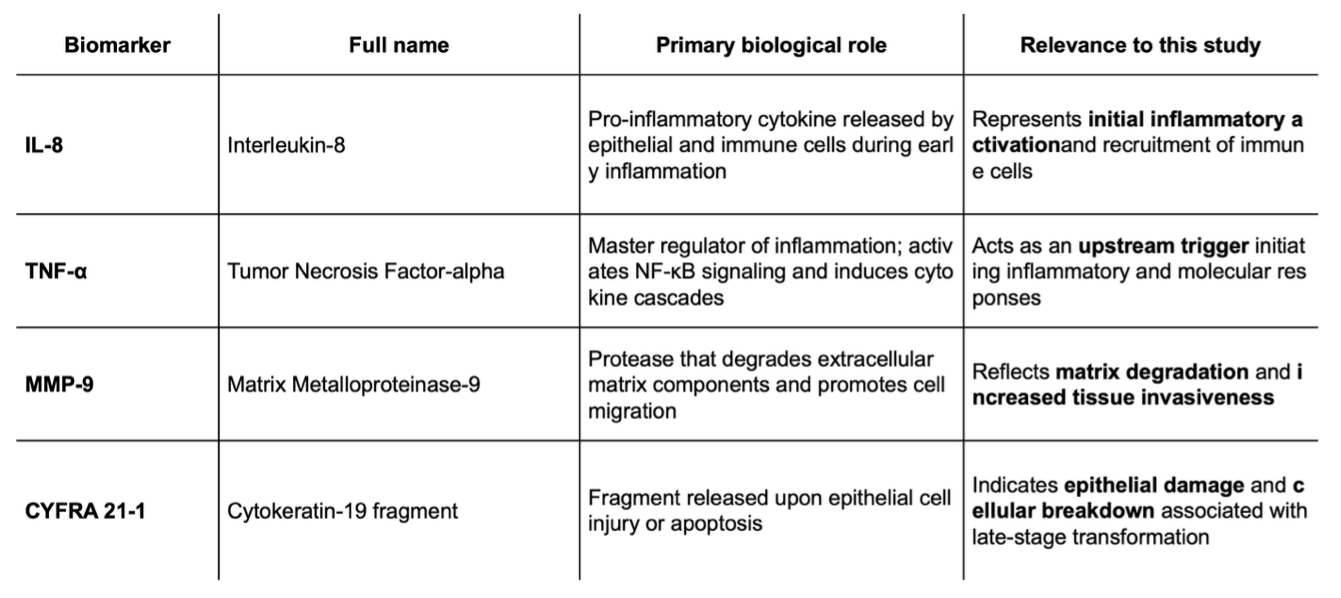
Samples were mixed with a protease inhibitor cocktail (Sigma-Aldrich, P8340) and stored at −80 °C. Four key biomarkers—IL-8, TNF-α, MMP-9, and CYFRA21-1—were quantified using commercial ELISA kits (R&D Systems, USA) according to the manufacturer’s protocols.
Total protein concentration was determined using the BCA Protein Assay Kit (Thermo Fisher), and biomarker levels were normalized to total protein content. Baseline values were defined as the mean of the first two time points for each patient, and relative deviations were expressed as Z-scores. Values with Z ≥ 2.0 were considered statistically significant increases.
HOK cell culture and TNF-α stimulation
Human Oral Keratinocytes (HOK; Korea Cell Line Bank) were cultured in Keratinocyte Serum-Free Medium (Gibco, USA) supplemented with 0.05 mg/mL bovine pituitary extract (BPE) and 5 ng/mL epidermal growth factor (EGF). Cells were maintained at 37 °C in a humidified incubator with 5% CO₂.
At 80% confluence, cells were treated with 10 ng/mL TNF-α (PeproTech, USA) to induce an inflammatory response. Culture supernatants were collected at 6, 24, and 48 h post-treatment, and IL-8 levels were measured using the Human IL-8 Quantikine ELISA Kit (R&D Systems, D8000C). Each experiment was performed in triplicate, and results were expressed as mean ± SD.
Scratch and invasion assays
Scratch assay:
HOK cells were seeded in 6-well plates and grown to ~90% confluence.
A straight scratch was made using a sterile 200 µL pipette tip, and the wells were rinsed with PBS to remove detached cells. Cells were cultured in serum-free medium with or without 10 ng/mL TNF-α for 24 h. Wound areas at 0 h and 24 h were photographed (Leica DMi8) and analyzed using ImageJ to calculate wound closure rates.
Invasion assay:
Matrigel-coated Transwell chambers (8 µm pore, Corning) were used. HOK cells (1 × 10⁵) were seeded in the upper chamber, and medium containing 10% FBS was added to the lower chamber. After 24 h incubation with or without 10 ng/mL TNF-α, invaded cells on the lower surface were fixed, stained with crystal violet, and counted under a microscope.
RNA extraction and sequencing
Total RNA was extracted from the saliva-derived cell pellets using TRIzol Reagent (Invitrogen). RNA quality was assessed using a NanoDrop 2000 (Thermo Fisher), and samples with RIN ≥ 7.0 were used for sequencing.
RNA libraries were prepared using the Illumina TruSeq RNA Sample Preparation Kit and sequenced on the Illumina NovaSeq 6000 platform (150 bp paired-end reads). Quality control was performed with FastQC, and adapters were trimmed using Trimmomatic. Reads were aligned to the human genome (GRCh38) using HISAT2.
Differentially expressed genes (DEGs) were identified using DESeq2 (R package) with thresholds of |log₂FC| > 1 and adjusted p < 0.05. Gene Ontology (GO) pathway enrichment analyses were performed using clusterProfiler, and results were visualized with pheatmap.
Gene set enrichment analysis (GSEA)
Gene set enrichment analysis (GSEA) was performed using the clusterProfiler package. The GSEA() function was applied using gene sets derived from the MSigDB Hallmark collection. Genes were ranked based on log2 fold-change values obtained from differential expression analysis.
ELISA validation for POSTN
POSTN protein concentrations in saliva were quantified using the Human Periostin ELISA Kit (Cloud-Clone Corp., SEA934Hu). Samples were diluted 1:2 and analyzed according to the manufacturer’s instructions. Absorbance was measured at 450 nm using a microplate reader, and POSTN concentrations were calculated based on standard curves (0–200 ng/mL). Data were analyzed using one-way ANOVA followed by Tukey’s post-hoc test (p < 0.05).
Lateral flow assay (LFA) fabrication
The LFA strip consisted of a sample pad, conjugate pad, nitrocellulose membrane, absorbent pad, and backing card.
Gold conjugate: 40 nm gold nanoparticles (Cytodiagnostics, Canada) were conjugated to anti-POSTN (C-terminal) antibodies (Abcam, ab14041) via EDC/NHS coupling. Test line: anti-POSTN (N-terminal) antibodies (Sigma, MKB-SAB2101847) were immobilized on the nitrocellulose membrane at 1 mg/mL. Control line: anti-human IgG antibodies (Sigma-Aldrich) were printed at 0.5 mg/mL.Sample pads (glass fiber, Ahlstrom) and absorbent pads (Whatman CF5) were assembled on adhesive backing cards and dried at 37 °C for 24 h.
During testing, 800 µL of saliva sample was applied to the sample pad, and visible color development was evaluated after 10 min. 800 µL of whole saliva was applied directly to the sample pad. Despite the inherent viscosity of saliva, consistent flow across the nitrocellulose membrane was achieved through capillary action facilitated by the absorbent pad and device configuration. No additional dilution or running buffer was used unless otherwise stated
Z-score calculation
For each participant, an individual baseline was established using the mean and standard deviation of biomarker concentrations measured during the initial monitoring period. Z-scores were calculated for subsequent time points as (value − individual baseline mean) / baseline standard deviation. A Z-score threshold of ≥ 2.0 was used as an alert criterion to flag marked deviations from individual baseline levels.
Statistical analysis
All data are presented as mean ± standard deviation (SD). Comparisons between groups were performed using Student’s t-test or one-way ANOVA as appropriate. Statistical analyses were performed using GraphPad Prism 10.0 and R (v4.2.2), with p < 0.05 considered statistically significant. Statistical analyses were primarily descriptive in nature, focusing on within-individual longitudinal trends using baseline-normalized Z-scores. Inferential statistical tests were applied only to aggregated or summary measures to avoid violation of independence assumptions inherent to repeated-measures data. Longitudinal trajectories were visualized and interpreted descriptively rather than subjected to repeated inferential testing.
Results
Predictive Modeling for Malignant Transformation in OPMDs using Salivary Time-Series Data
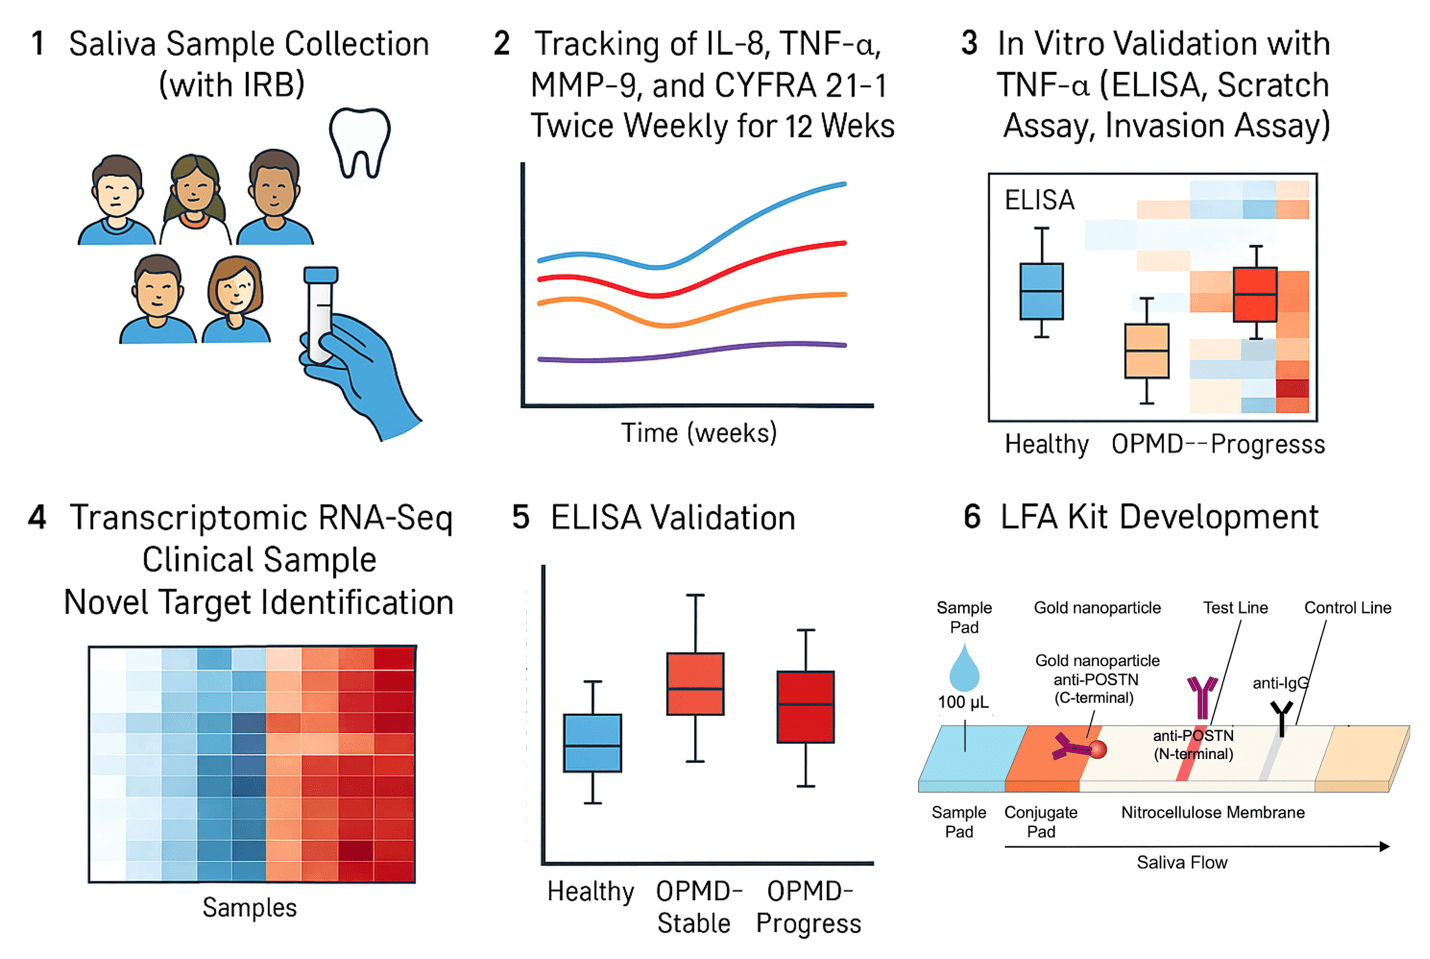
Saliva samples were collected twice weekly from OPMD patients following the establishment of an individual baseline. The concentrations of four key biomarkers—IL-8, TNF-α, MMP-9, and CYFRA21-1—were quantified14,15,16. This time-series data was then used to calculate the rate of change (time-series deviation) relative to each patient’s personalized baseline. Subsequently, the trend in inflammation and cellular damage-related patterns over time was analyzed (Fig. 1).
These results indicate that the model effectively distinguishes dynamic biomarker trajectories associated with malignant transformation, supporting its potential use as an alert system for clinical surveillance.
Temporal dynamics of salivary biomarkers
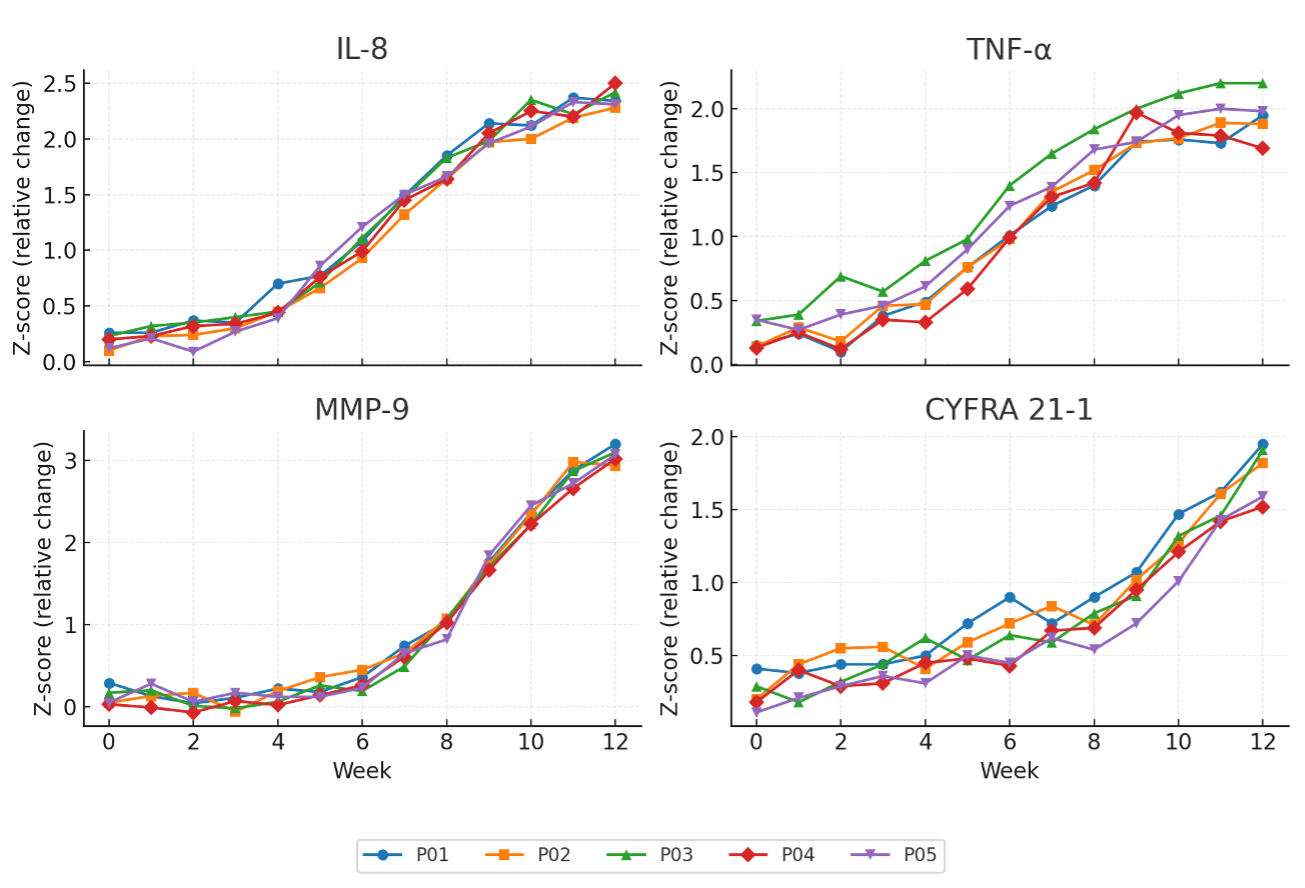
The temporal changes of four salivary biomarkers—IL-8, TNF-α, MMP-9, and CYFRA21-1—were analyzed in five patients with OPMD over a 12-week observation period (Fig. 2).
All concentrations were normalized to total protein and converted to Z-scores relative to each individual’s baseline, allowing direct comparison of relative temporal changes. IL-8 levels remained relatively stable during the initial 4 weeks, followed by a gradual and consistent increase beginning at week 6. By weeks 10–12, most patients showed Z-scores exceeding 2.0, indicating a pronounced time-dependent rise in IL-8 concentration. TNF-α exhibited a similar upward trajectory but with slightly higher variability during the early phase (weeks 2–4); in later weeks, its Z-scores converged between 1.5 and 2.0 across patients. MMP-9 displayed the most distinct late-phase activation pattern. After week 8, a rapid increase was observed, reaching peak Z-scores around 3.0 by week 12 in nearly all participants. Although data are visualized as Z-scores to emphasize within-individual changes, the corresponding absolute concentration ranges indicate that these deviations reflect biologically measurable differences.
This trend suggests that matrix-degrading enzyme activation occurs during the latter stages of disease progression. In contrast, CYFRA21-1 demonstrated a slower, more gradual elevation, showing modest changes until week 8 and then rising steadily toward weeks 10–12, implying a delayed cellular damage response.
Sensitivity analyses using alternative alert thresholds (Z ≥ 1.5 and Z ≥ 2.5) demonstrated similar qualitative separation between OPMD-Progressor and OPMD-Stable cases, indicating that the observed patterns were not driven by a single arbitrary cut-off. In particular, IL-8 and MMP-9 showed concurrent increases, suggesting a closely linked temporal relationship between inflammatory activation and matrix remodeling. This finding suggests that the inflammatory environment in OPMD may progress sequentially—from early cytokine activation (IL-8, TNF-α) to subsequent matrix degradation (MMP-9) and late epithelial damage (CYFRA21-1).
In Vitro Validation of Biomarker Cascade
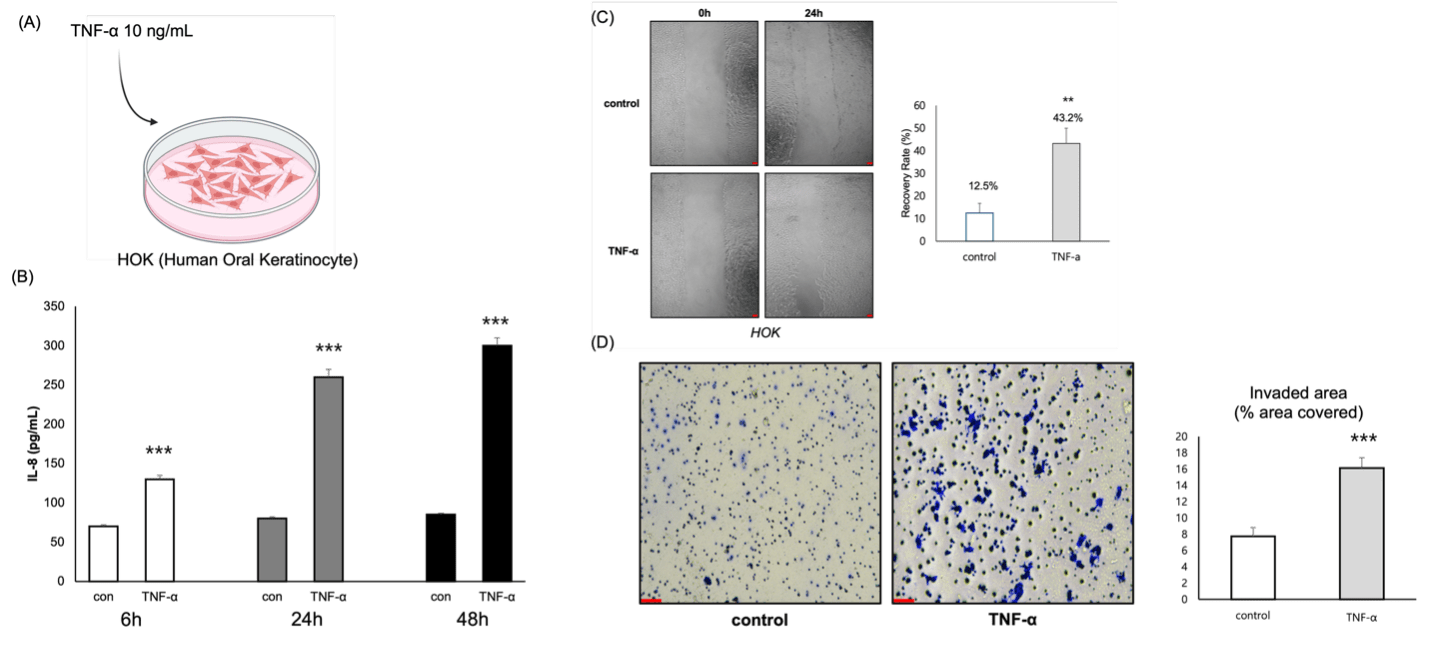
(A) Schematic diagram showing TNF-α (10 ng/mL) stimulation in human oral keratinocytes (HOKs).
(B) ELISA assay showing time-dependent increases in IL-8 secretion after TNF-α treatment. Data represent mean ± SD from n = 3 independent biological replicates. (***p < 0.001).
(D)Scratch assay demonstrating enhanced cell migration in TNF-α–treated HOKs compared with control. Data represent mean ± SD from n = 3 independent biological replicates. Scale bar =100 µm. (**p < 0.01).
(D)Invasion assay showing increased numbers of invading cells following TNF-α stimulation. Scale bar =50 µm
To confirm whether the concomitant elevation of IL-8, TNF-α, and MMP-9 observed in the salivary time-series analysis was reproducible at the epithelial cell level, we treated Human Oral Keratinocyte (HOK) cells with the inflammatory cytokine TNF-α (10 ng/mL) to assess inflammatory response and cellular behavioral changes (Fig. 3A). TNF-α was used to mimic the inflammatory microenvironment observed in OPMD patients, allowing us to verify whether inflammatory stimulation induces IL-8 secretion and invasive behavior in oral keratinocytes.
IL-8 ELISA results showed higher IL-8 secretion in the TNF-α-stimulated group compared to the control at 6, 24, and 48 hours. The increase was time-dependent, escalating approximately 2.5- to 3.5-fold (Fig. 3B), indicating that TNF-α induces inflammatory cytokine expression in HOK cells.
The Scratch assay demonstrated a prominent promotion of cell migration in the TNF-α-treated group. The recovery rate after 24 hours was 43.2% in the TNF-α group, an approximately 3.5-fold increase compared to the control rate of 12.5% (p<0.01; Fig. 3C).
The Invasion assay showed a similar trend, with the number of invading cells passing through the Matrigel membrane more than doubling in the TNF-α group relative to the control (Fig. 3D).
These findings suggest that TNF-α stimulation not only induces inflammation but also enhances the cells’ capacity for matrix degradation and invasion, potentially accelerating the malignant transformation process.
Transcriptomic characterization of molecular alterations in OPMD
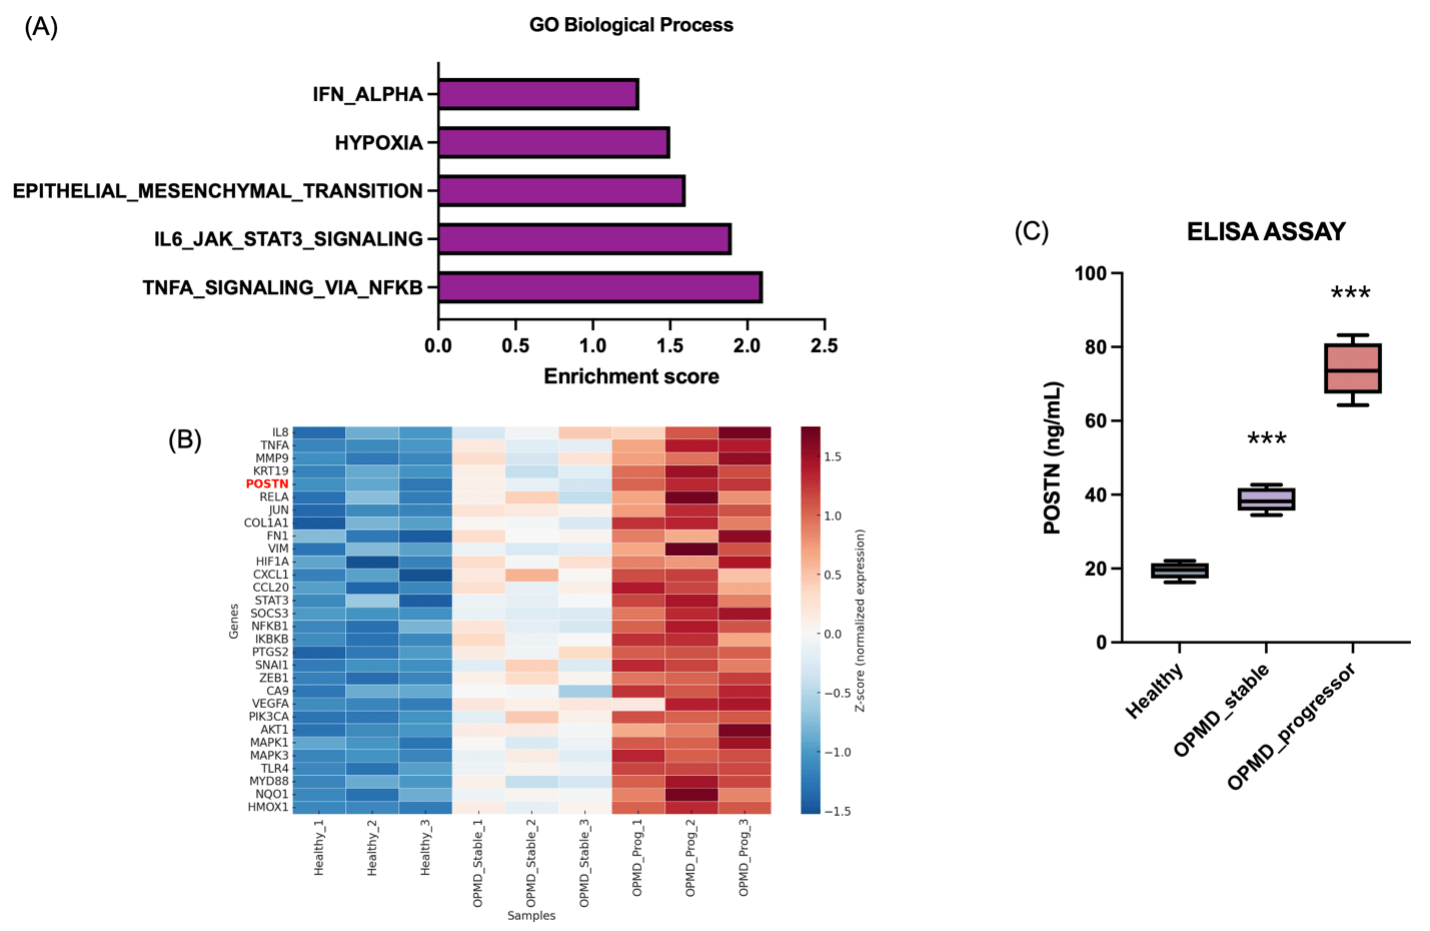
(A) Gene Ontology (GO) pathway enrichment analysis showing significant activation of inflammation and extracellular matrix–related pathways in OPMD samples.
(B) Heatmap of 30 representative genes illustrating progressive upregulation of POSTN and ECM remodeling markers in the OPMD-Progressor group compared with Healthy and OPMD-Stable samples.
(C) ELISA validation confirming a stage-dependent increase in salivary POSTN concentrations across Healthy, OPMD-Stable, and OPMD-Progressor groups (***p < 0.001).
Transcriptomic profiling of exfoliated oral epithelial cells revealed distinct molecular differences between healthy individuals and patients with OPMDs.
Gene set enrichment analysis (GSEA) demonstrated significant upregulation of NF-κB signaling, cytokine–cytokine receptor interaction, IL-6/JAK/STAT3, ECM–receptor interaction, epithelial–mesenchymal transition (EMT), and PI3K–AKT pathways in the OPMD group (Fig. 4A). These enriched pathways are closely associated with chronic inflammation, enhanced cell motility, and matrix remodeling, consistent with the observed elevation of salivary IL-8, TNF-α, and MMP-9.
Notably, POSTN (periostin) expression was markedly increased in the OPMD-Progressor subgroup, clustering with other extracellular matrix–related genes such as COL1A1, FN1, and VIM (Fig. 4B). This upregulation suggests early activation of tissue remodeling and invasion processes during malignant transformation.
To validate these transcriptomic findings at the protein level, POSTN concentrations in saliva were measured using ELISA (Fig. 4C).
Consistent with the sequencing data, salivary POSTN levels showed a stepwise increase—approximately 19.4 ng/mL in the Healthy group, 38.6 ng/mL in OPMD-Stable, and 74.0 ng/mL in OPMD-Progressor samples (p < 0.001).
These results confirm that POSTN is upregulated both transcriptionally and translationally during OPMD progression, supporting its potential as a novel, non-invasive biomarker for malignant transformation.
Development of a lateral flow assay (LFA) prototype for salivary POSTN detection
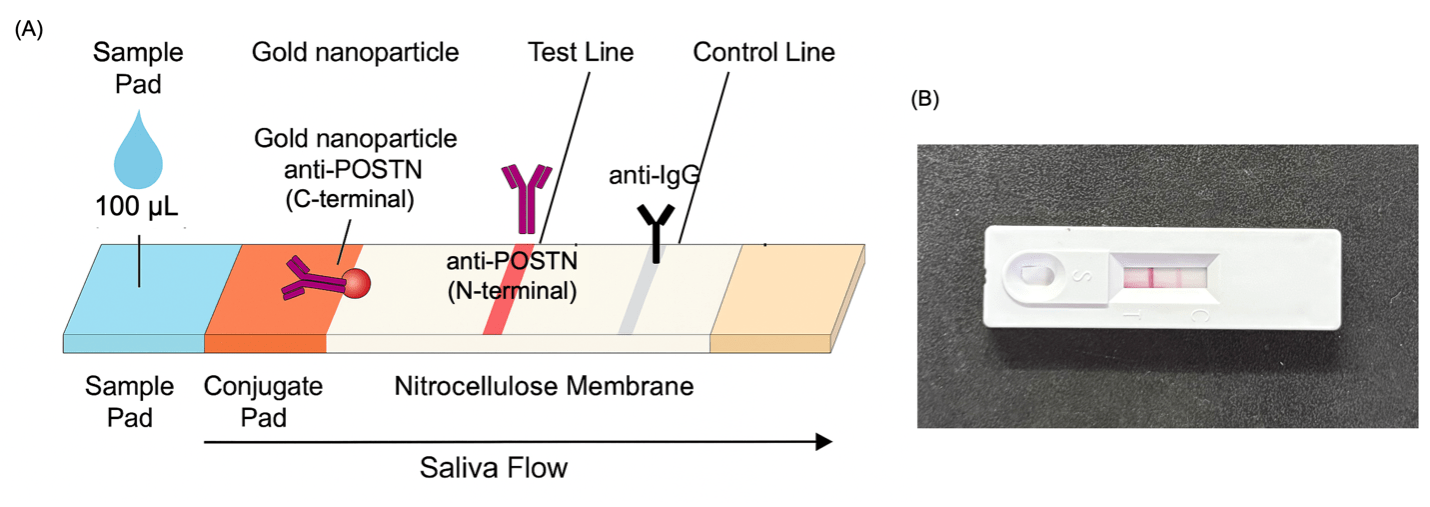
(A) Schematic diagram of the lateral flow assay (LFA) for salivary POSTN detection
(B) Image of the actual LFA device showing the test and control lines after saliva sample application.
Following the confirmation of POSTN elevation in OPMD patient saliva, a rapid and field-deployable detection system was developed to translate these findings into practical clinical use.
A lateral flow assay (LFA) prototype was designed using the same immuno-sandwich principle as the ELISA but adapted for rapid visual detection. In the assay design, gold nanoparticles conjugated with anti-POSTN (C-terminal) antibodies served as the detection probes.
When saliva containing POSTN was applied to the sample pad, the protein bound to these gold–antibody complexes and migrated along the nitrocellulose membrane. The complexes were then captured by immobilized anti-POSTN (N-terminal) antibodies at the test line, producing a distinct red band proportional to POSTN concentration. A separate control line, coated with anti-IgG antibodies, confirmed proper flow and reagent activity.
This indicates that the LFA system may provides a reliable and rapid method for POSTN quantification without the need for laboratory instrumentation. Collectively, the development of this POSTN LFA prototype represents the final translational step of the study—from dynamic salivary biomarker discovery to a non-invasive, point-of-care diagnostic platform for early detection of malignant transformation in OPMD.
Discussion
This study introduces a dynamic, saliva-based approach for monitoring the malignant transformation of OPMDs and identifies POSTN (periostin) as a clinically actionable molecular target.
Unlike conventional biopsies, which provide only static histopathologic information, our longitudinal framework captures temporal molecular fluctuations that occur during early disease progression.
By integrating time-series biomarker analysis, in vitro validation, transcriptomic profiling, and diagnostic translation, this study demonstrates a complete research continuum from biological mechanism to clinical application.
The salivary time-series analysis revealed a sequential progression of inflammatory and matrix-remodeling events—beginning with IL-8 and TNF-α activation17, followed by MMP-9 upregulation18 and epithelial damage markers such as CYFRA21-119,20.
In transcriptome, while several previously known markers such as MMP9, FN1, and VIM were also elevated in the OPMD-Progressor group, these molecules have been extensively studied in various cancers and therefore offer limited novelty for clinical translation. In contrast, POSTN (periostin) emerged as a relatively underexplored yet biologically relevant target, showing strong co-expression with ECM remodeling and EMT-related genes. Unlike classical inflammatory markers that reflect transient cytokine activation, POSTN represents a structural and secreted mediator that bridges chronic inflammation to tissue remodeling.
Clinically, this research provides three major advances.
First, it establishes a saliva-based dynamic monitoring system that could complement or reduce the need for repeated biopsies in high-risk OPMD patients. Second, it identifies POSTN as a predictive and measurable biomarker that bridges molecular discovery with clinical application. Third, the development of a lateral flow assay (LFA) prototype translates these findings into a rapid, cost-effective diagnostic tool suitable for community or chairside screening.
This represents a direct step toward real-time, point-of-care precision surveillance in oral oncology.
Nevertheless, some limitations should be acknowledged.
A key limitation of this study is that progressor status was defined by histopathology at enrollment rather than by prospective malignant transformation during follow-up. As such, the findings should be interpreted as identifying salivary molecular features associated with high-risk OPMD, not as a validated predictive model of future cancer development. The sample size was also relatively small (n = 3 per group for transcriptomic validation), and the follow-up period was limited to 12 weeks. Longer longitudinal cohorts and larger clinical datasets are required to confirm predictive performance. Additionally, the in vitro model was restricted to TNF-α stimulation; future studies should incorporate other microenvironmental factors such as fibroblast-derived cytokines, hypoxia, and immune interactions. Although the antibody pairs used were commercially validated for sandwich ELISA, independent epitope competition assays were not performed in this study, representing a methodological limitation that should be addressed in future validation studies. Moreover, POSTN knockout or inhibition experiments were not performed, which limits the mechanistic validation of its potential role.
Despite these limitations, the strong consistency observed across clinical, molecular, and prototype data supports the robustness and reproducibility of our findings.
Conclusion
In conclusion, this study proposes a saliva-based molecular surveillance pipeline that integrates time-series biomarker tracking, mechanistic validation, and diagnostic translation. By identifying POSTN as a mediator of inflammation-driven malignant transformation and adapting it into a rapid LFA detection format, this work bridges the gap between biomarker discovery and clinical implementation. Such a translational framework could ultimately enable detection, personalized monitoring, and improved clinical outcomes for patients with OPMD and early-stage oral cancer.
References
- Rusthoven, K., Ballonoff, A., Raben, D. & Chen, C. Poor prognosis in patients with stage I and II oral tongue squamous cell carcinoma. Cancer 112, 345–351 (2008). [↩]
- Kina, S., et al. Higher overall survival rates of oral squamous cell carcinoma treated with metronomic neoadjuvant chemotherapy. Am J Cancer Res 14, 1033–1051 (2024). [↩]
- Chu, H.-W., et al. Identification of Salivary Biomarkers for Oral Cancer Detection with Untargeted and Targeted Quantitative Proteomics Approaches*[S]. Molecular & Cellular Proteomics 18, 1796–1806 (2019). [↩]
- Saikishore, R., et al. The Circular RNA-miRNA Axis: A Special RNA Signature Regulatory Transcriptome as a Potential Biomarker for OSCC. Molecular Therapy Nucleic Acids 22, 352–361 (2020). [↩]
- Muralidharan, S., et al. A Narrative Review on Oral Squamous Cell Carcinoma. Journal of Pharmacy and Bioallied Sciences 17, S204–S206 (2025). [↩]
- Warnakulasuriya, S., Johnson, N.W. & Van Der Waal, I. Nomenclature and classification of potentially malignant disorders of the oral mucosa. Journal of Oral Pathology & Medicine 36, 575–580 (2007). [↩]
- Ai, R., et al. Microenvironmental regulation of the progression of oral potentially malignant disorders towards malignancy. Oncotarget 8, 81617–81635 (2017). [↩]
- Kamyabi, N., Bernard, V. & Maitra, A. Liquid biopsies in pancreatic cancer. Expert Review of Anticancer Therapy 19, 869–878 (2019). [↩]
- Chen, L., et al. Tumor circulome in the liquid biopsies for digestive tract cancer diagnosis and prognosis. World Journal of Clinical Cases 8, 2066–2080 (2020). [↩]
- Croci, D., et al. Multispectral fluorine-19 MRI enables longitudinal and noninvasive monitoring of tumor-associated macrophages. Science Translational Medicine 14, eabo2952 (2022). [↩]
- Gröschl, M. Saliva: A Reliable Sample Matrix in Bioanalytics. Bioanalysis 9, 655–668 (2017). [↩]
- Boroumand, M., et al. Saliva, a bodily fluid with recognized and potential diagnostic applications. Journal of Separation Science 44, 3677–3690 (2021). [↩]
- Khurshid, Z., et al. Human Saliva Collection Devices for Proteomics: An Update. International Journal of Molecular Sciences 17, 846 (2016). [↩]
- Piyarathne, N.S., et al. Diagnostic salivary biomarkers in oral cancer and oral potentially malignant disorders and their relationships to risk factors – A systematic review. Expert Rev Mol Diagn 21, 789–807 (2021). [↩]
- Rajkumar, K., et al. Validation of the diagnostic utility of salivary interleukin 8 in the differentiation of potentially malignant oral lesions and oral squamous cell carcinoma in a region with high endemicity. Oral Surg Oral Med Oral Pathol Oral Radiol 118, 309–319 (2014). [↩]
- Rajkumar, K., et al. Salivary and serum level of CYFRA 21-1 in oral precancer and oral squamous cell carcinoma. Oral Diseases 21, 90–96 (2015). [↩]
- Miron, R.J., Dard, M. & Weinreb, M. Enamel matrix derivative, inflammation and soft tissue wound healing. Journal of Periodontal Research 50, 555–569 (2015). [↩]
- Chandolia, B., Basu, S.K. & Kumar, M. Can MMP-9 be a Prognosticator Marker for Oral Squamous Cell Carcinoma? J Clin Diagn Res 10, Zc09–13 (2016). [↩]
- Liu, L., Liu, B., Zhu, L.-l. & Li, Y. CYFRA21-1 as a Serum Tumor Marker for Follow-Up Patients with Squamous Cell Lung Carcinoma and Oropharynx Squamous Cell Carcinoma. Biomarkers in Medicine 7, 591–599 (2013). [↩]
- Liang, H., et al. Serum cyfra21-1 is a new prognostic biomarker of penile squamous cell carcinoma. BMC Cancer 24, 1240 (2024). [↩]


