
Abstract
Tics are quick and repetitive movements or sounds that happen to people at unpredictable times and are a common side effect of autism spectrum disorder. Their unpredictable nature makes tics interruptions in the lives of those affected. This study uses machine learning, artificial intelligence, and Python coding to predict when tics in these individuals are going to happen. This research uses synthetic data to create analysis data and produce a model with the highest accuracy of predicting tics. The data was analyzed and checked for correspondences between factors that may affect when tics occur, such as stress, boredom, and anxiety. Through this analysis, the two factors most closely related to tics occurring were used to create the accuracy model. In this study, the data was fine-tuned using three hyperparameter methods: Logistic Regression, Decision Trees, and K Nearest Neighbor. These refined the data and contributed to creating a more accurate model. The final model produced an accuracy of 98% using hyperparameter methods, which indicates that this model can predict when tics are going to occur at a rate of about 98%.
Introduction
Tics, or the quick and repetitive movements or sounds that happen at unpredictable times, are a common side effect of the autism spectrum disorder. These side effects heavily impact daily life and social situations through interruptions in interactions, focus, and learning1‘2. They can be triggered by changes in environments, stress, and even other simple factors such as strong emotions, and are notoriously difficult to anticipate3‘4. If the onset of a tic can be predicted using new techniques, an alert can be created to enable the affected person to manage the interruption. Automatic detection and prediction of tics using machine learning has emerged in recent years as a promising tool for healthcare. Most prior work done in this field has focused on the Tourette Syndrome population and has demonstrated that machine learning models can detect tic events with reasonable precision, although they are typically in constrained settings5. To complement machine learning systems, inertial measurement units and electromyography have been used to distinguish tics from voluntary motion6, as well as sensor-based platforms to track movement7‘8. However, several important gaps remain. First, few studies consider individuals with autism who exhibit tic-like behaviors and are focused on other disabilities, including tics in their symptoms, meaning that existing models may not generalize to the specific movement patterns and variability of these populations9‘10. Second, most prior work addresses detection, and not prediction, which is a critical difference in the future of this field and new systems8. Additionally, the existing studies are focused on using the autism patients’ data without performing data transformation techniques, which may result in a decrease in the models’ performance. Therefore, the following study is mainly focused on improving the accuracy by performing data preprocessing techniques. The main objectives of this study include predicting tics in autism patients using machine learning algorithms and improving the accuracy of tic prediction using data transformation techniques.
Paper Organization
This paper is organized into five main sections. Section 1 summarizes the research problem and paper conclusions and findings into an abstract, mentioning the methods used to analyze and filter the data into a model. Section 2 presents the Introduction and Background sections, which outline a review of existing research and discuss the gaps in this field, and how this paper fits into working towards solving this issue. Section 3 details the methodology used in the research process, describing the process of creating and analyzing synthetic data and numerous factors (such as stress and boredom), and the application of three machine learning models that are commonly used in predictive analysis11‘12. These models are meant to improve the predictive analysis accuracy through hyperparameter tuning. Section 4 discusses the results, presenting the model’s performance and the model accuracy achieved through the process. Finally, Section 5 provides the discussion and conclusion, which summarize key findings and reflect on the broader implications of the study. This section also examines the study’s limitations, including the use of synthetic data and constraints that affect real-world reliability when validating this type of approach1.
Background
Behavioral tics in individuals with autism can be detected and predicted through machine learning approaches (ML) in artificial intelligence (AI) techniques. Machine learning aims to teach a computing machine how to use detected patterns in data that represent some phenomenon and has been used to classify, predict, and forecast outcomes in autism research11‘12.
In May of 2023, Nele Sophie Brügge and Gesine Marie Sallandt conducted research that used AI to predict tics in people with Tourette’s Syndrome5. Similarly, this research posits that a model using supervised learning, a type of machine learning wherein the machine is trained by a human using known data to analyze patterns and correlations, can predict tics in people with Autism with precision and accuracy. Such a model can be used in a device that can predict when a tic is about to occur, alert the person, and play a part in helping the community that suffers from tics, as shown by recent monitoring system studies8‘13. Through supervised learning, algorithms have the potential to analyze trained data and accurately predict if the factor is related to tics and the frequency of tics in individuals with autism. Furthermore, the following research tests the hypothesis using algorithms such as Logistic Regression, Decision Trees, and K Nearest Neighbor to maximize the accuracy of the model. These algorithms have increasingly been used in predictive modeling and short-term outcome predictions11‘12.
Methods
The UK National Health Society3 states that “Tics can happen randomly and they may be associated with something such as stress, anxiety, tiredness, excitement, or happiness.” Similar patterns have also been documented in studies focusing on autism and behavior studies1‘2.To decipher which triggers were most heavily impacting those with autism, all the factors were assigned a numeric value for comparison. The data used in this research is synthetic and serves the purpose of testing the utility of ML models to prove this hypothesis, which is a common strategy used in trials and research when obtaining real datasets is unethical14‘1.
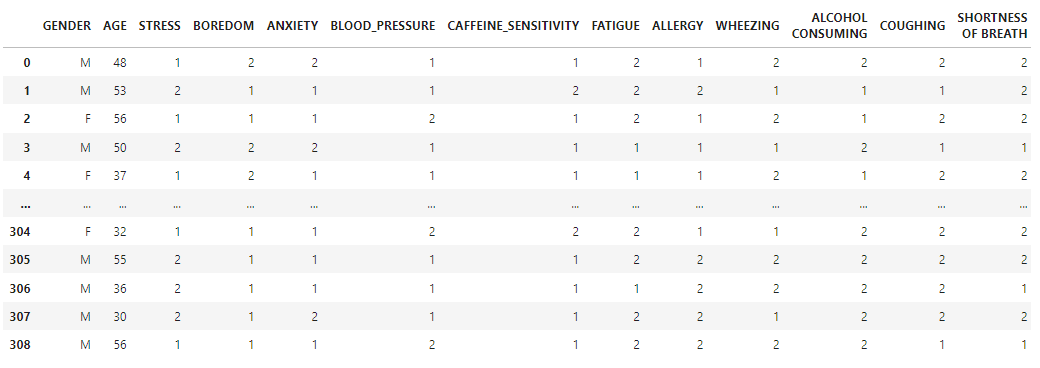
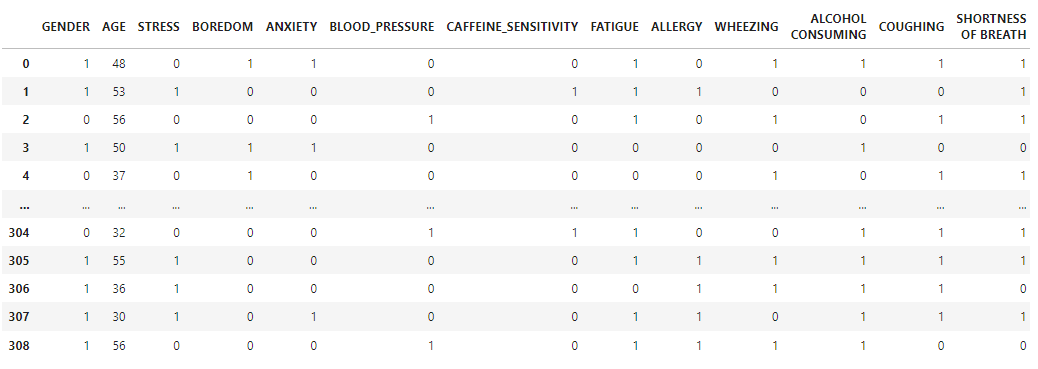
In selecting features for analysis, this study focuses on factors that are commonly associated with the onset of tics in individuals with autism, such as stress, boredom, and anxiety. These variables were chosen based on prior research linking emotional or environmental factors to increased tic activity amongst individuals15‘16‘17. By incorporating these factors, the model aimed to capture the most realistic behavioral patterns it could. A synthetic data set was created to resemble real-world data and included many of the correlated factors. Some of the factors are known to be not causally related to tic onsets. Using Python coding and built-in libraries, the data were first organized and refined to ensure accuracy and relevance. In its initial stage, irrelevant features from the data were filtered out under a supervised mode to focus on the factors that were potentially influencing tic occurrences, following standard preprocessing methods in machine learning research9‘11. Variables such as height, zip code, parental status, employment, and college education were excluded because they were not expected to have a meaningful relationship with tic frequency or intensity. This filtering process improved efficiency and data integrity by preventing unrelated variables from influencing results. Duplicate entries were also weeded out to produce the highest-quality data set suitable for analysis. The remaining relevant data were transformed into a binary format using Python’s data transformation methods. Each variable was ended as either 0 or 1, representing the presence or absence of an influence on tic occurrence. This structure made for an easier comparison and compatibility with machine learning algorithms, particularly those that relied on classification models11‘12. Continuous variables such as age were maintained in their numerical form. As noted in the labels below, Figure 1 illustrates the data before transformation, with values being either 1 or 2. Figure 2 shows the transformed data, with values of either zero or one, which provides a simpler way of comparing the feature values with each other. After preprocessing, the data were divided into numerous steps to enable accurate model evaluations. Logistic Regression, Decision Tree, and K-Nearest Neighbor were implemented to identify parents and predict the likelihood of tic occurrence. Lastly, hyperparameter tuning was applied to optimize each model’s performance, allowing the most accurate prediction of when tics would occur9‘18.
Finally, to decipher the correlation between pairs of factors, the Python “corr( )” method was used. Any two factors producing correlation values closer to 1 were determined to be the most correlated with the onset of tics, staying consistent with previous statistical approaches used with autism studies16‘9.
This research utilized three methods to conduct a more refined analysis: Logistic Regression, Decision Trees, and K-Nearest Neighbor. Logistic Regression is a statistical model that predicts probability using independent variables, in this case, the factors that affect tics in people with autism, and therefore may be an appropriate method for predicting when tics are about to occur. Decision Trees split data by using a large node, a basic unit of data structure, which represents whether the person is experiencing autistic tics. All the data related to the factors is distributed into smaller nodes to decipher correlation patterns between the larger and smaller nodes. The trees efficiently made the data clear and organized for the model to analyze and produce a high accuracy percentage. Lastly, K Nearest Neighbor is a method for classification and regression that uses the proximity of factors with the onset of tics to analyze patterns. This method works for this research because it can use the proximity of the factors and improve the model’s accuracy.
Results and Analysis
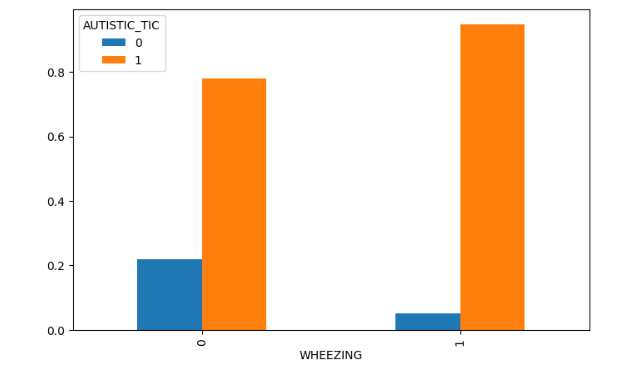
The best way to present the correlation between factors affecting mood or health, and whether or not they had tics, was through comparative charts that demonstrated correlations. Visual graphs and correlation maps have been widely used for machine learning studies for a better interpretation of model behavior18‘10. For example, Figure 3 below shows the correlation between tics and wheezing. As shown by the legend at the top left, blue (0, no) shows no autistic tics, and orange (1, yes) shows having tics. This graph represents two separate groups, wheezing and having autistic tics, and will demonstrate if there is a correlation between the two factors. The two bars on the right represent the people who wheeze compared. The graph shows how a larger percentage of autistic people who wheeze also have tics, confirming some correlation between the two factors.
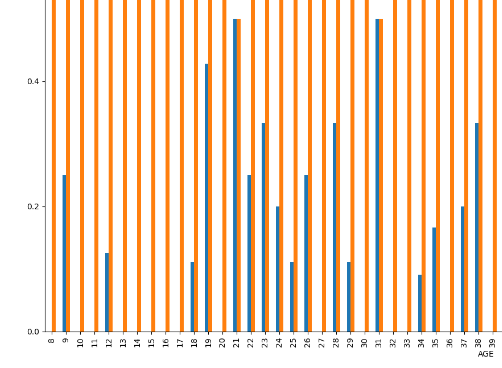
For data that could not be categorized into yes (1) and no (0), such as age, a new method was created with different parameters to properly display the data according to value. The correlation graph for age and tics, Figure 4, is shown above, with age on the x-axis and correlation on the y-axis, with blue (0, no) showing no autistic tics, and orange (1, yes) showing having tics. This is an example of a feature that shows no apparent correlation, as all age groups from 8 to 70 had certain individuals with tics and some without. Based on this information, age does not correlate with tics. This outcome is consistent with autism prediction research, which shows that behavioral and contextual features are more informative than demographic variables when modeling outcomes19‘12.
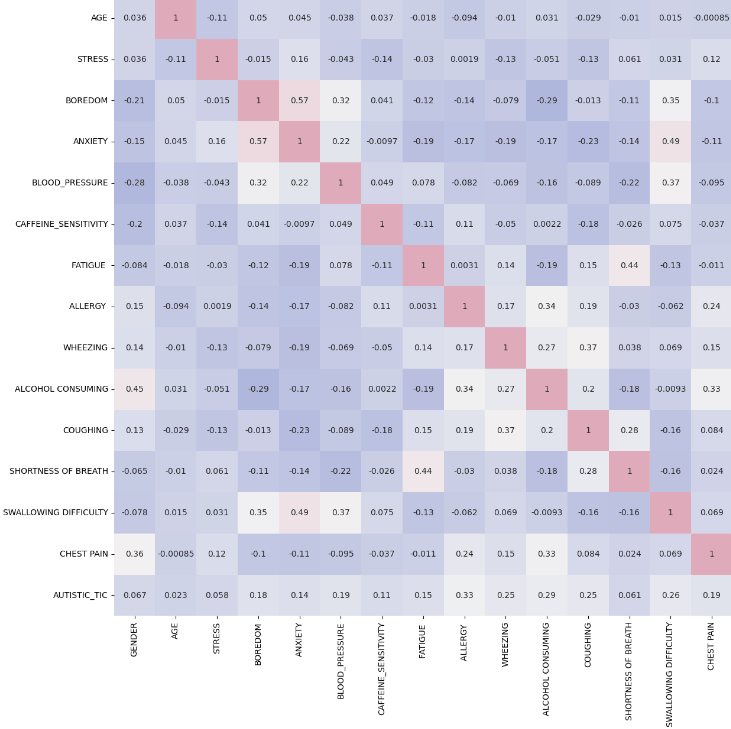
After modifying parameters such as the dimensions for the graph, sample size of the data being used, and the number of iterations the code goes through, the same process was used for the analysis of all the factors in the data set using the same code. Since the individual graphs were complete, a correlation map was made to provide an overview of the results collected thus far. The graph uses colors and a color scale, with blue representing a low correlation and pink representing a high correlation, to represent which correlation was the strongest. Figure 5 below shows the full correlation chart and displays how the highest correlation values are between boredom and anxiety, as shown by the pink squares at the intersections of these factors. This information made it clear what the most prominent and highly correlated factors are and how they can be used to analyze when tics are about to happen. Clinical research similarly shows how emotional and stressful situations tend to enhance tic behavior20.
After refining and analyzing visual data, the data had to be split and tuned to get the accuracy of the model as high as possible. Multiple methods of data analysis were utilized to do this.
Logistic Regression, Decision Trees, and K-nearest neighbor all need hyperparameters, i.e., preset configuration variables that are used to manage machine model training. Hyperparameters helped in fine-tuning the analysis, i.e., the process of tweaking model performance to produce optimal results. This process varies for the different methods and can be performed by setting parameters within the Python code. For example, Figure 6 below shows the code for the logistic regression model analysis. The parameters shown for the model all contribute to making the model more accurate. These supervised machine learning algorithms have been previously used to predict short-term outcomes in people with autism spectrum disorder, supporting the decision to utilize them for this predictive study21. Machine learning methods such as preprocessing, feature selection, and hyperparameter tuning have been shown to improve classification reliability7.
Discussion
This study demonstrates that machine learning techniques applied to synthetic data can predict tic occurrences in individuals with autism. The final model achieved an accuracy of 98%, identifying stress and boredom as significant predictive factors. These findings align with existing literature, which has highlighted the challenges of predicting tics in people with autism due to the need for larger datasets and an ethical dilemma in collecting personal data from such individuals. A systematic review on prediction in autism emphasized the variability in predictive learning among these individuals, suggesting that personalized approaches are needed for future accurate predictions19. While the use of synthetic data allows for controlled experimentation, it introduces many limitations. Previous studies have noted that performance can degrade due to errors in uncurated training data. A study done on a hybrid learning approach for detecting autism demonstrated that data augmentation strategies can produce synthetic datasets needed for training machine learning models14. Additionally, the reliance on synthetic data stops models from capturing the full complexity of real-world scenarios and environmental or personal factors that can alter a dataset. Despite such limitations, the predictive factors included in this study are consistent with clinical observations, suggesting that this machine learning model does have practical relevance. For example, a study from 2010 found that nearly 50% of children with typical development signs had obsessive-compulsive behaviors that indicated tic-related behaviors15. However, validating these findings in the future requires a broader range of predictive factors and testing their performance across multiple profiles. Although this research explores autism-specific tics, tics are not confined to only autism, as people with Tourette’s Syndrome and ADHD also suffer from them. An article by the National Library of Medicine, Childhood Predictors of Tics in Tourette’s Disorder16, states that childhood tic severity has frequently been found to predict tic severity in late adolescence or adulthood. This shows that although the model is not the same across different types of tics, this research can potentially detect tics in people with various disabilities. This research solely proposes a predictive model, and for it to be implemented in a device for use, further research is required. Ongoing efforts to recruit participants for AI-based tic research shows both growing interest in predictive analysis but also the challenge of acquiring ethical and real-world data for validation22. Finally, it should be mentioned that in this study, accuracy was selected as a primary evaluation metric because the goal was to classify whether a tic would occur or not, rather than to predict continuous values such as tic duration or intensity. Since the output variable was 0 or 1, classification-based evaluation methods were most appropriate. Metrics such as RMSE, MAE, and MSE are typically applied to regression models that work to assess prediction errors, whereas accuracy gives a direct representation of the proportion of correct classifications made by the model. This makes accuracy a more intuitive and relevant measure for this paper. Furthermore, similar approaches have been used in prior research on tic detection and movement classification, where accuracy was preferred for evaluating classification results. For instance, the Wearable-Sensor-Based Platform for Gesture Recognition of Autism Spectrum Disorder Children Using Machine Learning Algorithms23 relies on accuracy to assess the model’s reliability, emphasizing an easier interpretation over complex error metrics.
References
- M. E. A. Seddik et al. How Bad Is Training on Synthetic Data? A Statistical Analysis of Language Model Collapse. arXiv, 2024 [↩] [↩] [↩] [↩]
- PsychCentral. Autism & Tics. PsychCentral, 2023 [↩] [↩]
- NHS. Tics. National Health Service, 2017 [↩] [↩]
- Tourette Association of America. What Is Tourette? Overview. Tourette Association of America, 2023 [↩]
- N. S. Brügge et al. Automated Motor Tic Detection: A Machine Learning Approach. Movement Disorders, vol. 38, no. 7, 11 May 2023, pp. 1327–1335 [↩] [↩]
- S. Cernera et al. The Human Tic Detector: An Automatic Approach to Tic Characterization Using Wearable Sensors. Clinical Neurophysiology, vol. 134, Feb. 2022, pp. 102–110 [↩]
- J. I. Martínez-López et al. Wearable-Sensors-Based Platform for Gesture Recognition of Autism Spectrum Disorder Children Using Machine Learning Algorithms. Sensors, vol. 21, no. 10, 2021 [↩] [↩]
- A. Rajinikanth et al. A Novel System to Monitor Tic Attacks for Tourette Syndrome Using Machine Learning and Wearable Technology. JMIR Neurotechnology, vol. 2, 2023 [↩] [↩] [↩]
- A. Li et al. Machine Learning Based Predictive Model of the Risk of Tourette Syndrome with SHAP Value Interpretation: A Retrospective Observational Study. Scientific Reports, vol. 15, no. 1, 26 May 2025 [↩] [↩] [↩] [↩]
- S. Conde-Pumpido Zubizarreta et al. Predicting Autistic Traits, Anxiety and Depression Symptoms Using Camouflaging Autistic Traits Questionnaire (CAT-Q-ES): A Machine Learning Study. Research in Autism, vol. 128, 20 Sept. 2025, p. 202712 [↩] [↩]
- A. Aitken et al. Predictive Modeling of Adaptive Behavior Trajectories in Autism: Insights from a Clinical Cohort Study. Translational Psychiatry, vol. 15, no. 1, 10 Oct. 2025 [↩] [↩] [↩] [↩] [↩]
- L. Ejlskov et al. Prediction of Autism Risk From Family Medical History Data. Biological Psychiatry Global Open Science, 2021 [↩] [↩] [↩] [↩] [↩]
- Movement Disorders. Video-based Machine Learning for Tic Detection. Podcast, 27 Jan. 2025 [↩]
- T. Eslami et al. ASD-DiagNet: A Hybrid Learning Approach for Detection of Autism Spectrum Disorder Using fMRI Data. Frontiers in Neuroinformatics, vol. 13, 27 Nov. 2019 [↩] [↩]
- A. Ghanizadeh. Clinical Approach to Motor Stereotypies in Autistic Children. Iranian Journal of Pediatrics, vol. 20, no. 2, June 2010, p. 149 [↩] [↩]
- E. J. Ricketts et al. Childhood Predictors of Long-Term Tic Severity and Tic Impairment in Tourette’s Disorder. Behavior Therapy, vol. 53, no. 6, 1 Nov. 2022, pp. 1250–1264 [↩] [↩] [↩]
- Tourette Association of America. What Is Tourette? Overview. Tourette Association of America [↩]
- C. Wang et al. Deep Learning-Assisted Non-Invasive Pediatric Tic Disorder Diagnosis Using EEG Features Extracted by Residual Neural Networks. Journal of Radiation Research and Applied Sciences, vol. 17, no. 4, 19 Oct. 2024, article 101151 [↩] [↩]
- J. Cannon et al. Prediction in Autism Spectrum Disorder: A Systematic Review of Empirical Evidence. Autism Research, vol. 14, no. 4, 11 Feb. 2021, pp. 604–630 [↩] [↩]
- Golden Steps ABA. Autism and Tics. Golden Steps ABA [↩]
- M. B. Usta et al. Use of Machine Learning Methods in Prediction of Short-Term Outcome in Autism Spectrum Disorders. Psychiatry and Clinical Psychopharmacology, vol. 29, no. 3, 2019 [↩]
- Tics & Tourette Across the Globe. Seeking Participants: AI Study on Tics and Functional Tic-Like Movements. 13 Mar. 2025 [↩]
- J. I. Martínez-López et al. Wearable-Sensors-Based Platform for Gesture Recognition of Autism Spectrum Disorder Children Using Machine Learning Algorithms. Sensors, vol. 21 [↩]


