
Abstract
Poor sleep has long been a very prevalent issue in our society. Although many factors are known to correlate with sleep, little is known about how sleep and various lifestyle factors relate to each other. Additionally, something that has not been commonly studied is how sleep differs among various neuropsychiatric populations. This study aims to identify the key factors associated with poor sleep across different neuropsychiatric conditions, including both major and persistent depressive, anxiety, and bipolar disorders. The paper can be broken down into two hypotheses: what primary and secondary lifestyle factors correlate with poor sleep, and how sleep differs among different neuropsychiatric populations. The results of the study shows that stress is the factor that correlates with many measures of poor sleep, such as hours slept, sleep latency, and bad dreams. Furthermore, there is no large difference among the sleep time of neuropsychiatric disorders that were analyzed (Major Depressive Disorder, Persistent Depressive Disorder, and anxiety), although there is a minor difference among the healthy control group and those who have been diagnosed with one or more disorders. A stronger correlation between lifestyle factors and poor sleep is present among individuals diagnosed with a neuropsychiatric disorder compared to the healthy control group. Future studies may compare more factors with sleep, and they may also compare a wider variety of neuropsychiatric disorders.
Keywords: Sleep, neuropsychiatric disorders, lifestyle, cognitive functioning, language, sleep disorders, stress, health.
Introduction
The action of sleep has a profound impact on our lives; it is crucial for maintaining physical health, cognitive functioning, and emotional well-being. Regardless, the significance in the impacts of sleep can vary notably among different individuals. For instance, neurological conditions such as Major Depressive Disorder (MDD), Persistent Depressive Disorder (PDD), and anxiety are often linked to disrupted sleep, while many lifestyle factors such as diet, exercise, and work schedules can exacerbate sleep disturbances. This paper looks at the specific variations of poor sleep and sleep disorders among different neuropsychiatric populations and lifestyles in older adults. Although previous studies have mapped the correlationships and relationships between various lifestyle factors and sleep, no research has been done on how these lifestyle factors differ in intensity from their relationship on poor sleep. This paper aims to fill in this gap in current research.
The lifestyle factors that are analyzed in this research paper are as follows: stress, general life function, social functioning, age at first stressful event, problems with blood pressure, problems with heart, hypertension, stroke, weight, body temperature, pulse, respiration and aerobic health, memory, and executive functioning. Although some of these measurements look into physiological states or cognitive abilities, these will be used as “secondary lifestyle factors” in this paper, as many of these measurements correlate strongly with lifestyle factors1. Sleep disturbances refer to disruptions in the quantity, quality, or timing of sleep that negatively affect an individual’s ability to function during the day, while poor sleep refers to an individual consistently getting less sleep than they require2. The analysis of the association of sleep and hypertension has shown that a shorter, longer sleep duration does not relate to hypertension, unlike difficulty sleeping and sleep disorder3.
Stress is known to correlate with poor sleep, due to the overlap of neurotransmitters in the human brain that have executive functioning over both stress responses and the circadian rhythm4. Previous studies have shown that early-age exposure to stress may alter the behavior of the hypothalamic-pituitary-adrenal (HPA) axis and therefore impacts sleep because the HPA axis controls both stress and the circadian rhythm4. Poor sleep also impacts the brain by breaking the connectivity between the amygdala and the medial prefrontal cortex, which thus decreases inhibitory projections for the amygdala and negatively impacts overall cognition2. The analysis of the association of sleep and hypertension has shown that a shorter, longer sleep duration does not relate to hypertension, unlike difficulty sleeping and sleep disorder3. The consequences of sleep deprivation on cognitive performance. Furthermore, poor sleep leads to decreased activity in several parts of the brain, ultimately leading to fewer social motivations and speculations on social behavior, and to emotional distress after social interaction5. Linking sleep and other health related issues, several measurements of poor sleep are associated with a higher risk of developing type 2 diabetes, meaning many who have type 2 diabetes also have sleep disorders or poor sleep6.
Many mental health disorders have correlational relationships with sleep. Sleep disorders often occur at a higher rate in neuropsychiatric populations, and evidence suggests a bidirectional causality between poor sleep and psychiatric symptoms. These neuropsychiatric disorders include MDD, bipolar disorder, schizophrenia, PTSD, and substance use disorders7.
The transdiagnostic model of sleep disturbances shows that there are common processes (such as hyperarousal, emotion dysregulation, or rumination) that contribute to sleep problems across many psychiatric conditions. For example, people with anxiety, depression, PTSD, and bipolar disorder might struggle with sleep because they all demonstrate cognitive arousal, hyperarousal, and circadian dysregulation8.
The purpose of this study is to compare numerous lifestyle factors to determine which factors most strongly predict poor sleep quality. This will be achieved by plotting Pearson’s correlation coefficients against numerical measures of sleep deficiency. Additionally, relationships between poor lifestyle health and poor sleep were compared to various neuropsychiatric disorders to see if there is a difference among different neuropsychiatric populations. There were two hypotheses aimed to be tested in this study: if poor lifestyle health is related to poor sleep and if poor sleep differs between different neuropsychiatric populations.
This question is significant because although many studies have been done to determine the relationship between different lifestyle factors and neuropsychiatric disorders and sleep, there are rarely any studies comparing the significance of these factors in relationship to sleep, or comparing the effects among neuropsychiatric populations. Comparing the different intensity of the effects of sleep among different lifestyle and neuropsychiatric populations may be essential in developing targeted interventions and personalized treatment plans that address the unique sleep-related challenges faced by each group. Methodology and data was collected from the ADNI database and statistical tests of Pearson’s Correlation and 2-sided independent t-tests were conducted. The use of the ADNI database could have limited the scope of data because only specific lifestyle and cognitive factors were included.
Stress seems to be the most significant factor out of all lifestyle, physiological and cognitive factors that correlates with most poor sleep measures. It yields many significant values of p<0.001, much lower than the chosen alpha level of p<0.05. Other cognitive and physiological factors appear to be less significant than that of stress and poor sleep measures. Comparing neuropsychiatric populations with those of poor sleep, there appears to be a minor difference among the healthy control group and groups diagnosed with neuropsychiatric disorder, but there is little difference among those diagnosed with one or more neuropsychiatric disorders. However, when comparing the correlation of lifestyle factors and poor sleep, there are much stronger correlations in groups diagnosed with a neuropsychiatric disorder compared to the health.
Results
Statistical tests of Pearson’s correlation and two sided Independent t-tests were conducted via. the SPSS Statistics version 28 software. Consider the case of subjective distress (1.), social functioning (2.) and occupational functioning which all have significant values (p < 0.001) with all measures of sleep except for Sleep Total and Sleep Severity, while social functioning does not have significant results with drowsiness and occupational functioning does not have significant results with sleep latency or asleep time (Table 1). Stress total (4.) presents significant values for all but sleep total and sleep severity (Table 1). No other measures observed in this study present this many significant results with poor sleep measures. This demonstrates the larger negative correlation that stress has on sleep that other measurements do not record.
There were 701 participants diagnosed with anxiety disorder, 708 participants diagnosed with either MDD or PDD.
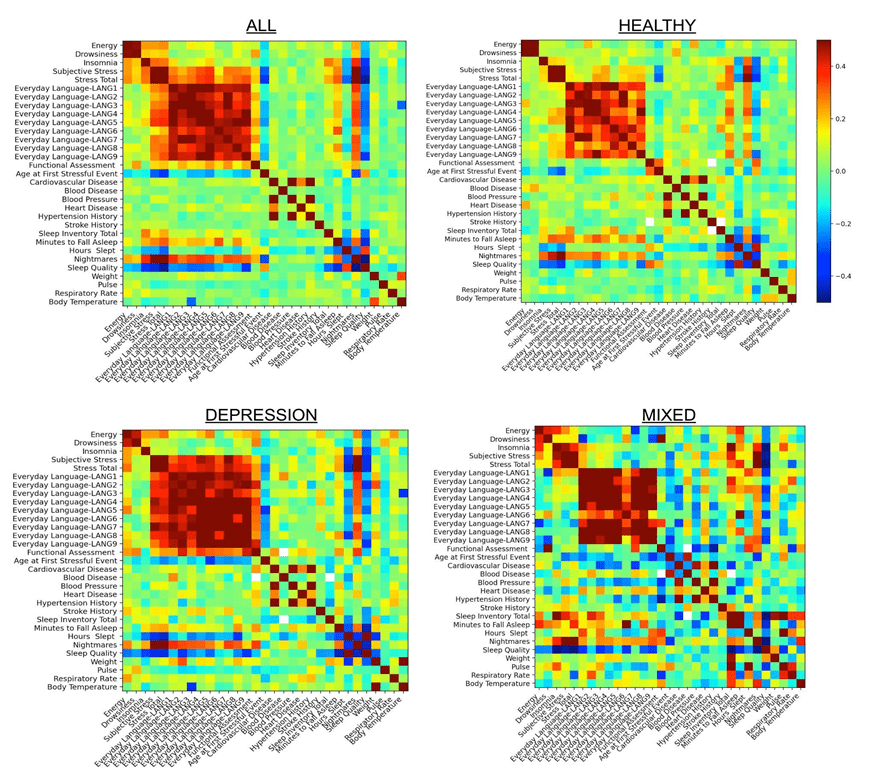
In Figure 1, the healthy control group appears to have the least amount of red color, which indicates a strong positive correlation, while the depression (includes both MDD and PDD) group and mixed groups have the most red present. The mixed group also has the most dark blue present, indicating a stronger presence of negative correlations. Overall, this shows that there are stronger correlations between lifestyle factors and sleep among neuropsychiatric populations who have been diagnosed with one or more mental health disorders (Figure 1).
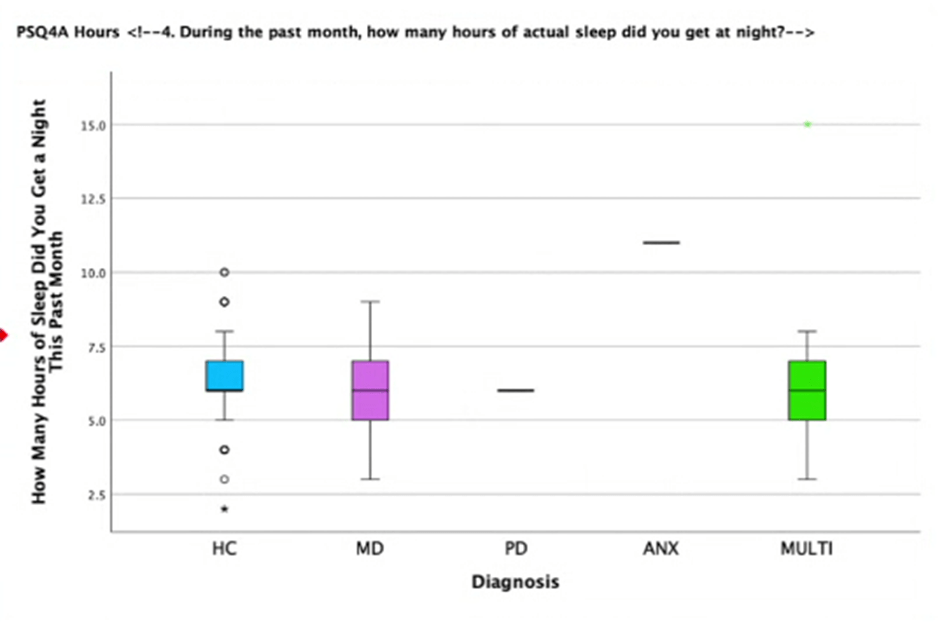
Among the healthy control group, MDD, and groups of individuals diagnosed with multiple neuropsychiatric disorders, all of the groups appear to show a relatively equal median of average hours of sleep a night in the past month of approximately 6.125 hours (Figure 2). However, individuals diagnosed with MDD appear to have the largest range of average hours of sleep per night in the past month. In contrast, the healthy control group had the smallest range of these three groups. Individuals diagnosed with PDD, anxiety disorders and bipolar disorder do not appear on the graph due to the small number of individuals in this group. This may be because those of either category may be categorized under the group with multiple neuropsychiatric disorders, which is a notable observation.
| Measure | Drowsy a | Insomnia a | Energy a | Sleep Total b | Sleep Latency c | Asleep Time c | Bad Dreams? c | Sleep Severity b |
| a) Lifestyle factors | ||||||||
| 1. Subjective Distress d | 0.176/<0.001* | 0.301/<0.001* | 0.246/<0.001* | 0.165/0.066 | 0.267/<0.001* | -0.201/0.001 | 0.606/<0.001* | -0.164/0.27 |
| n = | 361 | 361 | 361 | 126 | 260 | 261 | 264 | 47 |
| 2. Social Funct. d | 0.158/0.003 | 0.240/<0.001* | 0.222/<0.001* | 0.219/0.014 | 0.231/<0.001* | -225/<0.001* | 0.573/<0.001* | -0.071/0.637 |
| n = | 361 | 361 | 361 | 126 | 260 | 261 | 264 | 47 |
| 3.Occupational Funct.d | 0.178/<0.001* | 0.213/<0.001* | 0.206/<0.001* | 0.240/0.007 | 0.146/0.018 | -0.148/0.017 | 0.458/<0.001* | -0.169/0.256 |
| n = | 361 | 361 | 361 | 126 | 260 | 261 | 264 | 47 |
| 4. Stress Total d | 0.191/<0.001* | 0.288/<0.001* | 0.260/<0.001* | 0.255/0.011 | 0.311/<0.001* | -0.272/<0.001* | 0.680/<0.001* | -0.125/0.404 |
| n = | 361 | 361 | 361 | 126 | 260 | 261 | 264 | 47 |
| 5. Funct. Impairment e | 0.240/0.007 | -0.012/0.891 | 0.087/0.331 | 0.009/0.919 | 0.081/0.426 | 0.0166/0.097 | 0.218/0.029 | -0.046/0.757 |
| n = | 126 | 126 | 126 | 119 | 99 | 101 | 100 | 47 |
| 6. 1st Stress Age f | -0.113/0.043 | -0.132/0.018 | -0.160/0.004 | -0.086/0.368 | -0.138/0.035 | 0.131/0.044 | -0.300/<0.001* | 0.032/0.837 |
| n = | 321 | 321 | 321 | 111 | 233 | 236 | 237 | 44 |
| 7. Last Stres Age f | -0.134/0.016 | -0.131/0.019 | -0.134/0.016 | -0.04/0.676 | -0.145/0.027 | 0.068/0.297 | -0.158/0.015 | -0.05/0.747 |
| n = | 321 | 321 | 321 | 111 | 233 | 236 | 237 | 44 |
| 8. CVD g | 0.028/0.586 | -0.005/0.917 | 0.096/0.064 | -0.056/0.534 | 0.096/0.123 | -0.134/0.03 | 0.08/0.193 | -0.149/0.306 |
| n = | 372 | 372 | 372 | 125 | 261 | 262 | 265 | 49 |
| 9. BD g | 0.103/0.05 | 0.024/0.647 | 0.0740/0.158 | 0.002/0.985 | 0.005/0.933 | -0.11/0.078 | -0.008/0.9 | 0.017/0.909 |
| n = | 362 | 362 | 362 | 122 | 254 | 255 | 258 | 49 |
| 10. BPD g | 0.01/0.854 | -0.049/0.345 | 0.005/0.916 | -0.018/0.837 | 0.033/0.594 | -0.125/0.04 | 0.06/0.325 | 0.13/0.372 |
| n = | 362 | 362 | 362 | 122 | 254 | 255 | 258 | 48 |
| 11. HD g | -0.029/0.579 | 0.044/0.397 | 0.114/0.028 | -0.106/0.228 | 0.086/0.163 | -0.045/0.466 | 0.084/0.168 | -0.148/0.312 |
| n = | 375 | 375 | 375 | 132 | 268 | 269 | 272 | 49 |
| 12. Hypertension g | 0.021/0.687 | -0.005/0.929 | 0.051/0.333 | -0.043/0.623 | 0.072/0.24 | -0.160/0.008 | 0.063/0.297 | -0.037/0.803 |
| n = | 362 | 362 | 362 | 131 | 269 | 270 | 273 | 49 |
| 13. Stroke g | 0.058/0.274 | 0.1/0.058 | 0.08/0.126 | 0.007/0.941 | 0.086/0.159 | -0.024/0.699 | -0.004/0.946 | -0.144/0.325 |
| n = | 362 | 362 | 362 | 131 | 269 | 270 | 273 | 49 |
| 14. Weight h | 0.017/0.745 | 0.025/0.639 | 0.037/0.483 | 0.143/0.122 | 0.016/0.796 | -0.096/0.127 | 0.149/0.017 | 0.238/0.112 |
| n = | 358 | 358 | 358 | 119 | 253 | 254 | 257 | 46 |
| 15. Pulse h | 0.113/0.033 | -0.001/0.983 | 0.076/0.151 | -0.019/0.835 | 0.025/0.693 | 0.115/0.068 | -0.032/0.61 | -0.134/0.375 |
| n = | 354 | 354 | 354 | 118 | 251 | 252 | 255 | 46 |
| 16. Respiratory Rate h | 0.039/0.464 | 0.145/0.006 | 0.152/0.004 | 0.083/0.371 | 0.046/0.467 | -0.062/0.329 | 0.11/0.08 | 0.08/0.598 |
| n = | 355 | 355 | 355 | 118 | 251 | 252 | 255 | 46 |
| 17. Body Temp. h | 0.033/0.538 | -.112/0.033 | -0.029/0.584 | 0.057/0.537 | 0.059/0.346 | -0.026/0.674 | 0.035/0.574 | 0.052/0.732 |
| n = | 358 | 358 | 358 | 119 | 253 | 254 | 257 | 46 |
| 18. Cog. Vocab.i | -0.003/0.966 | -0.076/0.292 | -0.022/0.765 | -0.105/0.364 | -0.059/0.428 | .179/0.017 | -0.143/0.055 | -0.11/0.55 |
| n = | 193 | 193 | 193 | 77 | 180 | 179 | 182 | 32 |
| 19. Lang. Construction j | 0.01/ 0.869 | 0.098/0.121 | 0.083/0.192 | -0.071/0.477 | 0.094/0.154 | -0.099/0.137 | .156/0.017 | -.306/0.049 |
| n = | 250 | 250 | 250 | 102 | 229 | 229 | 233 | 42 |
| 20. Lang. Word Recall j | -0.005/0.934 | -0.095/0.136 | 0.116/0.068 | -0.098/0.329 | .181/0.006 | 0.055/0.407 | .181/0.006 | -.356/0.021 |
| n = | 250 | 250 | 250 | 102 | 229 | 229 | 233 | 42 |
| 21. Lang. Word Orientation | -0.001/0.982 | .150/0.018 | .125/0.048 | .286/0.004 | 0.063/0.343 | -0.084/0.207 | 0.058/0.379 | -0.006/0.971 |
| n = | 250 | 250 | 250 | 102 | 229 | 229 | 233 | 42 |
| 22. Lang. Comp. j | -0.044/0.486 | .160/0.011 | 0.09/0.154 | 0.027/0.787 | 0.099/0.136 | -0.006/0.93 | 0.102/0.12 | -0.225/0.152 |
| n = | 250 | 250 | 250 | 102 | 229 | 229 | 233 | 42 |
| 23. Lang. Diff. Word Find j | -0.113/0.076 | 0.106/0.094 | 0.003/0.959 | 0.097/0.331 | -0.004/0.955 | 0.052/0.435 | .174/0.008 | -0.017/0.913 |
| n = | 250 | 250 | 250 | 102 | 229 | 229 | 233 | 42 |
| 24. Lang. Errors j | -0.022/0.729 | -0.014/0.831 | 0.07/0.269 | 0.042/0.674 | .157/0.017 | 0.028/0.672 | .183/0.005 | -.324/0.037 |
| n = | 250 | 250 | 250 | 102 | 229 | 229 | 233 | 42 |
Discussion
Stress appears to be the most prominent lifestyle factor related to sleep conditions (Table 1). This suggests that individuals experiencing the highest amount of stress may be most likely to present qualities of poor sleep, such as poor sleep quality, sleep disorders, less sleep time and nightmares. It is also seen that there is no significant difference among the sleep time of the neuropsychiatric populations that were observed in this study (Figure 1), but stronger correlations between (primary and secondary) lifestyle factors and poor sleep among the different neuropsychiatric groups are observed. Note that all relationships identified in this study are purely causational: despite finding a significant relationship among two variables, one may not cause the other. Furthermore, given the heterogeneity of the MIXED/MULTI group in Figure 1 and Figure 2, which includes participants with varying combinations of diagnoses, interpretation of findings from this group is limited and should be approached with caution.
The findings of this study support the transdiagnostic model of sleep disturbances, which posits that shared mechanisms such as hyperarousal, cognitive arousal, and emotion dysregulation contribute to sleep problems across psychiatric conditions. For instance, the observed associations between poorer sleep quality and higher levels of subjective distress, social dysfunction, and occupational impairment suggest that disruptions in emotional and behavioral regulation have strong associations due to significant results. This aligns with the idea that persistent arousal—whether physiological or cognitive—impairs sleep onset and maintenance. Therefore, our results extend support for the transdiagnostic framework and highlight the need for interventions that target shared sleep-related mechanisms across disorders.
Due to SPSS rounding p-values to thresholds (e.g., <0.01, <0.001), exact p-values were unavailable for many comparisons. As a result, formal multiple comparison corrections such as Bonferroni or FDR could not be applied. To minimize false positives, a more stringent significance threshold of p < 0.001 for interpreting results was adopted, which may not be as accurate as applying Bonferroni or FDR. Future studies should employ multiple comparison corrections for increased accuracy.
One important limitation of this study is the restricted age range of participants, which was limited to older adults between the ages of 60 and 80 in the ADNI database. As a result, the findings may not generalize to younger populations in whom the onset, expression, and impact of sleep disturbances and neuropsychiatric symptoms may differ. Many neuropsychiatric disorders, such as MDD, generalized anxiety disorder, and bipolar disorder, often emerge in adolescence or early adulthood. Therefore, these results cannot be generalized to younger populations. Future studies should replicate these analyses in more age-diverse samples to determine whether the observed patterns hold true across different developmental stages.
Although the large sample size increases the statistical power of our analyses, it also raises the likelihood that even very small associations will reach statistical significance. However, statistical significance does not necessarily imply practical or clinical relevance. In this study, effect sizes—such as odds ratios and variance explained—were not fully contextualized in terms of their real-world implications. Future analyses should incorporate comparisons to established benchmarks in the literature to better interpret the magnitude and importance of observed effects. This would allow for a more nuanced understanding of the findings beyond p-values alone.
Another limitation of this study is the lack of multivariate modeling to control for potential confounding variables. Future analyses should employ multiple regression or similar techniques to identify the unique contributions of each lifestyle factor to sleep outcomes. This would help clarify whether observed associations remain robust when potential confounders are considered.
Potential confounding covariates such as age and sex were not controlled for. Future studies should include covariate adjustments using ANCOVA or multiple regression to isolate the unique effects of lifestyle factors on sleep outcomes. They may also explore their moderating effects on the relationship between lifestyle factors and sleep. Furthermore, multicollinearity was not assessed among lifestyle predictors. Given the potential overlap among variables like stress, social functioning, and occupational functioning, future studies should examine collinearity diagnostics to ensure stable estimates.
All analyses were conducted using listwise deletion, where participants missing data on any relevant variable were excluded from that specific test. While this approach is straightforward, it assumes data are missing completely at random, which may not be true. Future work should consider using multiple imputation or maximum likelihood methods to reduce bias from incomplete data. Additionally, no formal sensitivity analyses were conducted; thus, future work could formally assess the stability of findings under different model assumptions. Sleep duration was treated as a continuous variable using the raw reported average sleep time per night. No alternative cutoffs or categorical groupings (e.g., short vs. long sleepers) were applied in this analysis. While this simplifies interpretation, future studies may explore threshold-based or clinically defined categories of sleep duration to validate and expand upon these findings.
Although the observed associations suggest a potential mediation pathway (e.g., lifestyle factors such as stress impacting sleep, which in turn affects cognitive or emotional outcomes), no formal mediation analysis was conducted. Future research should employ mediation models to formally test indirect effects and better understand the mechanisms linking lifestyle factors, sleep quality, and neuropsychiatric symptoms.
This study did not control for potentially important confounding variables such as medication use, psychiatric symptom severity, and other health-related behaviors. These factors are known to be correlated with both lifestyle variables (e.g., stress, physical health) and sleep outcomes, and may therefore bias the observed associations. Without multivariate modeling or covariate control, the possibility that some findings reflect the influence of these unmeasured confounders cannot be ruled out. Future studies should incorporate more detailed diagnostic, pharmacological, and behavioral data, and apply multivariable regression modeling to reduce the risk of residual confounding.
Various other measurements could have been added to the lifestyle, physiological, cognitive, and sleep factors that were tested. Such factors include the presence of sleep disorders (i.e. narcolepsy, sleep apnea), more lifestyle factors (diet, smoking, frequency and intensity of physical activity), and more cognitive measurements. These factors may be important as they serve as additional indications of different lifestyles that were not accounted for in this study. Future research can be put towards analyzing several more factors to envisage the comparison of the correlation with sleep and factors, analyze several more neuropsychiatric disorders, and compare the relationship of poor sleep among these different neuropsychiatric populations. Future studies may also explore causational relationships among sleep, lifestyle, and neuropsychiatric disorders.
Identifying strong associations between stress and poor sleep can help clinicians recognize individuals who may be at greater risk for sleep disturbances. This study can be implemented across various health sectors including exercise, lung health, respiration, blood pressure disease, cardiovascular diseases, cognitive psychologists, and linguistics. Most importantly, all of these health professionals recognize that a lack of stress is associated with better sleep, which, in turn, benefits their specific areas of healthcare. Overall, doctors may be able to obtain better results of an individual’s mental and physical processes through analyses of sleep and lifestyle to be able to make inferences relating to the bodily functions of a patient.
In the status quo, many populations underestimate the effectiveness of sleep. Although it has been proved in the past that sleep has many impacts leading to cognitive decline, stress, and even a presence of neuropsychiatric disorders, this paper not only strengthens this claim, but emphasizes that stress is the most prominent factor relating to poor sleep. More attention can also be brought to the significant relationships that poor lifestyle factors have on sleep conditions in the neuropsychiatric populations analyzed in the study. This may help promote more cognitive and behavioral treatment therapies to those suffering with a disorder in order to not only improve their mental symptoms, but also improve their sleep. This is a cycle of positive benefits from a good lifestyle and good sleep.
Methods
The selection of correlational tests and two-sided t-tests as the statistical tools were based on their suitability for the study’s aims. Correlational analyses are ideal for identifying and quantifying the relationships between variables, while the two-sided t-test provided a robust method for comparing group differences.A Pearson’s correlation test was chosen for its ability to identify predictive relationships between lifestyle factors and measurements of sleep quality, without assuming a direct cause-and-effect relationship. The two-sided Independent t-tests were conducted to determine whether there were statistically significant differences between the means of two independent groups. For this study, the t-test was particularly useful in comparing the sleep quality and lifestyle symptoms and factors.
To control for the risk of false positives due to multiple comparisons, a False Discovery Rate (FDR) correction using the Benjamini-Hochberg procedure was intended. However, due to the limited precision of p-values provided by SPSS (which are reported only as ‘<0.001’), formal multiple comparison corrections, such as Bonferroni or FDR, could not be applied. To mitigate the risk of Type I errors, only associations with p-values < 0.001 were interpreted as meaningful.
References
- M. Zarringhadam, S. Hasanvand, M. Birjandi, A. Beiranvand. Associations between cognitive function and lifestyle in community-living older people: a correlational study. BMC Res Notes. 17, 1-9 (2024). ‘ A.R. Anderson and B.J. Fowers. Lifestyle Behaviors, Psychological Distress, and Well-Being: A Daily Diary Study. Social Science & Medicine, 263, p.113263. (2020). [↩]
- M. A. Khan, H. Al-Jahdali. The consequences of sleep deprivation on cognitive performance. Neurosciences. 28, 91–99 (2023) [↩] [↩]
- L. Chunnan, S. Shang. Relationship between Sleep and Hypertension: Findings from the NHANES (2007-2014). International Journal Of Environmental Research And Public Health. 18, (2021). [↩] [↩]
- V. L. Martire, D. Caruso, L. Palagini, G. Zoccoli, S. Bastianini. Stress & Sleep: A Relationship Lasting a Lifetime. Neuroscience and Biobehavioral Reviews. 118, 65-76 (2020). [↩] [↩]
- Y. Mi., X. Lei. Sleep loss and lack of social interaction: a summary interview. Brain-Apparatus Communication: A Journal of Bacomics, 2. (2023). [↩]
- R.P. Ogilvie, S.R. Patel. The Epidemiology of Sleep and Diabetes. Curr Diab Rep 18, 82 (2018). [↩]
- A. D. Krystal. Sleep Therapeutics and Neuropsychiatric Illness. Neuropsychopharmacology : Official Publication of the American College of Neuropsychopharmacology, 45, 166–175 (2020). [↩]
- R. J. Dressle, D. Riemann. Hyperarousal in insomnia disorder: Current evidence and potential mechanisms. Journal of sleep research, 32, e13928 (2023). [↩]


